I. INTRODUCTION
The development of new materials applied in high temperature is a continual requirement, for example, the working temperature of a turbine blade is a key point for the power factor; therefore, the study of materials’ creep properties is an essential precondition of various engineering applications at elevated temperatures.
With the development of microelectro-mechanical systems, mechanical testing of miniaturized specimens has become feasible to research the material’s properties influenced by microstructure, size-effect, and extreme external conditions, etc. Reference Gianola and Eberl1,Reference Hemker and Sharpe2 Several research groups have developed tensile test methods Reference Zupan, Hayden, Boehlert and Hemker3,Reference Karanjgaokar, Oh and Chasiotis4 of materials on the microscale down to several µm even at a high temperature as well as methods for tensile creep testing. Reference Peter, Otto, Depka, Nörtershäuser and Eggeler5,Reference Mälzer, Hayes, Mack and Eggeler6 With this article, a custom-built test setup Reference Leisen, Rusanov, Rohlfing, Fuchs, Eberl, Riesch-Oppermann and Kraft7 for ceramic thin film micro-tensile testing is extended to the tensile creep testing of metallic specimens up to 1000 °C. The purpose of this manuscript is 2-fold: it firstly introduces a customized high-temperature micro-tensile-creep setup for miniaturized specimens with the application of (i) digital image correlation (DIC) for the contactless strain measurement and (ii) a customized system for load and temperature control. Mechanical testing by using miniaturized specimens is both economically and scientifically attractive for materials that are expensive and difficult to manufacture. The second purpose of this article is the discussion of variations in specimen size, the resulting accuracy and limitations with the designed test setup with respect to temperature, strain, and load control. From a scientific perspective, the advantage is that miniaturized specimens can be cut out from designated regions of the material so that heterogeneous local mechanical properties particularly present in multiphase materials, such as single crystalline Ni-base superalloys Reference Grossmann, Biermann and Mughrabi8 or directionally solidified eutectics, Reference Albiez, Sprenger, Seemüller, Weygand, Heilmaier and Böhlke9 can be researched specifically.
In this manuscript, tensile creep tests with miniaturized specimens of the Nimonic-75 alloy, a single-phase Ni–Cr solid solution as a simple reference material for high-temperature structural alloys, were carried out to verify the accuracy and potential of this setup. The results obtained will be assessed against tensile creep tests using conventional specimens under the same load and temperature conditions. Reference Heilmaier10,Reference Heilmaier and Reppich11
II. METHOD
A. Desgin and fabrication of the miniaturized specimens and the corresponding adapter
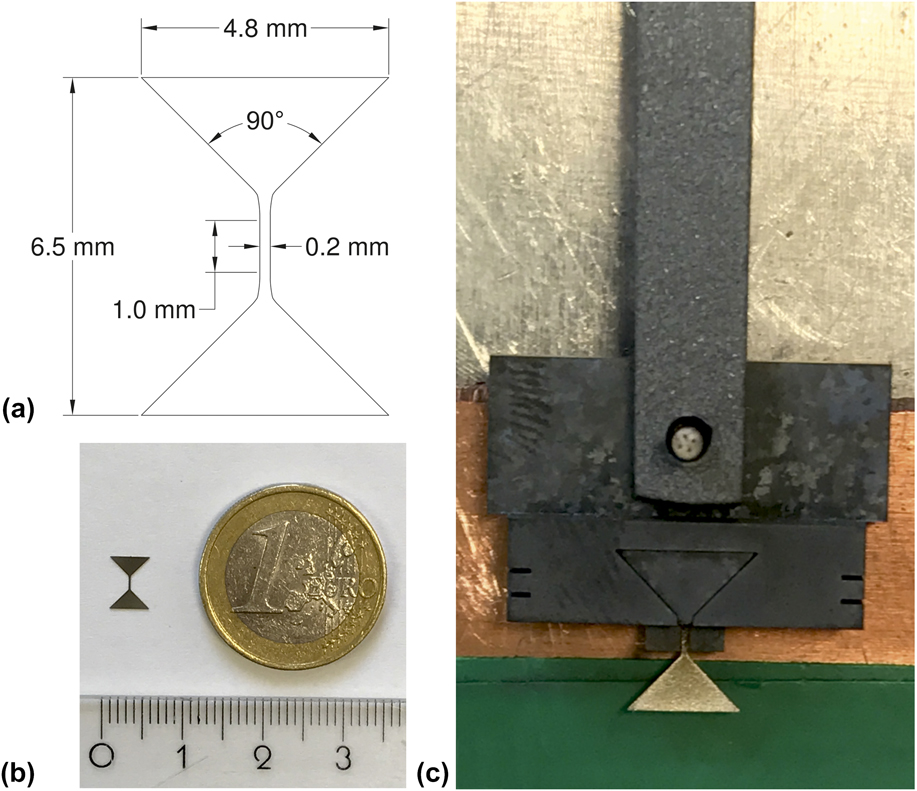
A dog-bone shaped specimen is designed for the microtensile-creep tests. The specimens were cut by using electrical discharge machining (EDM) longitudinally from a Nimonic-75 cylinder with a 15 mm diameter. Nimonic-75 is a solid solution strengthened 80/20 nickel–chromium alloy with controlled addition of titanium and carbon, for which conventional creep results are readily available. Reference Heilmaier and Reppich11,Reference Nganbe and Heilmaier12 The good mechanical properties, oxidation resistance at a high temperature, and the homogeneous microstructure, make Nimonic-75 an ideal reference material for the microtensile-creep setup at elevated temperatures. Figure 1 details the design of the creep specimen having a 1 mm gauge length of 0.2 mm width and 0.2 mm thickness. As the rectangular cross-sectional area in this study is set as 0.04 mm2, the loads for the investigated stress ranging from 10 to 150 MPa are 0.4–6 N. The processing error of the EDM machine with respect to dimensional accuracy is 0.25 µm. Thus, the thickness and the width of each specimen were individually measured by an optical microscope (Nikon Eclipse LV150N, Nikon GmBH, Düsseldorf, Germany) before tensile creep tests to reduce the stress error caused by the dimensional uncertainty as well as by deviations from nominal dimensions due to polishing (mechanical polishing with 4000 grit sandpaper). The specimens were fixed in an adapter made by a high strength, precipitation, and dispersion-hardened nickel-base superalloy PM3030 Reference Nganbe and Heilmaier12 to stabilize the specimens in the tensile creep tests. The design of the adapter and specimen mounting is displayed in detail in Fig. 1. As noted above, miniaturization should provide a means to specifically investigate small regions of inhomogeneities. Therefore, the additional material necessary for the heads of the specimens which is needed for the stability of the specimens is not problematic in our case. This would of course be different, e.g., in the case of irradiated materials, where the overall dimensions of the specimens should be kept small. Then a new design of the grips would become mandatory.
Illustration of (a) the design drawing of the dog-bone shaped micro-tensile-creep specimens, (b) the appearance of the specimens after EDM manufacture, and (c) a mounted specimen in the adapter.

B. Micro-tensile creep setup
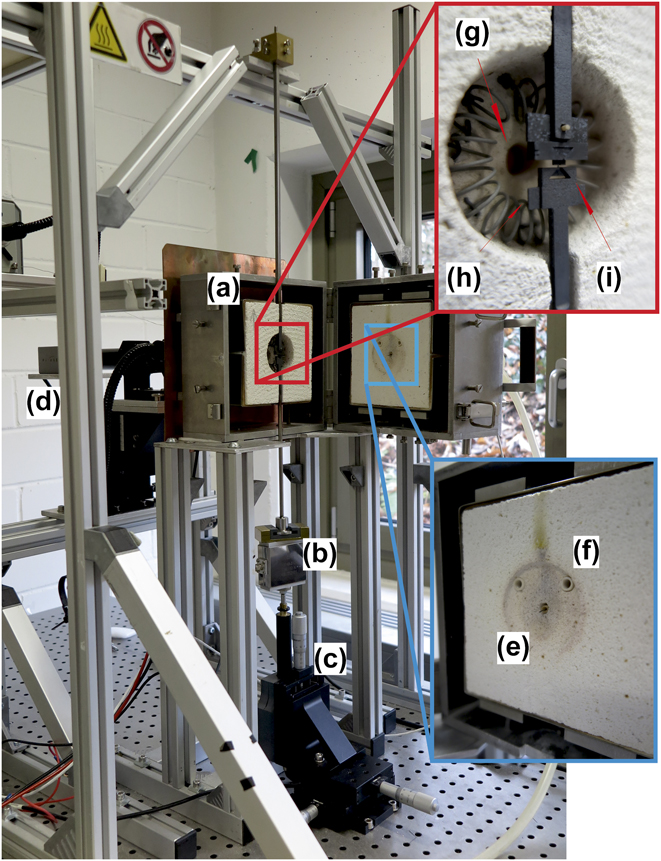
The custom-built setup as shown in Fig. 2 has been originally designed by Leisen et al. Reference Leisen, Rusanov, Rohlfing, Fuchs, Eberl, Riesch-Oppermann and Kraft7 for SiC thin-film high-temperature characterization and was adapted in the present manuscript for high-temperature microtensile-creep tests. The essential components of the setup in Fig. 2 are a vertical split hinged furnace for the specimen heating, a load cell combined with an actuator for load control, and a camera providing the DIC data for strain measurements. The optical access for the DIC measurement is provided via a fused silica glass rod with optically polished faces. The specimen is fixed in a vertical arrangement with two adapters and is placed in the center of the furnace. The temperature is measured with a thermocouple (type S) next to the specimen but without direct contact. To prevent oxidation, the furnace can be flooded by an inert gas such as Ar; however, all tests carried out in this study were done in air.
Microtensile-creep setup. (a) Furnace, (b) load cell, (c) actuator, (d) camera for DIC analysis, (e) thermocouple through furnace door, (f) port for inert gas, (g) view port, (h) heating wire, and (i) the specimen and adapter after assembly.

Compared to the miniature tensile creep method in Ref. Reference Karanjgaokar, Oh and Chasiotis4 that also uses DIC strain measurement but is limited to temperatures below 200 °C, we obtain results up to 1000 °C. A possible drawback of our current setup is the presence of ambient atmospheric conditions; however, since the tests are relatively short (less than 50 h), oxidation at present seems not to be problematic. In Ref. Reference Peter, Otto, Depka, Nörtershäuser and Eggeler5, the gauge dimensions of the miniaturized specimens are 2 × 3 × 9 mm3, and the obtained creep behavior was obviously in a reasonable agreement with results from the standard specimens. Our specimens are roughly one order of magnitude smaller in each dimension (0.2 × 0.2 × 1.0 mm3), one aim of the paper being to extend size limits down to dimensions, where it might be practical to investigate the effect of specific microstructural features (orientation of plates in multiphase materials, grain boundaries, texture) on creep behavior.
C. Heating method
A resistance heating via a spiral-shaped Kanthal A1 wire (Sandvik AB, Hallstahammar, Sweden) with a thermocouple was used for temperature control. The thermocouple is set through the furnace door with its top point located next to the miniaturized specimen but without direct contact (see Fig. 3). The specimen is positioned in the center of the furnace at equal distance to the heating wire. A uniform temperature distribution in the furnace was confirmed by using measurements from three thermocouples at equal distance (5 mm) along the specimen. The maximum temperature difference between the upper/lower thermocouples and the central one is ±2 °C at 1000 °C. The temperature accuracy along the gauge length of the specimens is, therefore, expected to be better than ±1 °C. The heating system allows fast heating rates up to 30 K/s with a temperature control stability of ±0.1 °C. Since the temperature fluctuation can cause thermal strain of the adapter and specimen as well as affect the load stability, it is important to maintain the temperature accurately. An unstable temperature control can also lead to the vibration of the specimen, resulting in a reduction in quality of the optical strain recording and a larger error in the DIC processing. A dwell time of at least one hour after heating is kept in order that the whole system reaches a stable condition.
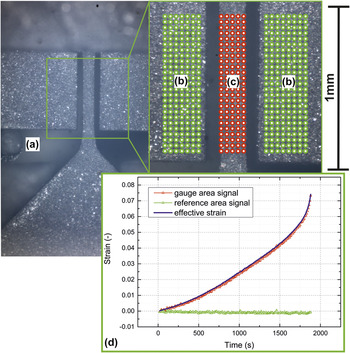
A representative micrograph for DIC calculation. (a) The top point of thermocouple, (b) green dots show the undeformed reference area of the adapter in the experiments, (c) red dots represent the strained area along the gauge length of the specimen, and (d) the specimen strain is calculated by the difference in strain between these two areas.

D. Specimen mounting
The complete specimen installation before testing is shown in the red inlay of Fig. 2. The specimen and adapter are mounted using an auxiliary assembly construction. The dog-bone shaped specimen is first placed in the adapter and then fixed by a triangular cover. The adapter and the upper connect rod are assembled with a ceramic stick going through the openings in the upper rod and adapter to stabilize the specimen in a vertical direction under load (see Fig. 1). The assembled test structure is then transferred to the load system, and the specimen is positioned in the center of the furnace. The lower rod with a concave mouth holds the lower triangular part of the specimen and connects it to the load cell. Contact of the lower rod with the furnace is avoided to prevent any disturbing load influences.
E. Strain measurement
A contactless optical strain measurement using the DIC method is performed. A Matlab open source code with sub-pixel resolution is available for that purpose. Reference Eberl, Thompson, Gianola and Bundschuh13 The DIC method tracks the speckle patterns in images taken by optical microscopy and calculates the deformation of the region of interest by a cross correlation algorithm. Reference Eberl, Gianola and Hemker14,Reference Chu, Ranson, Sutton and Peter15 Speckle patterns with good contrast are the necessary prerequisites for accurate strain measurements. Reference Lecompte, Smits, Bossuyt, Sol, Vantomme, Van Hemelrijck and Habraken16,Reference Pan, Xie, Wang, Qian and Wang17 In our case, the surface of the Nimonic-75 specimens provides sufficient contrast and random speckle patterns so that the DIC calculation is possible without additional surface treatment. A representative micrograph for the DIC calculation is displayed in Fig. 3, showing the reference areas and the strained area used for the DIC method.
The area with green dots represents the reference area, an unstrained adapter surface that should undergo no deformation at constant temperature during the experiments. The area with red dots is the strained area along the gauge length of the specimen. By taking the signal from the two separate areas, two main sources of error in the optical strain recording can be eliminated: the out of plane shift and the rotation of the adapter and specimen. The detailed calculation of the strain errors caused by these two sources follows an analysis of Sutton et al. Reference Sutton, Yan, Tiwari, Schreier and Orteu18 The strain error caused by an out of plane shift can be corrected by identifying the differential strain between the two areas because the adapter and specimen stay in the same translational plane in the experiments, resulting in the identical strain errors. The strain error caused by rotation is eliminated by seeking the central rotation point of both the areas and correcting the measured strains for artificial contributions from the specimen rotation. Additionally, the signal from the two different areas allows for corrections of irregular variations from optical disturbances as well as from drift of the whole arrangement leading to a sensitivity of strain measurements well below the noise level of the disturbances.
F. Load and displacement control
The microtensile-creep tests with this setup are performed under load control. A 10 N load cell (FN 3148-A1-10 N from disynet, Brüggen-Bracht, Germany) and a DC actuator (M-230.25 from Physik Instrumente PI, Karlsruhe, Germany) are combined together to maintain a constant load in the tensile creep tests. The actuator has a 25 mm working distance and a minimum design resolution below 5 nm. The accuracy of the load cell as specified by the manufacturer is 10 mN. Fluctuations in the load signal during high-temperature creep tests can be caused by the thermal expansion, by creep deformation of the loading rods as well as by the heating instability from the furnace. The corresponding fluctuation was measured to be <±1 mN at room temperature and <±3 mN at 1000 °C. Apart from the load condition, the applied stress level is affected by variations in the size of the specimen’s cross section, leading to an increasing stress error for smaller loads and cross sections because the relative uncertainties of the dimensional measurements and load fluctuations are increased. The maximum noise level in the stress signal is under 2%. A detailed error analysis will be given in the following Sec. IV.
III. RESULTS
The accuracy and potential of this microtensile-creep setup were tested with specimens of Nimonic-75 at different temperatures and stresses in air, where results from the tensile creep tests with conventional specimens (diameter 6 mm, gauge length 30 mm) at the same load and temperature conditions are available. Reference Heilmaier and Reppich11 A representative diagram of tensile creep strain versus time at 1000 °C and 40 MPa from a miniaturized specimen is shown in Fig. 3(d).
The DIC method calculates the strains in the gauge area (red curve) and reference area (green curve). As can be seen in Fig. 3(d), the green curve of the undeformed reference area reveals strain values around the zero point with some noise, proving thermal and measurement fluctuations to be on a negligible level. Likewise, the noise of the red curve displaying the elongation of the creep sample is on a similar level. Therefore, the (real) creep strain (blue curve) can be calculated as the differential value between these two strain curves, resulting in an improvement of the strain measurement accuracy. All the creep curves measured for the miniaturized 200 × 200 µm2 specimens possessed a smaller total strain (ε ≤ 0.15) compared to the conventional specimens (ε ≥ 0.3).
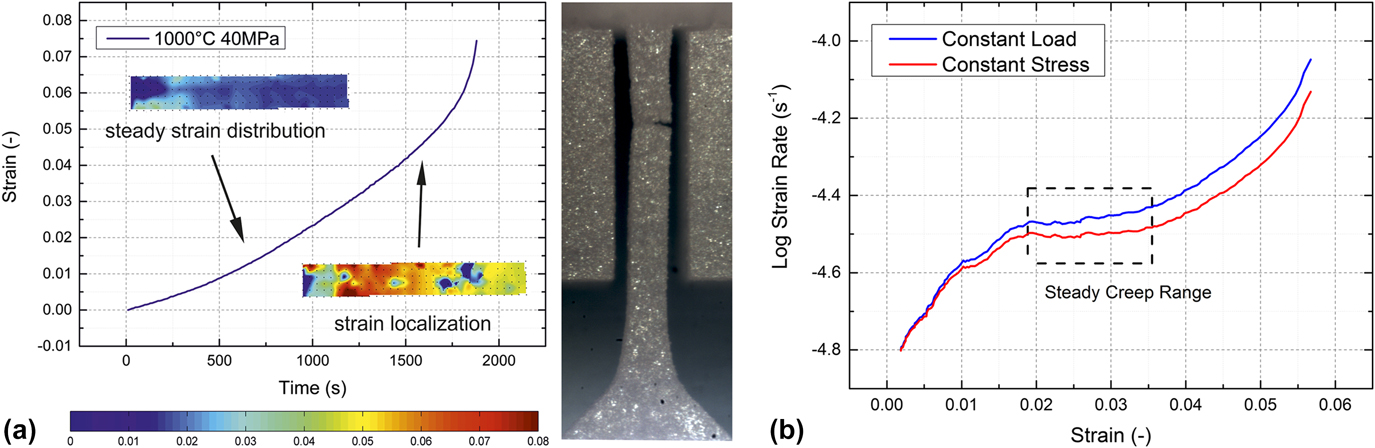
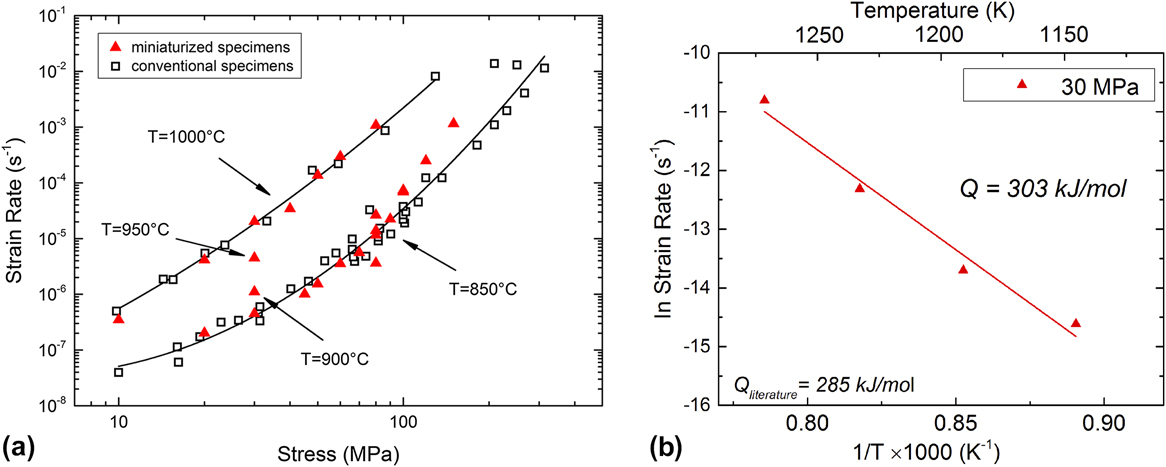
While the conventional specimens show a pronounced steady-state creep range, this is not normally the case for the miniaturized specimens. For those, rather a minimum creep rate, respectively, was observed in the strain rate versus the strain diagram as shown in Fig. 4(b) since identification of primary, secondary, and tertiary creep regions from strain versus time curves proved difficult. The minimum creep rates of the miniaturized specimens in this study and the steady-state creep rates of the conventional specimens Reference Heilmaier and Reppich11 are jointly plotted as the Norton plot in Fig. 5(a) for temperatures of 850 °C and 1000 °C, respectively, and stresses in the range of 10–150 MPa. Figure 5(a) clearly demonstrates that the minimum strain rates of the miniaturized specimens with stress from 20 to 70 MPa at 850 °C (Norton creep exponent n ≈ 2.1) fall into the same range as the values of the conventional specimens (n ≈ 2.8), especially when their scatter is taken into account. For stresses above 70 MPa, minimum creep strain rates from miniaturized specimens (n ≈ 7.4) tend to lie slightly above the steady-state creep strain rates for the conventional-sized samples (n ≈ 5.0). For 1000 °C, results for conventional (n ≈ 3.5) and miniaturized (n ≈ 3.8) specimens agree very well over the entire range of stresses (10–80 MPa).
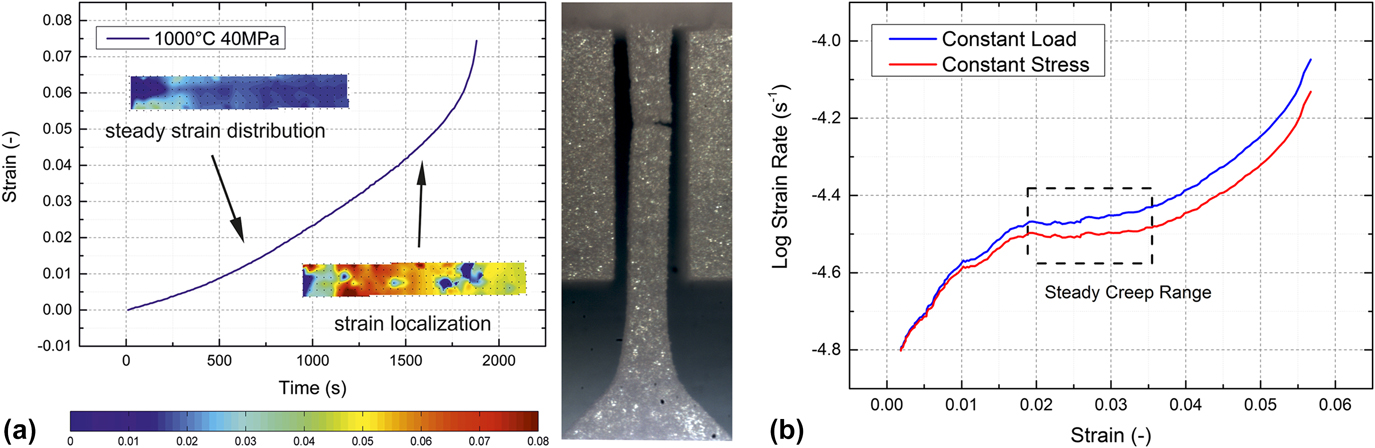
(a) Strain distribution of a miniaturized specimen in the tensile creep test at 1000 °C and 40 MPa by using DIC method. The color bar provides the strain legend. The strain localization leads to the stress concentration in the specimen and causes an accelerated tertiary creep stage. The fracture occurs at the position of strain localization. (b) Logarithmic plot of the creep rate versus strain comparing creep curves (1000 °C and 40 MPa) under constant load (measured) and constant true stress [calculated with converted creep rate according to Eq. (3) using a stress exponent n = 3.5 according to Fig. 5(a)].
(a) Norton-plot of Nimonic-75 summarizing minimum creep strain rates at 850 and 1000 °C with comparison of steady-state creep strain rates for conventional specimens from the literature. (b) Arrhenius plot for an initial stress level of 30 MPa for four temperatures of 850, 900, 950, and 1000 °C, respectively.

Additional tests with temperatures 900 and 950 °C, under an initial stress of 30 MPa were done to calculate the activation energy of the creep for the miniaturized specimens. Hence, data at an initial stress level of 30 MPa for four temperatures of 850, 900, 950, and 1000 °C, respectively, were used in Fig. 5(b) showing the corresponding Arrhenius plot, from which an activation energy of 304 kJ/mol was obtained, in good agreement with the results for conventional specimens of 285 kJ/mol as well as for activation energies for self-diffusion and Cr diffusion according to Frost and Ashby. Reference Frost and Ashby19
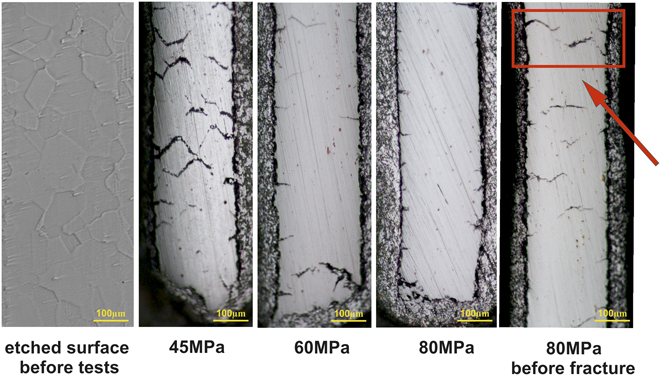
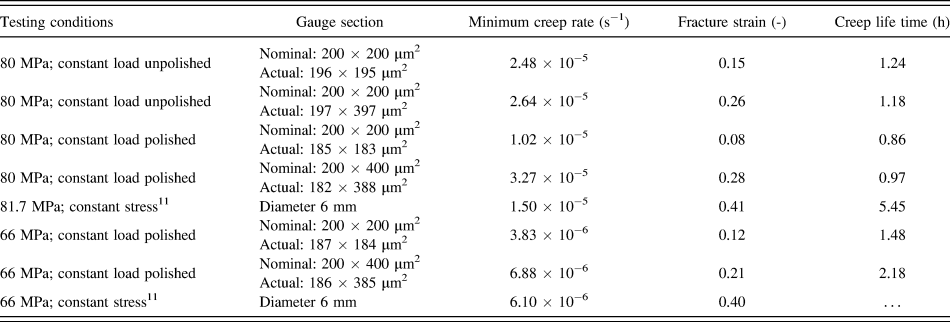
Some of the miniaturized specimens before and after tensile creep tests were mechanically polished to study the development of creep cracks. Figure 6 shows one etched surface of Nimonic-75 before testing and three fractured specimens at 850 °C under initial stress of 45, 60, and 80 MPa, respectively, and one specimen under an initial stress of 80 MPa polished before fracture. From the left etched sample, an average grain diameter of 70 µm can be extracted, i.e., compared to the cross section of the miniaturized specimens 200 × 200 µm2, approximately 2–4 grains exist along the cross section. Since the experiments were done with a single lot of material, the influence of the grain size could not be assessed. However, an influence of the small number of grains within the cross section on the minimum (steady state) creep rate could not be detected. The scatter in both, creep rate and lifetime is comparable to the results from conventional specimens, as can be seen from four results of tests at nominally equal conditions of 850 °C and 80 MPa, see Table I and Fig. 5. Of the four replicated tests at 850 °C, 80 MPa two specimens were used in the EDM condition (non-polished), while two were mechanically polished with 4000 grit sandpaper on all four surfaces to remove the recast layer of about 4 µm. As shown in Fig. 5 we found no significant difference for the minimum creep strain rate from polishing. The fracture time has a range from 0.5 to 3 h with no obvious tendency from polishing. Obviously, the crack length density in the fractured specimens is larger at a lower stress; compare the three middle micrographs in Fig. 6 from right to left. Most cracks were observed to be generated from the surfaces with crack propagation along the grain boundaries, even though the specimens were mechanically polished with a 4000 grit paper before testing. One specimen was polished before fracture at 80 MPa to study the crack growth process. For the interrupted test, an inhomogeneous crack distribution was observed; one region in the gauge length of the miniaturized specimen has a higher crack length density compared to the rest, where only small cracks generated from the surface were found. Two massive cracks from the opposite surface show the trend to join, indicating the potential location of the final fracture.
Micrographs revealing the grain size and the crack status of the miniaturized specimens after tensile creep tests by 850 °C for stresses of 45, 60, and 80 MPa. The arrow shows where two massive cracks will probably lead to final rupture.

Tensile creep results of Nimonic-75 for different specimen geometries at 850 °C.

IV. DISCUSSION
Tensile creep tests with miniaturized specimens of Nimonic-75 by using the customized setup show reliable and reproducible results. The activation energy of 304 kJ/mol is in good agreement with the result of conventional specimens of 285 kJ/mol. In the Norton plot, Fig. 5(a), the minimum creep rates are in the same range as the steady-state creep rates for the conventional specimens. Still the following peculiarities were observed in tensile creep tests with the miniaturized specimens which need further discussion: the minimum creep rates tend to be slightly larger than those for the conventional specimens for stresses above 60 MPa. The fracture strain, which is above 0.3 for the conventional specimens, is significantly smaller for the miniaturized specimens and is generally below 0.15. Also the secondary, i.e., steady state, creep range is not well pronounced, rather a minimum creep rate is noted. In the following, an analysis of the accuracy of the customized setup will be given, and the observed results will be discussed.
A. Accuracy of the customized setup
The micro tensile creep tests were performed under constant load which means that an accurate calculation of the initial stress is essential. The error sources of the stress calculation basically stem from two aspects: the error measurement of the specimens’ cross section and the fluctuation of load during experiments. The cross section of each specimen was measured with a Nikon Eclipse LV150N optical microscope, and the measurement error caused by the measuring uncertainty and the surface roughness is ±1 µm. The measured fluctuation of load has a maximum amplitude of 3 mN and is dependent on the load magnitude as well as on the test temperature. The corresponding error Δσ in the stress σ = F/(w·t) from a Gaussian error analysis can be expressed by:
 $$\Delta \sigma = \sqrt {{{\left( {{{\Delta F} \over {w \cdot t}}} \right)}^2} + {{\left( {{{F \cdot \Delta t} \over {w \cdot {t^2}}}} \right)}^2} + {{\left( {{{F \cdot \Delta w} \over {{w^2} \cdot t}}} \right)}^2}} \quad ,$$
here F is load, w and t are the specimen’s width and thickness, Δw and Δt are the dimensional measurement errors, and ΔF is the sum of the maximum fluctuation of the load amplitude (3 mN) plus the maximum accuracy of the load cell (10 mN) so that ΔF = ±13 mN. The nominal cross section of the miniaturized specimens is 200 × 200 µm2. At a stress of 25 MPa, corresponding to the load 1 N, the relative stress error Δσ/σ is 1.5%. The stress error decreases with increasing stress: for initial stresses larger than 75 MPa, the relative error is below 0.8%.
With the DIC method, displacements and strains are calculated from differences of gray values in digital images of the specimen’s surface. The images are taken during the test and processed after the test is finished. The accuracy is determined by the resolution of the images and is enhanced by image processing methods that achieve subpixel resolution. Reference Eberl, Gianola and Hemker14 The DIC code used for this study has a theoretical accuracy of 0.001 pixel, and the working accuracy according to the image quality is determined as ±0.02 pixel at room temperature. The corresponding strain accuracy in the region of interest in the miniaturized specimen containing 1000 pixels, thus, is 2 × 10⁻⁵. For higher temperatures, optical disturbances reduce the accuracy of the system; still, at a temperature of 1000 °C, the accuracy of strain measurement with the DIC method in this study is below 1 × 10⁻⁴. The resolution limit for the strain rate is of the order of 10−8 (s−1), and a minimum measurement time of 104 s is required to achieve reliable data points, which is acceptable in comparison with the whole experimental period for this strain rate.
B. Creep properties of the miniaturized specimens
For a detailed understanding of the creep behavior of the miniaturized specimens, an analysis with the DIC method providing the strain distribution on the surface of the miniaturized specimen at 1000 °C and 40 MPa is presented in Fig. 4(a).
A secondary creep range from strain 0.018 to 0.035 was determined with the analysis of strain distribution with the DIC method, Fig. 4(a) shows a homogeneous strain distribution within this stage. As the test proceeded, strain localization took place relatively early in the creep life of the specimen and kept increasing until fracture. Consequently, the creep rate increased as well and the appearance of steady-state creep in all the miniaturized specimens in this study was found to be much shorter, normally ranging from strain 0.02 to 0.05, compared with the conventional specimens (typical strain range of secondary creep from 0.1 to 0.2). From the strain at 0.05, all the creep curves have an accelerated creep rate (onset of tertiary creep). One reason for an early onset of tertiary creep may come from the fact that tensile creep tests in this study were carried out under a constant load which means that the true stress increased according to (assuming constant volume of the miniaturized specimens before tertiary creep):
 $$\dot{\varepsilon } = K \cdot \sigma _{{\rm{true}}}^n = K \cdot \sigma _0^n \cdot {\left( {1 + \varepsilon } \right)^n}\quad ,$$
here K is a material constant depending on temperature and n is the stress exponent of the Norton creep law [see Fig. 5(a)]. In Eq. (2), the effect of the specimen deformation on the effective stress in the gauge section was taken into account since it leads to a first-order correction, while discrimination of engineering and true strains is only second order and was not deemed necessary because of the rather small strain values of the miniaturized specimens. At 1000 °C, the value of n is around 3.5. A, and the corrected (“under constant true stress”) strain rate
 $\left( {\dot{\varepsilon }'} \right)$
can be obtained by:
 $$\dot{\varepsilon }' = {{\dot{\varepsilon }} \over {{{\left( {1 + \varepsilon } \right)}^n}}} = K \cdot \sigma _{\rm{0}}^n\quad .$$
A correction for the effect of the specimen deformation on the stress is presented in Fig. 4(b). While the effect is clearly visible for the 40 MPa test at 1000 °C [Fig. 4(b)], it is even more pronounced at higher stresses and lower temperatures. While the plateau and the transient to tertiary creep may be recognized in the first case, there is still a slight (albeit small—10%) increase in the strain rate during a creep phase that might be considered as the secondary creep in the second case. The difference of creep rate at 1000 °C and 40 MPa is small because the total strain here is only 0.06. Considering tests with higher stress (80 MPa) and larger total creep strain as conventional specimens (≥0.2), the increment of the stress should not be ignored. Strain localization was also observed at strain ≥0.035, which causes an early fracture. To test samples at constant true stress in the future, one possible way would be to develop an in situ closed-loop strain-load control system.
Another issue which was claimed responsible for accelerated tertiary creep is specimen oxidation. Reference Krieg, Mosbacher, Fried, Affeldt, Glatzel, Hardy, Huron, Glatzel, Griffin, Lewis, Rae, Seetharaman and Tin20,Reference Bensch, Fleischmann, Konrad, Fried, Rae, Glatzel, Huron, Reed, Hardy, Mills, Montero, Portella and Telesman21 Oxidation layers were also observed after the fracture of the Nimonic-75 miniaturized specimens at temperatures of 850 and 1000 °C. The corresponding compact oxidation layers were 1.3 µm at 850 °C and 2 µm at 1000 °C, resulting in a maximum stress error below 2%. The experimental error caused by the oxide layer is, therefore, acceptable. However, the oxide layer yields different mechanical properties as compared to the inner material and will certainly fracture when the specimens are strained. This implies the generation of cracks from the surfaces of the miniaturized specimens to be a likely cause for premature failure as well. Figure 6 provides the evidence for this standpoint. The specimens of 45 and 80 MPa (fractured) were mechanically polished and the specimens of 60 and 80 MPa (interrupted) were not mechanically polished. As mentioned before, polishing has no significant effect on crack formation. Since the cracks form as intergranular cracks, the edge crack density is expected to be similar and independent of the stress level. The accumulated crack length is generally smaller for the specimens tested at higher stresses, suggesting that for high stresses, propagation of individual cracks is dominant, while at lower stresses, initiation of a network of intergranular cracks seems to be more favored. For a systematic study of the crack length density under various loading conditions, the number of tests is obviously not sufficient.
The miniaturized specimens tested here possess a high surface-volume ratio so that cracks forming at the surface—especially if they propagate as intergranular cracks along grains that extend over a considerable fraction of the specimen cross section—may quickly lead to fracture.
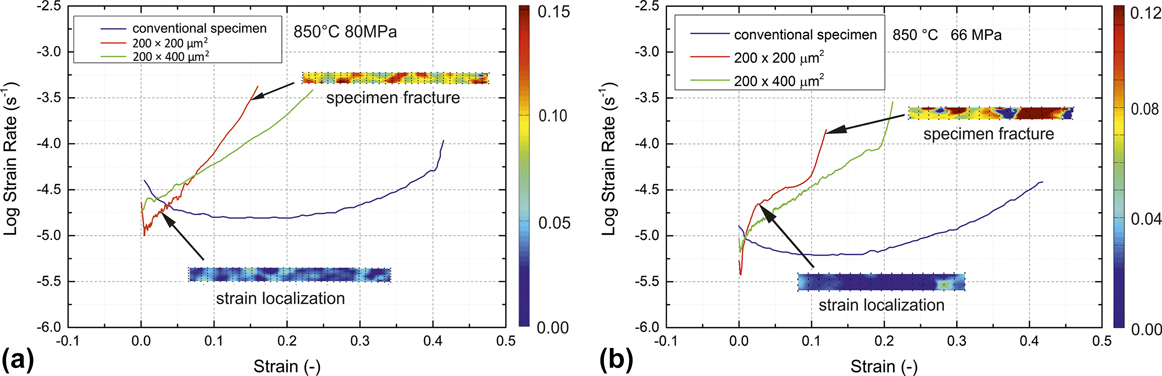
Figure 7 shows the creep strain rate plotted versus true strain from the DIC analysis for the miniaturized specimens tested at 850 °C together with the results at the same test conditions for the conventional specimens for two initial stress levels (66 and 80 MPa, respectively). While the secondary/minimum creep strain rates are similar to the steady-state ones observed for the bulk specimens, the overall shapes of the creep curves are quite different. As already mentioned, the fracture strain is considerably smaller for the miniaturized specimens and there is an early onset of tertiary creep, but as shown for the red and green creep curves, there is a clear tendency toward larger strains to failure when increasing the volume of the sample in the gauge length even if only one dimension of the gauge cross section has been doubled (green curve). We therefore believe that in the miniaturized creep specimens (i) there is currently still a surface effect which leads to premature failure and (ii) the current sample size is too small to mimic the behavior of the conventional samples. Thus, in future, we will continue tests with larger sample geometries in cross section to find the minimum sample size leading to comparable creep behavior. The DIC analysis for the very early stage of creep is met with uncertainties from specimen adjustment (setting) processes that require manual correction and disposal of some of the images. The analysis of the primary creep regime has, therefore, some difficulties and may not be possible for all of the tests. In the tertiary stage, localization effects were eliminated in the DIC analysis by selecting areas at the end of the gauge length for the strain measurement in an “extensometer-like” fashion so that both, the inhomogeneous, local strain distributions within the gauge area as well as the global strain along the gauge length are available. Figure 7 contains insets of the local strain distribution along the curve with the global strain rate versus the strain plot.
Creep strain rate versus strain curves for conventional and miniaturized specimens at 850 °C and (a) 80 MPa (b) 66 MPa together with the strain distribution for 200 × 200 µm2 specimen from the DIC analysis at the onset of tertiary creep and before fracture, respectively.
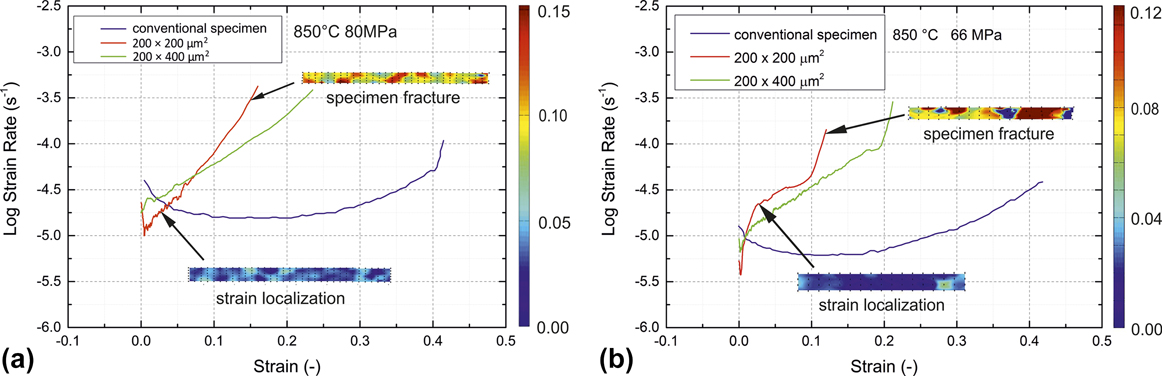
The first indication that the size of the miniaturized specimens is relevant for the fracture behavior is given by test results from miniaturized specimens with a rectangular cross section of 200 × 400 µm2, hence doubling the width of the samples while keeping the other dimension constant, tested at 850 °C and 80 MPa. Table I summarizes the creep results for the different specimen geometries under nominal identical stress and temperature. The fracture strain of two specimens with the double thickness, one polished and one in the EDM condition (unpolished), reached a value of 0.26, considerably above that of the smaller, quadratic specimens. Also no significant effect on the creep life time was observed from polishing.
Our observations of a specimen thickness effect are in line with the early work of Gibbons on Nimonic-90, Reference Gibbons22 where a thickness debit for specimens of 0.15–1.7 mm thickness and similar grain size were observed. Several authors observed a similar effect for directionally solidified Reference Seetharaman, Cetel, Green, Pollock and Harada23 as well as single crystalline Reference Bensch, Fleischmann, Konrad, Fried, Rae, Glatzel, Huron, Reed, Hardy, Mills, Montero, Portella and Telesman21,Reference Seetharaman, Cetel, Green, Pollock and Harada23 Ni-base superalloys (PWA1484, M247LC SX), where oxidation was made responsible for a reduction in creep life and an increase of minimum creep strain rate with decreasing the thickness of the specimens. However, the oxidation mechanism in the Ni-base superalloys leads to the deterioration of the γ′-phase, Reference Krieg, Mosbacher, Fried, Affeldt, Glatzel, Hardy, Huron, Glatzel, Griffin, Lewis, Rae, Seetharaman and Tin20,Reference Bensch, Fleischmann, Konrad, Fried, Rae, Glatzel, Huron, Reed, Hardy, Mills, Montero, Portella and Telesman21 which is not present in Nimonic-75. Seetharaman and Cetel Reference Seetharaman, Cetel, Green, Pollock and Harada23 additionally mention the differences in deformation constraint and plastic anisotropy between the thick and thin sections and obtain a limit for the thickness debit which is around 4 mm. Mälzer et al. Reference Mälzer, Hayes, Mack and Eggeler6 (LEK94) use specimens with a 2 × 2 mm2 gauge section and obtain results in reasonable agreement with results from standard specimens, whereas Wen et al. Reference Wen, Pei, Li, Yue and Gao24 (DD6) observe results similar to conventional specimens at a thickness of 1.2 mm. Gibbons Reference Gibbons22 obtains creep cavitation as the responsible failure mechanism for Nimonic-90 and states 1 mm thickness as the limit for the decrease in creep performance. In conclusion, we have to note that the current sample geometry falls clearly into the regime where superimposed surface effects on the creep behavior have to be expected.
V. CONCLUSION AND OUTLOOK
In this study, we introduced a customized setup to test the tensile creep properties of the miniaturized specimens (with gauge dimensions of 0.2 × 0.2 × 1 mm3). The creep tests with Nimonic-75 as the reference material at temperatures between 850 °C and 1000 °C and within a stress range from 10 to 150 MPa verified the general feasibility of this test method and revealed the specific creep properties of the miniaturized specimens. The following conclusions were obtained:
-
(1) With the customized setup presented in this article, tensile creep tests can be performed at temperatures up to 1000 °C under constant load conditions of stresses from 10 to 150 MPa. The stress dependence of the minimum creep rates of the miniaturized specimens is in good agreement with steady-state creep strain rates for the conventional specimens, despite the fact that the gauge section contains only a few grains. Further, a comparable value for the creep activation energy was also obtained.
-
(2) The fracture strain for the miniaturized specimens is significantly lower compared to the conventional specimens. The miniaturized specimens have a shorter secondary creep stage and an earlier onset of tertiary creep compared to the conventional specimens. This is possibly due to the increasing stress under constant load testing conditions and strain localization, and it would be particularly pronounced for materials with even larger stress exponents. Reference Albiez, Sprenger, Seemüller, Weygand, Heilmaier and Böhlke9,Reference Heilmaier10
-
(3) With increased specimen size, the observed fracture strain seems to approach that of conventional specimens. Further investigations have to provide if there is a limit for the minimum size of the creep specimens with a cross-sectional area somewhere between the 0.2 × 0.2…0.4 mm2 of the present study and the 2 × 3 mm2 of Ref. Reference Peter, Otto, Depka, Nörtershäuser and Eggeler5, where a reasonable agreement with standard-sized specimens had been stated.
-
(4) In contrast to the influence of the constant load mode, the oxidation processes seem to be of minor relevance for creep deformation but may enhance crack initiation on the surface with increasing strain.
ACKNOWLEDGMENTS
This research was financially supported by the Helmholtz Association of German Research Centers under the framework of the Helmholtz Research School on “Integrated Materials Development for Novel High Temperature Alloys”, Grant No. VH-KO-610.