INTRODUCTION
Plankton models are developed to understand how global change, the result of natural and anthropogenically induced climate change, will impact on the structure and function of the planktonic marine ecosystem. Marine planktonic modelling remains enigmatic because it is generated from the non-linear combination of biotic (physiological responses and predator–prey interactions) and abiotic (temperature, pH, light, nutrient supply, contaminant exposure, etc.) ecosystem forcing and has various plankton functional types including phytoplankton, for example, and its diverse groups such as diatoms, cocoolithophorids, nitrogen fixers, picoplankton, phytoflagellates and dinoflagellates (Totterdell et al., Reference Totterdell, Armstrong, Drange, Parslow, Powell, Taylor, Evans and Fasham1993) with their different emergent properties. Anderson (Reference Anderson2005) recently identified a number of problems with the plankton functional types modelling including poorly understood ecology, the difficulty of aggregating diversity within functional groups into meaningful state variables, the sensitivity of outputs to parameters choice and the representation of external physical and chemical environment. So, we need to understand the ecology of plankton well enough to do the model and also need to formulate and test a greater variety of models; perhaps it is time to think beyond the traditional planktonic ecosystem model and look to a different model (Franks, Reference Franks2009).
Traditional conventional multivariate methods (i.e. cluster analysis (CA), discriminate analysis (DA), principal component analysis (PCA), factor analysis (FA), absolute principal component score multiple linear regression (APCS-MLR), factor analysis-multiple regression (FA-MR), etc.) are somewhat limiting for revealing the non-linear and complex dynamic nature that is frequently associated with analysing and synthesizing ecological data because they generally apply for linear data and are less flexible for data handling (e.g. noise and uncertainty) (Chon, Reference Chon2011; Su et al., Reference Su, Zhi, Lou, Huang, Chen and Wu2011). In recent years, artificial neural network (ANN) techniques have become popular in ecological modelling by virtue of their powerful performance. There are two types of ANNs according to the learning algorithms: supervised ANNs are used for data estimation (e.g. prediction and environmental community causality relationships) based on a priori knowledge and unsupervised ANNs are used when deriving information from data (e.g. ordination and classification) without previous knowledge (Kohonen, Reference Kohonen1982). The Self-Organizing Map (SOM), based on an unsupervised neural network (Kohonen, Reference Kohonen1982, Reference Kohonen2001), appears to be an effective method for feature extraction and classification. It maps high-dimensional input data onto a low dimensional (usually 2-d) space while preserving the topological relationships between the input data. As a pattern recognition and classification tool, the SOM finds widespread use across a number of disciplines (Kaski et al., Reference Kaski, Kangas and Kohonen1998; Oja et al., Reference Oja, Kaski and Kohonen2002). The SOM has also been applied in oceanography by Ainsworth (Reference Ainsworth1999) and Ainsworth & Jones (Reference Ainsworth and Jones1999) for chlorophyll estimates from satellite data, by Silulwane et al. (Reference Silulwane, Richardson, Shillington and Mitchell-Innes2001) and Richardson et al. (Reference Richardson, Pfaff, Field, Silulwane and Shillington2002) to identify ocean chlorophyll profiles, by Hardman-Mountford et al. (Reference Hardman-Mountford, Richardson, Boyer, Kreiner and Boyer2003) to relate satellite altimeter data with the recruitment of the Namibian sardine, by Ultsch & Roske (Reference Ultsch and Roske2002) to predict sea level, and by Richardson et al. (Reference Richardson, Risien and Shillington2003) and Risien et al. (Reference Risien, Reason, Shillington and Chelton2004) to extract sea surface temperature (SST) and wind patterns from satellite data. Nevertheless, for oceanographers unfamiliar with neural network techniques, the SOM remains a ‘black box’ with associated scepticism. In this paper, the SOM is applied for visualization and abstraction of the complexity of environmental–phytoplankton relationships in the macrotidal Gyeonggi Bay, Korea.
The entire Gyeonggi Bay is a useful site for comparative estuarine science because it comprises two connected, but distinct subsystems: Gyeonggi Bay (GB) and Shihwa Lake (SL). GB is a shallow macrotidal and well-mixed estuary limiting the accumulation of oraganic matter; but unpredictable inputs from Han River discharge can maintain nutrient availability. SL, on the other hand, is the artificial saltwater lake constructed from 1986 to 1994 and suffered from severe eutrophication, anoxia as well as environmental disaster (Han & Park, Reference Han and Park1999). By the late 1980s to mid-1990s, the entire GB is heavily impacted by eutrophication, caused by nutrient input from the densely populated and industrialized catchment area, resulting in an increase in phytoplankton biomass and primary production including alternations to species distributions, composition and phenology (annual bloom dynamics) (Park & Park, Reference Park and Park2000; Yang et al., Reference Yang, Choi and Hyun2008). However, in the past (1980s), GB's phytoplankton seasonality followed a single spring diatom bloom that was triggered by increasing daily irradiance and atmospheric heat input that stratifies the water column after winter mixing brings nutrients to the surface (Choi & Shim, Reference Choi and Shim1986c). In contrast, recently (2000s), GB's waters present diverse seasonal patterns with large variability from diatom (siliceous) blooming during winter to non-diatom blooming during summer related to complex interactions among physical, chemical and biological processes (Yang et al., Reference Yang, Choi and Hyun2008). In general, phytoplankton seasonality at the estuaries is driven by more than a few climatic factors (Cloern & Jassby, Reference Cloern and Jassby2008). This is a fundamental ecological distinction from the open marine and terrestrial biomes. It confirms Longhurst's (Reference Longhurst1995) insightful conclusion about the unpredictability of oceanographic processes along the margins of the oceans, where it is exceedingly difficult to generalize the processes which determine seasonality of plankton production. Hence, coastal ecosystem models are tools that offer an explicit framework for integration of the knowledge gained as well as detailed investigation of the underlying dynamics and the reason for it, into a management approach.
The purpose of this study is to apply SOM as a modelling approach to pattern, classification, clustering and visualization of ten main environmental parameters (temperature, salinity, pH, DO, SS, COD, NO3, NO2, NH4 and PO4) and phytoplankton biomass (chlorophyll-a) on the GB and SL during 1986–2004. We also discuss the underlying mechanisms of phytoplankton blooms and the eutrophication impacts on phytoplankton community structure based on present and past surveys.
MATERIALS AND METHODS
Study area
GYEONGGI BAY
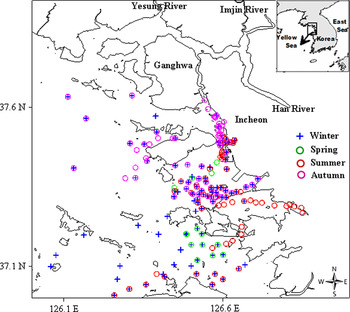
The GB (Figure 1) has a number of features that typify shallow and coastal plain estuaries, including: (1) morphology characterized by a broad shallow channel of 10–20 m depth flanked by tidal flats >3 km width (Choi & Shim, Reference Choi and Shim1986a); (2) macro-tidal (tidal amplitude >10 m) bay specialized by semi-diurnal strong tidal currents (1.2–2.3 and 0.9–1.9 ms−1 during spring and neap tides, respectively) and strong winter monsoon (3.77 ms−1) sweeps over the bay to introduce vertical mixing causing the resuspension of the bottom sediment (KMA, 2010); (3) wet summer season represented by huge Han River discharge (55 × 106 m3d−1) induces higher compensation depth that is inversely related with turbidity, and light favourable for phytoplankton blooms (Park et al., Reference Park, Kim and Han2000); alternatively (4) huge turbidity by winter mixing resuspended sediment particles and upward flux of nutrients in spite of low river discharge responsible for tychopelagic plankton (Choi & Shim, Reference Choi and Shim1986c). Despite huge Han River flow, symptoms of stratification in lower GB are quite absent due to a well-mixed water body, except the Han River estuarine region during summer where vertical gradients of salinity stratification (salinity difference >5 psu) have often been observed (NFRDI, 2008; Park et al., Reference Park, Kim and Han2000). No hypoxia has been reported.
Map showing the study area and geographical distribution of study stations. Dotted circle represents ‘Upper Gyeonggi Bay' regions.

SHIHWA LAKE
The reclamation of an intertidal flat created Shihwa Lake (SL) in Gyeonggi province on the western coast of Korea during December 1986 to January 1994. The lake is enclosed by 12.7 km of sea dike and has a surface area of 42.3 km2, water storage capacity of 332 million tons with a management water level at –1.0 m, a maximum depth of 18 m, and a total seawater flux of 380 million tons per year (MOMAF, 2006). The artificial saline lake was expected to transform into a freshwater one to be used for irrigation purposes and, however, the drainage structure of the lake does not allow the entrapment of Yellow Sea water to be fully replaced by freshwater from its hinterland, which led to the project failure. Furthermore, the severe deterioration of lake-water quality in the mid-1990s prompted evaluations of environment impact (Park et al., Reference Park, Kim, Cho, Kim and Park2003a; Yoo et al., Reference Yoo, Yamashita, Taniyasu, Lee, Jones, Newsted, Khim and Giesy2009) and eutrophication, consequently, progressed rapidly brought about by the untreated sewage and wastewater flowing in from the Shihwa adjacent area (Kim et al., Reference Kim, Park, Lee and Kim2004). The main tributaries of the lake consist of nine streams: four waterways traversing the industrial area, i.e. the Okgu, Gunga, Jeongwang, and Siheung streams, and the Singil, Ansan, Banweol, Dongwha, and Samwha streams, with the last three passing through the Shihwa constructed wetland (Oh et al., Reference Oh, Kim, Yi and Zoh2010).
Field data
Our database was built up based on the environmental data collected from environment research reports which were released by several institutions (Korea Ocean Research and Development Institute (KORDI), Ministry of Construction and Transportation (MOCT), Ministry of Land Transport and Maritime Affairs (MLTM), Centre for Coastal Environments of Yellow Sea (CCEYS), Korea Water Resources Corporation (K-water), Korea Electric Power Corporation (KEPCO), Incheon Free Economic Zone (IFEZ), Ocean Science and Technology Institute Inha University (OSTI), Sudokwon Landfill Site Management Corp (SLC) and Korea Aggregates Association Incheon Brance (KAA)) over 19 years (1986–2004). These surveys were conducted at surface waters in the study area (Figure 1). We would consider particularly ten physico-chemical parameters (temperature, salinity, pH, dissolved oxygen, suspended sediment, chemical oxygen demand, ammonium, nitrate, nitrite and phosphate) and chlorophyll concentrations. Temperature and salinity were measured using CTD, STD or T-S bridge. Dissolved oxygen (DO) concentration was measured using a DO meter (YSI), CTD or Winkler method and pH was measured using CTD or pH meter. Suspended sediment (SS) and chemical oxygen demand (COD) were determined by gravimetric analysis using the glass fibre filter and dichromate reflux methods, respectively. Nutrient concentration and chlorophyll-a were determined using the methods of Parsons et al. (Reference Parsons, Maita and Lalli1984). For clustering and organizing of the study area using SOM, we used about 800 study stations, which included 10 parameters from 1986–2004. Note that, during 1986–1994, our data sets contain some missing values and the SOM is a good method to recover them. The idea is as simple as to use the centre of each subclass to estimate the missing values of a value of a given observation. The virtue of the SOM regarding this problem is twofold: first, it is a non-parametric regression procedure that does not suppose any underlying models of the data set; and secondly it uses the information from similar observations to refine the positions of subclasses' centres and hence gives better estimation (Latif & Mercier, Reference Latif, Mercier and Matsopouls2010). However, we used continuous ten years (1995–2004) data for temperature, salinity and chlorophyll-a, for the analysis on the long-term variation of phytoplankton dynamics which ignored the spatial variability at surface water of the entire bay.
Self-Organizing Map (SOM)
In order to extract the structure of the high-dimensional data formed by the sample units (site-year), a method based on ANNs using an unsupervised algorithm called SOM (Kohonen, Reference Kohonen2001) has been used. SOMs are different from other artificial neural networks in the sense that they use a neighbourhood function to preserve the topological properties of the input space (Kohonen, Reference Kohonen2001). This makes SOMs useful for visualizing low-dimensional views of high-dimensional data akin to multidimensional scaling.
The SOM consists of two layers: input and output layers connected by connection intensities (weights). The input layer gets information from data matrix, while the output layer visualizes the computational results. When an input vector x is sent through the network, each neuron k of the network computes the distance between the weight vector w and the input vector x. The output layer consists of D output neurons, which are usually arranged into a two-dimensional grid for better visualization. There are no strict rules regarding the choice of the number of output neurons (Park et al., Reference Park, Song, Park, Oh, Cho and Chon2007). In this study, we used 10 environmental parameters as input units and 200 (20 × 10) neurons as the number of output neurons for a hexagonal lattice. The optimum map size was chosen based on minimum values of quantization and topographic errors (Kiviluoto, Reference Kiviluoto1996; Kohonen, Reference Kohonen2001), and ecological knowledge about the study area. SOM can be interpreted as a non-linear projection of the high-dimensional input data onto an output array of units. The best arrangement for the output layer is a hexagonal lattice, as it does not favour horizontal and vertical directions as much as rectangular arrays (Kohonen, Reference Kohonen2001). Among all the D output neurons, the best matching unit (BMU) with minimum distance between the weight and input vectors is the winner. For the BMU and its neighbourhood neurons, the weight vectors w are updated using the SOM learning rule. As a result, the network is trained to classify the input vectors according to the weight vectors that are closest to them.
A detailed description of the SOM algorithm has already been given by Kohonen (Reference Kohonen2001) for the theory and Park et al. (Reference Park, Cereghino, Compin and Lek2003b, Reference Park, Chon, Kwak and Lek2004) for ecological application. The learning process of the SOM was carried out using the SOM Toolbox (Alhoniemi et al., Reference Alhoniemi, Himberg, Parhankangas and Vesanto2000) developed by the Laboratory of Information and Computer Science in the Helsinki University of Technology (http://www.cis.hut.fi/projects/somtoolbox/) in Matlab environments (The Mathworks, 2001), and we adopted the initialization and training methods suggested by the authors of the SOM Toolbox that allow the algorithm to be optimized (Vesanto et al., Reference Vesanto, Himberg, Alhoniemi and Parhankangas1999).
To test for the difference of environmental parameters including chlorophyll-a, one-way analysis of variance (ANOVA) was applied and Tukey's post-hoc test for multiple comparisons among means to detect differences using SPSS for Windows version 12.0.1 (SPSS Inc, Chicago, III) was followed. Differences are significant at 95% (P < 0.05). In order to quantitatively analyse and confirm the relationships between chlorophyll-a and environmental parameters in each group, the Pearson's correlation analysis was applied.
RESULTS
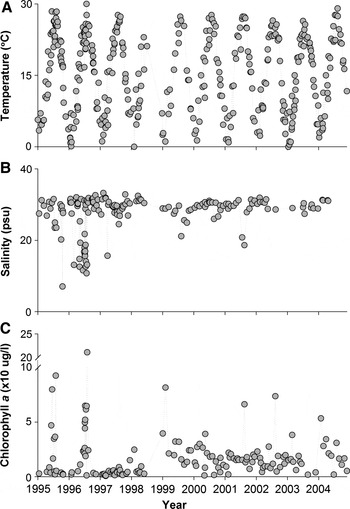
Figure 2A, B illustrates the temporal variation of temperature and salinity during 1995–2004. Water temperature ranged from 0.0 to 300C (mean 15.60C) with lower values during winter and maximum values in summer (Figure 2A). Salinity variation was a reverse trend of temperature. Salinity ranged from 7.1 to 33.2 psu (mean 27.7 psu) with lower values during the summer wet season and a higher value in winter (Figure 2B). The lower values of salinity (<10 psu) were particularly recorded in August 1995, July 1996 and July 1997 at the SL region because of untreated sewage and waste water inputs from the watersheds and limited physical mixing during the stratified periods (1994–1999). The characteristics of the lake water quality slightly changes after 1999, the period when seawater dilution was allowed to improve the deteriorated water quality. Moreover, the salinity of the stations located at the upper bay and at near the tributaries was lower than those of middle and lower bays due to the freshwater input from rivers (spatial data not shown).
The temporal variation of temperature (A), salinity (B) and chlorophyll-a concentration (C) during the last decade (1995–2004) in Gyeonggi Bay.

In this study, chlorophyll-a concentration ranged from 0.7 to 210.7 (mean 18.3) µgl−1 (Figure 2C). High chlorophyll-a concentration (>10 µgl−1) was recorded during the summer season (i.e. July 1996, August 1996, August 1998) in the upper GB, Incheon harbour and vicinity of SL (spatial data not shown). The phytoplankton biomass increased about twofold from the mid-1990s to the mid-2000s and phytoplankton blooms were often detected in all areas of the bay through the seasons. In addition, winter blooms (>110 µgl−1 in December of 1997) were recorded because of the increase in abundance of Thalassiosira nordenskioeldii Cleve. The peak of phytoplankton biomass also frequently occurred during spring and autumn over the past decade.
Model result
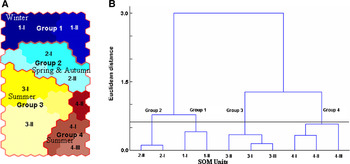
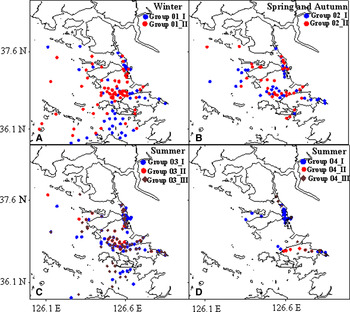
After learning the process of the SOM with environmental parameters, the study stations were divided into four large groups with ten different subgroups at different linkage distances according to the hierarchical cluster analysis with Ward's linkage method (Figure 3A, B). The study stations, as results of SOM and cluster analysis, first were divided according to seasonal characteristics. The group 1, which was located at the upper part on the map, was characterized as winter, whereas groups 3 and 4 located at the lower part were characterized as summer. The group 2 showed the intermediate characteristics between group 1 and groups 3 and 4, characterized as spring and autumn. Each group was subdivided into 2 and 3 sub-groups according to the characteristics of environmental parameters. Figure 4 A–D shows the representative location for each SOM group in the geographical map of the GB and SL. SOM group 1 (winter) encompassed sites from the enormous GB and SL regions with 2 sub-groups based on site-specific environmental values. All sites from group 2 (spring and autumn) belonged to the upper-middle GB and SL stations, and were partitioned into 2 sub-groups. Finally, group 3 (summer) also corresponded to large GB and SL regions, whereas group 4 (summer) was strictly located at upper GB, inside and outside of SL with 3 sub-groups. It is remarkable that most of the sub-group sites during summer were still overlapped by others due to site-specific environmental values and coastal hydrological processes.
Classification of study stations on the Self-Organizing Maps (SOM) map trained with environmental parameters and subgroup in each large group (A), and a dendrogram of hierarchical cluster analysis using Ward linkage method with Euclidean distance showing relations among groups defined in the SOM map (B).

Geographical distribution of study stations based on the trained Self-Organizing Maps in each group and subgroup (A, Group 1; B, Group 2; C, Group 3; D, Group 4).

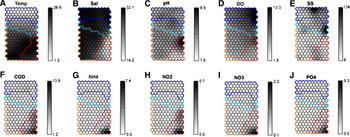
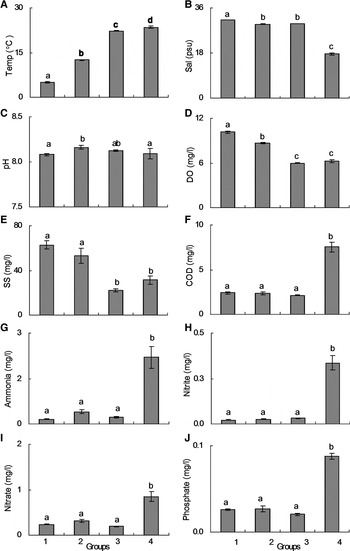
Estimated values of each parameter in the trained SOM map are visualized in grey scale in Figure 5. Dark areas on the map represent high values of each parameter while light areas represent low values. Each environmental parameter shows significantly different distribution patterns among different groups on the SOM map (one-way ANOVA, P < 0.05) (Figure 6). Temperature was low in group 1 (winter) and high in groups 3 and 4 (summer). In contrast, the salinity showed a different pattern, with high in group 1 (winter: 34) and low in group 4 (summer: 18). Group 2 (spring and autumn) and group 3 (summer) showed somewhat similar salinity gradient. In case of pH, group 2 showed slightly higher concentrations than other groups. Dissolved oxygen concentration and suspended sediment concentration were the highest in group 1 (winter), while chemical oxygen demand and nutrient concentrations were the highest in group 4 (summer). Nutrient and COD profiles divided into two parts among the four SOM groups. The SOM group 4 was characterized by the highest nutrients and COD, whereas the remaining SOM groups (1–3) were designated by lower nutrients and COD.
Visualization of environmental parameters calculated in the trained Self-Organizing Maps (SOM) in grey scale. The values were calculated during the learning process (A, temperature; B, salinity; C, pH; D, dissolved oxygen; E, suspended sediment; F, chemical oxygen demand; G, ammonia; H, nitrate; I, nitrate; J, phosphate). The blue, turquoise, yellow and red lines represent SOM groups 1, 2, 3 and 4, respectively. See online publication.

The characteristics of environmental parameters in each group defined on the Self-Organizing Maps SOM map. Error bars indicate the standard error of each variable. Different alphabets (a,b,c,d) on the bars display significant differences (P < 0.05) between groups based on Tukey's multiple comparison test (Temp, temperature; Sal, salinity; DO, dissolved oxygen; SS, suspended sediment; COD, chemical oxygen demand); shared alphabets between groups indicate no significant difference.

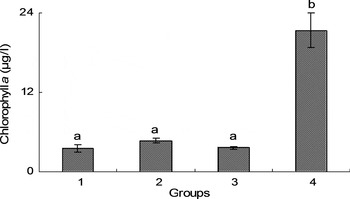
The phytoplankton biomass also showed significant difference (one-way ANOVA, P < 0.05) among groups (Figure 7). The highest chlorophyll-a concentration was detected in group 4 (summer). These stations belonging in group 4 were considerably influenced by massive nutrient inputs in summer. The chlorophyll-a concentrations in group 2 (spring and autumn seasons) were a little higher than in other groups (groups 1 and 3), though there is no significant difference among these three SOM groups.
Chlorophyll-a concentration of each group for determination of environmental parameters. Error bars indicate the standard error. Different alphabets (a,b,c,d) on the bars display significant differences (P < 0.05) between groups based on Tukey's multiple comparison test; shared alphabets between groups indicate no significant difference.

Correlations between phytoplankton biomass of each group and environmental parameters were examined by Pearson's correlations analysis (Table 1). In SOM groups 1 and 2, phytoplankton biomass was significantly correlated with salinity (r = −0.27) and temperature (r = −0.22), respectively. In SOM groups 3 and 4, chlorophyll-a concentration was positively correlated with temperature and DO (r = 0.24, r = 0.26, respectively), and negatively correlated with salinity (r = –0.28, r = –0.40, respectively). This weak relationship between phytoplankton, and temperature and salinity, reveals it to have a pronounced eurythermal and euryhaline nature. Phytoplankton biomass showed insignificant relationships with nutrients in SOM groups 3 and 4 (summer). In addition, phytoplankton biomass was negatively correlated with suspended solids (r = −0.27) in SOM group 4.
Correlation coefficient between the phytoplankton biomass of each group and the environmental parameter: *, P < 0.05; **, P < 0.01.

Temp., temperature; Sal., salinity; DO, dissolved oxygen; SS, suspended sediment.
DISCUSSION
The SOM techniques
The non-linearity and complexity of variables involved in water quality have led many researchers to use the ANN model to simulate these variables due to the ability of such models to handle complex, non-linear relationships (Richardson et al., Reference Richardson, Pfaff, Field, Silulwane and Shillington2002, Reference Richardson, Risien and Shillington2003; Park et al., Reference Park, Cereghino, Compin and Lek2003b, Reference Park, Chon, Kwak and Lek2004; Song et al., Reference Song, Hwang, Kwak, Ji, Oh, Youn and Chon2007). In this particular study, SOMs demonstrated their effectiveness for assessing four seasonal patterns from multidimensional environmental time-series data during 1986–2004 (Figure 3). Park et al. (Reference Park, Chon, Kwak and Lek2004) compared the SOM and PCA, and found that SOM grouping was more relevant to ecology, revealing different effects of pollution states, and impact of spatial and temporal variations in environment. For example, the SOM, by explaining total variance in the data, was able to describe more directly the discriminatory power of input variables in mapping, while PCA explained less than 30% of the total variance in the data (Park et al., Reference Park, Chon, Kwak and Lek2004). One of the most significant characteristics and contributions of using SOM is that the results obtained by SOM can be visualized from its topology map (Figure 5). Once the SOM has converged, it stores the most relevant information about the process in its topology map and allows all such information to be displayed, something that is not possible with the standard output from cluster analysis or multidimensional scaling (Richardson et al., Reference Richardson, Pfaff, Field, Silulwane and Shillington2002). Figures 3 and 5 present the SOM topology maps, which have 20 × 10 grids (neurons) with each neuron representing a cluster of similar input patterns; in fact, results are more robust with large data sets because the SOM can learn from more data. The SOM could be used on data sets with thousands of profiles: these would be more difficult to analyse with PCA, cluster analysis or multidimensional scaling (Richardson et al., Reference Richardson, Pfaff, Field, Silulwane and Shillington2002). For ordination on a simple output space, SOM had the advantage over PCA, independent component analysis and multidimensional scaling, of visualizing the distance compression on the projected space (Ultsch & Morchen, Reference Ultsch and Morchen2006). This interesting property was used to define our 4 SOM groups. Another advantage was to cluster and ordinate in a single analysis, which is not possible with classical multivariate analysis like DCA.
A limitation of the SOM technique is that it is not underpinned by a rigorous statistical framework, as is PCA. Thus, the SOM provides no significance level for the patterns and does not give the proportion of variance explained by the patterns. Therefore, additional analysis (e.g. post hoc permutation and randomization tests) have to be computed as we did in this study. A perceived difficulty in using SOM to identify patterns is that the number of patterns chosen is arbitrary, as the researcher chooses the dimensions for the output maps. Moreover, as Bowden et al. (Reference Bowden, Dandy and Maier2005 a, Reference Bowden, Maier and Dandyb) pointed out, there are several disadvantages with this approach, including the increase of computational complexity and memory requirements, difficulty in learning, increase of the complexity of the model and consequently, a difficulty in understanding the model as well as increasing noise due to inclusion of spurious input variables.
Relating SOM pattern to seasonal and spatial variability in environmental parameters and phytoplankton biomass
In Figure 4, the four SOM groups matched with the geographical distribution of the sampling sites and described that spatial variation with site-specific physical–chemical oceanographic parameters was the main factor for characterizing estuarine phytoplankton distribution in GB on a large scale. Geographical location was effectively identified with the clusters according to the trained SOM. Noteworthy, phytoplankton variability may result from changes in the physical characteristics of a system (e.g. hydrology, wind-driven resuspension and tidal mixing), biological interactions (e.g. reduced grazing), or an increased organic and inorganic nutrient loading; all these processes vary between ecosystems and change over time within ecosystems (Rabalais et al., Reference Rabalais, Turner, Diaz and Justic2009). Most of the sites, however, in each SOM group were located within a distinct geographical area. The SOM 4 group (summer), for example, located at SL and Upper GB, is a more eutrophic state characterized by algal blooms, enhanced nutrients, temperature, lower salinity, suspended solids and dissolved oxygen. In contrast, the other three SOM groups (groups 1–3), located at broad macrotidal of the GB region, are a non-eutrophic state characterized by lower chlorophylls, nutrients, higher salinity and suspended solids. Therefore, these two alternative states demonstrated the SOM mapping feasibility regarding provision of information on geographical distribution and algal blooming pattern at the same time.
Even if most of the SOM group-subgroups could be distinguished from each other in topological maps (Figures 3 & 5), some of the sub-group stations were still overlapped by others (Figure 4). This might be explained by site-specific environmental values and different coastal hydrological processes. The SOM 4 subgroups (4I–III; summer: upper GB and SL) showed, for example, meaningful ecological interpretations by salinity stratification and were markedly differentiated from well-mixed macrotidal SOM 3 (summer: lower GB). Generally, the bulk of sea surface salinity during summer is low by comparison with the freshwater fluxes into the surface layer because of precipitation and rainfall resulting in vertical salinity contrasts (<5 psu) (NFRDI, 2008). Moreover, stratification at upper GB and SL might also cause rapid settling of suspended particulate by forming floccules at the time of mixing of freshwater with saline seawater during downstream transport (Postma, Reference Postma and Lauff1967).
Efficiency of mapping was further demonstrated in the clusters designated within the same summer season. In contrast to SOM 4, the SOM 3 systems generally exhibit lower levels of chlorophyll-a and nutrients, and are also characterized by macro-tidal activities through advection and diffusion processes responsible for this different response. Fundamentally, well-mixed circulation in an estuary occurs where the tidal prism is significantly larger than river discharge, and the tidal currents retard any tendency toward stratification of fresh and saltwater, and this increased mixing therefore experienced lower photosynthetic activity and chlorophyll-a because of a reduction of the residence time of the algae in the photic zone (Monbet, Reference Monbet1992). To the extent that GB lower coastal ecosystems (SOM 3) also differ from Upper GB and SL (SOM 4) by the presence of salinity gradients, horizontally and vertically, and some other inherent physical (i.e. tide, wind, basin geography and river flow) these attributes operate in concert to set the sensitivity of this ecosystem to nutrient enrichment. Neither the lower GB nor the San Francisco Estuary (Hager & Schemel, Reference Hager, Schemel and Hollibaugh1996; Lucas & Cloern, Reference Lucus and Cloern2002) and the Delaware Bay (Sharp, Reference Sharp, Dyer and Orth1994) have a major problem with nutrient eutrophication, largely because neither shows summer stratification, which makes them unlike the Chesapeake Bay.
Through the learning process of the SOM, we demonstrated that the characteristics of the samples on a large scale were distinctively identified in the clusters, although statistical test revealed homogenized features in SOM groups 1, 2 and 3 based on nutrient and chlorophyll scenarios. In GB, winter season (SOM 1) has distinct features over spring and autumn (SOM 2) by its adverse hydro-regions. Note that, GB's winter season is characterized by high SS resulting from resuspension of sediments through the tidal mixing (convectional mixing being due to the heat exchange and evaporation) and winter mixing due to the strong cold north-west wind (Choi & Shim, Reference Choi and Shim1986b). The effects of suspended solids on phytoplankton are generally not direct; rather the effects are mediated through the agency of light fluctuations. Intense SS concentrations can limit light penetration and suppress cell growth as well. Light limitation, for example, is expected to result in decrease in the half saturation constant for nutrient-limited growth (Flynn, Reference Flynn2003), affecting the kinetics of resource acquisitions, and hence affecting competition between species. Moreover, light as another ‘nutrient' has also been subjected to a Tilman'esque resource competition treatment (e.g. Passarge et al., Reference Passarge, Hol, Escher and Huisman2006; Caputo et al., Reference Caputo, Naselli-Flores, Ordonez and Armengol2008) and light-P as a resource pair have been found not to follow standard resource-competition expectations (Passarge et al., Reference Passarge, Hol, Escher and Huisman2006), though given the role of P in cellular energetics (Flynn et al., Reference Flynn, Raven, Rees, Finkel, Quigg and Beardall2010) that is perhaps not unexpected. In GB, the irradiance during winter season ranged from 1.84 mw cm−2 to 4.66 mw cm−2 at the surface and is lower than optimum irradiance (Choi & Shim, Reference Choi and Shim1986b).
During GB's winter season, diatoms are more prominent than dinoflagellates. Turbulence can negatively influence dinoflagellates blooming by three mechanisms: physical damage; physiological impairment (aggregation); phototaxis; and diel vertical migration (Smayda, Reference Smayda1997). In contrast, diatoms are better adapted to intense mixing conditions as they have low respiration to photosynthesis ratios and high growth rates (Cushing, Reference Cushing1989). Given that there are dramatic alternations of diatom species composition, Thalassiosira nordenskioeldii, for example, is the only dominant species during winter blooms since 1998, while tychopelagica diatom (i.e. Paralia sulcata) was the most dominant species during 1981–1982 (Choi & Shim, Reference Choi and Shim1986c), suggesting that the factors causing recent change in the phytoplankton community structure in favour of T. nordenskioeldii were not exhibited in the past.
Mechanisms of phytoplankton summer blooms
GYEONGGI BAY
GB's summer blooms (group 4) support the phase I eutrophicaiton model (Cloern, Reference Cloern2001) emphasizing that changing nutrient input acts as a signal and response to that signal as increased phytoplankton biomass. In outside the SL region, blooms are detected after Shihwa Lake discharge (15 million tons day−1) since 1999 (Park & Park, Reference Park and Park2000). Summer dense blooms (chlorophyll >7 mg m−3) are usually dominant in the nutrient-rich upwelling/eddy north-west Pacific systems caused by the dinoflagellates and diatoms (Shanmugam et al., Reference Shanmugam, Ahn and Ram2008) and also in Chesapeake Bay (Breitburg, Reference Breitburg1990; Harding, Reference Harding1994), Tolo Harbour, Hong Kong (30 µg l−1: Xu et al., Reference Xu, Yin, Liu, Lee, Anderson, Ho and Harrison2010) and the Mississippi River Plume (Grimes & Finucane, Reference Grimes and Finucane1991).
GB's summer blooms appeared to be more dependent on physical processes rather than nutrients (Table 1), as indicated by higher correlation between chlorophyll-a and environmental parameters (i.e. r = 0.26 SST, r = −0.40 salinity, r = 0.71 DO and r = −0.27 SS). The huge discharge of the Han River not only delivers nutrients to the upper GB but also determines the hydrological properties of the water column, including high temperature, low salinity, vertical thermal stability, low turbidity as well as high light conditions. All of these properties triggered phytoplankton growth most likely by supplying proper temperature, increasing the light intensity and retaining the algal cells in the euphotic zone. Smayda (Reference Smayda2008) recently concluded that bloom potential in response to nitrification is mediated by the accompanying irradiance and flushing characteristics. During 1995–2004, GB's chlorophyll profiles experienced a significant increasing trend of about twofold which is consistent with the sharp increase in the global ocean trend (4.13%) during 1998–2003 (Gregg et al., Reference Gregg, Casey and McClain2005) and with the increase in dissolved inorganic nitrogen trend in GB during the past four decades (1981–2008) (Park & Park, Reference Park and Park2000; NFRDI, 2008)
Gyeonggi Bay's summer blooms were mostly dominated by the nano-size (<20 µm) phytoplankton. During 2000–2004, cryptomands (<5 µm) was the most dominant phytoplankton species associated with co-dominant diatoms, whereas the diatoms Skeletonema costatum and Chaetoceros spp. were the only dominant group in the past (1981–1982) (Choi & Shim, Reference Choi and Shim1986c). Progressive changes in these phytoplankton species composition has coincided with the tenfold increased N:P ratio from the Redfield ratio during 1986–2004. A 21-years series of measurements from the western Wadden Sea, for example, provides strong empirical evidence that human-induced changes in nutrient (N:P) ratios can cause changes in phytoplankton species composition (Philippart et al., Reference Philippart, Cadee, van Raaphorst and Riegman2000), and off the coast of Germany, a fourfold increase in the N:Si ratio coincided with decreased abundance of diatoms and an increase in Haptophyceae (Phaetocystis) blooms (Radach et al., Reference Radach, Berg and Hagmeier1990). A number of variables could contribute to changes in the phytoplankton community over time (Livingston, Reference Livingston2001). These include: (1) the exact timing of nutrient delivery; (2) which nutrient (or nutrients) was (were) being loaded at a given time; (3) interactions among the various nutrients; (4) bay habitat conditions relative to the interannual drought–flood sequence; and (5) the nutrient requirements of the species present at the time of the nutrient loading.
SHIHWA LAKE
The proposed underlying mechanism for summer blooms (group 4) in SL, is consistent with earlier studies (Choi et al., Reference Choi, Lee, Noh and Huh1997; Han & Park, Reference Han and Park1999; Kim et al., Reference Kim, Park, Lee and Kim2004) which concluded that huge fresh water inputs from the neighbouring municipal and industrial complexes through six major streams, are large enough to offset the effects of tidal and wind stirring. As a result the water column remains stratified at a depth range of 6–8 m, for a sufficiently long period that phytoplankton can grow and reach higher levels (167 µg chlorophyll-a l−1 in 1996) with frequent red-tides indicating a hypertrophic condition. In SL, extreme summer blooms supply organic matter to bottom water and sediment thereby generating oxygen consumption, and accordingly strong stratification limits oxygenation of bottom waters leading to hypoxia (Han & Park, Reference Han and Park1999). The hypoxia (anoxia) in the SL is analogous to that of the Black Sea (Sorokin, Reference Sorokin and Ketchum1983; Mee, Reference Mee1992; Tuncer et al., Reference Tuncer, Karakas, Balkas, Gokcay, Aygnn, Yurteri and Tuncel1998) and the Changjiang and Mississippi margins (Rabouille et al., Reference Rabouille, Conley, Dai, Cai, Chen, Lansard, Green, Yin, Harrison, Dagg and Mckee2008). Hypoxia is one of the significant reasons for the unstable benthic ecosystem in SL (Ryn et al., Reference Ryn, Choi, Kang, Koh and Huh1997).
Summer harmful algal blooms are frequently caused by dinoflagellates (Prorocentrum minimum), cryptomonads and Chrysophyceae, whereas diatoms (Cyclotella atomas, Nitzchia sp. and Chaetoceros sp.) are dominant in autumn and winter (Choi et al., Reference Choi, Lee, Noh and Huh1997). It is important to note that dinoflagellate blooms (i.e. Heterocapsa triquetra) are sometimes also found under ice in SL (HAN, 2011). It is well documented that the physiological flexibility of dinoflagellates in response to changing environmental parameters (e.g. light, temperature and salinity) as well as its ability to utilize both inorganic and organic nitrogen, phosphorus, and carbon nutrient sources suggest that increasing dinoflagellate blooms are a response to increasing eutrophication (Glibert et al., Reference Glibert, Anderson, Gentien, Graneli and Sellner2005; Heil et al., Reference Heil, Glibert and Fan2005). Note that dinoflagellate blooms did not develop before dike construction.
CONCLUSION
In the present study, the Self-Organizing Map model gave satisfactory results for the ordination and clustering of environmental parameters and phytoplankton biomass that revealed four distinct seasonal patterns (SOM 1, winter; SOM 2, spring and autumn; SOM 3, summer; and SOM 4, summer), belonging to different geographical regions of the Gyeonggi Bay and Shihwa Lake. The interpretation of the SOM algorithm enables easy visualization of the patterns in the same form as the large input datasets, something that is not possible with the standard output from cluster analysis or multidimensional scaling. In this study, efficiency of SOM mapping had been demonstrated in the last two clusters designated with the same summer season. The SOM 4 group restricted at Shihwa Lake and Upper Gyeonggi Bay is a more eutrophic state characterized by algal blooms, enhanced nutrients and temperature, and, conversely, the SOM 3 group located at broad lower Gyeonggi Bay regions is a non-eutrophic state and is also characterized by macrotidal activities through advection and diffusion processes responsible for this different response. Therefore, the strengths of our SOM model are the recognition of blooming regions (SOM 4: upper GB and SL) with appropriate ecological explanations (i.e. nutrient, stratification, low salinity and SS) and their linkage to provide a comprehensive view on the eutrophication process in the macrotidal Gyeonggi Bay. So, these results are easy to interpret and useful to environmental decision-makers for sustainable management of estuarine ecosystems. By using other biological and physical oceanographic factors, SOM can offer a better resolution of the complexity of relationships between variables in ecological processes. Finally, once the description of the existing environmental parameters and of their obvious relationship with the environmental pollution is done, the prediction of phytoplankton blooms is demonstrated to be necessary and therefore should be seriously considered.
ACKNOWLEDGEMENTS
This research was part of the project ‘Development of forecasting technology for seawater circulation and ecosystem change’ and it is funded by the Ministry of Land, Transport and Maritime Affairs, Korea.