INTRODUCTION
Desert springs and wetlands are highly fragmented, keystone ecosystems in arid environments that act as refugia for thousands of threatened, endangered, and endemic species (Murphy et al., Reference Murphy, Guzik, Cooper and Austin2015). These groundwater-fed ecosystems support flora and fauna living in a wide variety of hydrologic settings, including marshes and wet meadows, spring-fed pools, and spring-fed streams (Springer and Stevens, Reference Springer and Stevens2009). Sediments become trapped in spring environments by wet ground conditions and dense vegetation and accumulate over time, resulting in a unique combination of in-situ chemical precipitates, fine-grained detrital material, and organic matter that is preserved in the geologic record as groundwater discharge (GWD) deposits. GWD deposits occur in deserts worldwide and contain important information on the timing, magnitude, and potential causes of past changes in water-table levels (Pigati et al., Reference Pigati, Rech, Quade and Bright2014; Springer et al., Reference Springer, Manker and Pigati2015).
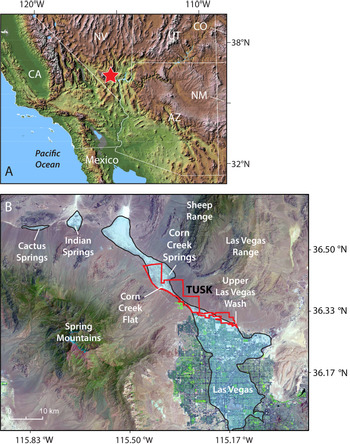
In the Las Vegas Valley of southern Nevada, an extensive network of springs and wetlands was supported by wet climate conditions and high groundwater levels during much of the middle to late Pleistocene and early Holocene (Quade, Reference Quade1986; Quade and Pratt, Reference Quade and Pratt1989; Springer et al., Reference Springer, Manker and Pigati2015, Reference Springer, Pigati, Manker and Mahan2018). The resulting light-colored, fine-grained GWD deposits covered most of the valley floor, but have largely been obscured by urbanization with the exception of Tule Springs Fossil Beds National Monument (TUSK), where they entomb one of the most significant late Pleistocene vertebrate faunas in the American Southwest, the Tule Springs local fauna (Scott and Springer, Reference Scott and Springer2016; Scott et al., Reference Scott, Springer and Sagebiel2017; Fig. 1).
(A) Location of the Las Vegas Valley in southern Nevada (red star), USA. (B) Landsat image from 2017 showing the geographic extent of paleowetland deposits attributed to the Las Vegas Formation (LVF) in light blue (after Longwell et al., Reference Longwell, Pampeyan, Bowyer and Roberts1965; Page et al., Reference Page, Lundstrom, Harris, Langenheim, Workman, Mahan and Paces2005). The last contiguous vestiges of the LVF are protected in Tule Springs Fossil Beds National Monument (TUSK; outlined in red) on the northern end of the Las Vegas metropolitan area. Additional deposits attributed to the LVF are located at Indian Springs and Cactus Springs to the northwest. Landsat image is courtesy of the U.S. Geological Survey's Earth Resources Observation and Science Center. (For interpretation of the references to color in this figure legend, the reader is referred to the web version of this article.)

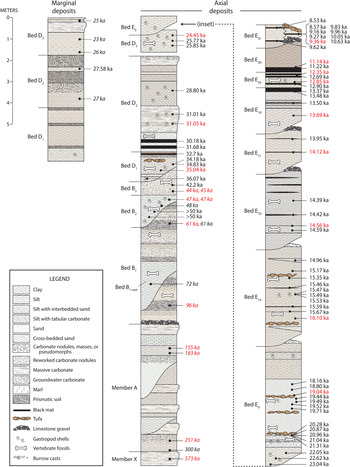
GWD deposits exposed in and around TUSK were designated as the Las Vegas Formation (LVF) by Longwell et al. (Reference Longwell, Pampeyan, Bowyer and Roberts1965), and subsequently subdivided into informal stratigraphic units by Haynes (Reference Haynes, Wormington and Ellis1967). Haynes’ stratigraphic and chronologic frameworks persisted in the literature for decades until they were redefined and augmented by Springer et al. (Reference Springer, Pigati, Manker and Mahan2018). The LVF now consists of 17 informal paleowetland units that collectively span more than 500,000 years (Fig. 2), and represent distinct episodes of groundwater discharge separated by periods of aridification as evidenced by soils and/or erosion. The deposits indicate that throughout the Quaternary, wetland development in the Las Vegas Valley was interrupted repeatedly by sustained megadroughts, as spring ecosystems expanded and contracted in temporal synchroneity with global climatic perturbations on millennial and submillennial timescales (Springer et al., Reference Springer, Manker and Pigati2015, Reference Springer, Pigati, Manker and Mahan2018). Although the work by Springer et al. (Reference Springer, Manker and Pigati2015, Reference Springer, Pigati, Manker and Mahan2018) established GWD deposits as a robust, high-resolution paleoclimate proxy, it is critical to further investigate the physical and chemical components of the LVF sediments in detail and determine the processes by which they accumulated in order to extract the full breadth of the paleoclimatic, paleohydrologic, and paleoecologic information they contain.
Composite stratigraphy and ages for sediments of the Las Vegas Formation based on stratigraphic sections located throughout the upper Las Vegas Wash (after Springer et al., Reference Springer, Pigati, Manker and Mahan2018). Calibrated radiocarbon ages (filled circles) are given in regular font and infrared-stimulated luminescence ages (filled squares) are italicized. Ages in red denote samples included in the current study. (For interpretation of the references to color in this figure legend, the reader is referred to the web version of this article.)

Some of the questions that remain to be answered regarding GWD deposits in the LVF relate to the quantity, composition, and source(s) of fine-grained detrital sediments that are present in the GWD deposits. Specifically, how are these sedimentary grains transported into spring ecosystems? Are they introduced by alluvial processes operating at the distal toes of fans or low-energy streams running through the valley bottom? Or, are they the result of aeolian transport from either local or extralocal sources? Do spring ecosystems capture sediment from multiple transport pathways, and, if so, what is the contribution from each? Finally, is the amount or chemical signature of sediment captured by springs and wetlands a function of either time or the specific hydrologic environment?
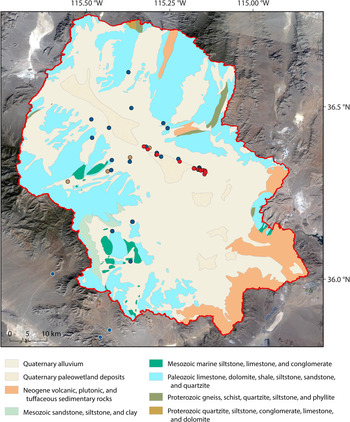
In the southwestern U.S., little quantitative evidence is available to assess the origin of detrital sediments in GWD deposits. Using visual identification, Quade (Reference Quade1986) showed that sand-sized grains of the LVF are dominated by carbonate minerals, which account for 50–80% of the total, but also include abundant non-carbonate minerals, such as quartz, feldspars, micas, and assorted mafic minerals. Because the mountains surrounding the Las Vegas Valley are composed almost entirely of Paleozoic carbonate rocks (Fig. 3), Quade (Reference Quade1986) hypothesized that at least some of the sediments must have been derived from outside the hydrographic basin and introduced by aeolian processes. Similarly, Pigati et al. (Reference Pigati, Miller, Bright, Mahan, Nekola and Paces2011) suggested that GWD deposits at Valley Wells, California, located ~100 km southwest of Las Vegas, likely contain aeolian sediments based on particle size distributions, but did not provide quantitative estimates of the potential contribution.
Geologic map showing that bedrock in the study area is composed predominantly of carbonate rocks (modified from Crafford, Reference Crafford2007). Sampling locations are shown by filled circles: Las Vegas Formation (red), alluvial sediments (blue), and modern dust traps (tan). Alluvial samples outside the Las Vegas Valley watershed are outlined in white. (For interpretation of the references to color in this figure legend, the reader is referred to the web version of this article.)

In this study, we quantify the aeolian component of the LVF sediments by analyzing particle size distributions, mineralogical and magnetic data, petrographic information, and major- and trace-element geochemical data, and comparing the results to data derived from alluvial sediments and modern dust in the Las Vegas Valley watershed. Our primary goal was to characterize the physical and chemical composition of the LVF sediments and quantify the contributions of various transport pathways represented in order to gain additional insight into the hydrology of the Las Vegas Valley. The results will also inform ongoing studies of GWD deposits at other sites in the southwestern U.S., enhance our understanding of the rapid response of spring ecosystems to past episodes of abrupt climate change (e.g., Springer et al., Reference Springer, Manker and Pigati2015, Reference Springer, Pigati, Manker and Mahan2018; Pigati et al., Reference Pigati, Springer and Honke2019; Springer and Pigati, Reference Springer and Pigati2020), and provide clarity for studies that use the stratigraphic and chronologic frameworks of the LVF for testing or calibration purposes (e.g., Gray et al., Reference Gray, Mahan, Springer and Pigati2018).
METHODS
Field methods
Bulk sediment samples were collected from 16 of the 17 units of the LVF, including members X, A, B, D, and E, and their attendant beds (Fig. 2), at multiple sites located throughout the upper Las Vegas Wash (Fig. 3; Table 1). The only unit not sampled was bed B1-wet. At each outcrop, ~0.5–1.0 kg of sediment was collected at least 1 m below the ground surface, directly adjacent to where chronologic samples were previously obtained, and the specific hydrologic setting (e.g., marshes, spring pools, spring-fed streams) represented by each sampled horizon was noted. This allowed us to place all of the physical and chemical data from this study into robust stratigraphic, chronologic, and hydrologic frameworks as established by Springer et al. (Reference Springer, Pigati, Manker and Mahan2018). Bulk sediment samples (~0.5–1.0 kg) were also collected from active alluvial channels at 21 sites within the Las Vegas Valley watershed and three sites located just outside the watershed to establish parameters for alluvium derived from the local bedrock (Fig. 3; Table 2).
Summary of sample information for Las Vegas Formation sediments. UTM coordinates are all in zone 11S. Ages are given in thousands of years before present with uncertainties at the 2σ (95%) confidence level, from Springer et al. (Reference Springer, Manker and Pigati2015, Reference Springer, Pigati, Manker and Mahan2018).

Summary of sample information for the alluvial sediments.

1 UTM coordinates are all in zone 11S.
2 Located just outside the Las Vegas Valley watershed.
Laboratory methods
Particle size
Particle-size distributions were determined on the LVF and alluvial sediments by laser diffraction using a Malvern Mastersizer 2000 particle-size analyzer. Prior to analysis, the samples were sieved to ≤2 mm (the >2 mm fraction of the LVF was not used for this study) and treated with 30% hydrogen peroxide (H2O2) to remove organic matter. They were then treated with 1.2N hydrochloric acid (HCl) to remove carbonate precipitants (this treatment lasted for just a few minutes, until rapid effervescing ceased, leaving detrital carbonate grains largely undisturbed), and sodium hexametaphosphate (Na6P6O18) to prevent clay flocculation and enhance dispersion, and measured for particle size. Results are reported as volume percentages of sand (2000–63 μm), silt (63–3.9 μm), and clay (3.9–0.1 μm).
Mineralogy
Mineralogical determinations were made on the LVF and alluvial sediments using X-ray diffraction (XRD). Prior to analysis, the LVF sediments were sieved to ≤2 mm, and the alluvial sediments were sieved and separated into two aliquots (>2 mm alluvium and ≤2 mm alluvium) that were retained for analysis. The samples were then ground to a fine powder, placed into cavity mounts, and scanned from 4° to 60° 2θ. Data were collected using copper Kα radiation in a Philips XRG 3100 and a Norelco goniometer equipped with a graphite monochrometer. Phase identification was done using JADE software by Materials Data, Inc., and semi-quantitative mineral abundances in volume percent were determined by peak intensities using peak positions after Moore and Reynolds (Reference Moore and Reynolds1989) as follows: mica, 8.8° 2θ; amphibole, 10.5° 2θ; gypsum, 11.7° 2θ; quartz, 20.8° 2θ; potassium feldspar (K-feldspar), 27.5° 2θ; plagioclase, 27.9° 2θ; and calcite, 29.4° 2θ.
Magnetic susceptibility
Magnetic susceptibility (MS), a measure of the amount of magnetic minerals (especially magnetite, Fe3O4), was determined on the LVF and alluvial sediments using a Bartington Instruments MS2B dual-frequency sensor and a MS3 magnetic susceptibility meter with a resolution of 1 x 10⁻⁶ SI. Prior to analysis, the LVF sediments were sieved to ≤2 mm (the >2 mm fraction was discarded), and the alluvial sediments were sieved and separated into two aliquots (>2 mm alluvium and ≤2 mm alluvium) that were retained for analysis. To remove carbonates, all samples were treated with 1.2N HCl for hours to days, depending on the size and carbonate percent of the sediments (Supplemental Figure 1).
After sieving and chemical pretreatment, the LVF sediments and the ≤2 mm alluvium samples were placed in 3.2 cm3 plastic paleomagnetism boxes and the MS was measured at a frequency of 465 Hz. The >2 mm alluvium samples were placed in 10 cm3 plastic specimen jars and the MS was measured in the same manner. For all samples, the reported MS values were calculated as the mean of four measurements after accounting for the diamagnetism of the paleomagnetism boxes and specimen jars.
Petrography
Petrographic observations of the LVF sediments were made on polished grain mounts of magnetic mineral separates and thin sections. Magnetic minerals were separated from the bulk sediment using a strong magnet in a plastic bag and placing it in contact with the bulk sediment. This process was repeated several times for each sample until we obtained a sufficient amount of magnetic material to make a polished grain mount. For the thin sections, the LVF sediments were first sieved to ≤2 mm (the >2 mm fraction was discarded) then treated with 1.2N HCl until rapid effervescing ceased (typically ~4 minutes). This process removed most of the secondary carbonate while minimizing dissolution of primary limestone or dolomite grains, which are generally denser than secondary carbonates. The treated samples were then impregnated with blue epoxy to make thin sections. Polished grain mounts were observed under reflected light using immersion oil, and the thin sections were observed under transmitted light.
Major and trace element geochemistry
Major and trace element geochemical analyses were performed on the LVF and alluvial sediments using wavelength dispersive X-ray fluorescence spectrometry (WDXRFS), inductively coupled plasma-optical emission spectrometry (ICP-OES), and inductively coupled plasma-mass spectrometry (ICP-MS) analyses through a USGS contract with AGAT Laboratories. Details of the sample preparation and analytical procedures can be found at https://www.agatlabs.com/cms/files/projects/1/documents/Service%20Manual_Mining_2018.pdf (last accessed March 2021)
Prior to analysis, the LVF sediments were sieved to ≤2 mm (the >2 mm fraction was discarded), and the alluvial sediments were sieved and separated into two aliquots (>2 mm alluvium and ≤2 mm alluvium) that were retained for analysis. All samples were treated with 1.2N HCl to remove carbonates. Major element determinations were made by WDXRFS after samples were fused with lithium metaborate/lithium tetraborate and irradiated by X-rays. Trace-element concentrations were determined by ICP-OES and ICP-MS after fusing the samples at 750°C with sodium peroxide and dissolving them in dilute nitric acid. The resulting data from the LVF sediments were compared to both size fractions of the alluvial sediments as well as to geochemical data from modern dust from the area (Table 3; Reheis et al., Reference Reheis, Budahn and Lamothe2002), although we note that the dust data were derived from the silt+clay component based on the USDA particle-size scale (<50 μm) rather than the Wentworth scale (<63 μm) employed here.
Summary of sample information for modern dust. UTM coordinates are all in zone 11S. Samples T-18 and T-18A are co-located. Data collected for particle size analysis and carbonate content in 1984–1999 are from Reheis, Reference Reheis2003. Data collected in 2005–2011 are presented in Supplementary Table 1. Data collected for geochemistry are from Reheis et al., Reference Reheis, Budahn and Lamothe2002.

RESULTS
Particle size
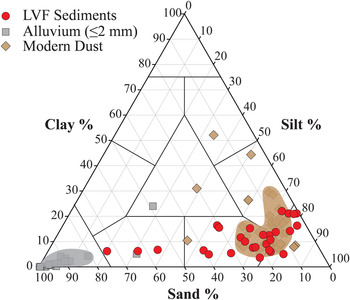
Results of the particle-size analysis (PSA) show that the LVF sediments consist predominantly of silt-sized grains with a median diameter of ~35 μm, with silt contents ranging between ~50% and 80%, and lesser amounts of sand (<25%) and clay (<20%) (Fig. 4; Supplemental Table 1). The majority of the LVF sediments classify as silt to sandy silt (Shepard, Reference Shepard1954), although we did find that samples from beds D3, E2a, and E1d were slightly coarser (55–75% sand) and classify as silty sand. We did not observe any trends in the PSA data of the LVF sediments with either unit age or hydrologic setting (Supplemental Figure 2). Overall, the particle-size distributions of the LVF sediments are similar to modern dust in the area, which is variously classified as sandy silt, silt, and clayey silt (Reheis, Reference Reheis2003), but are considerably finer than alluvial sediments derived from the local bedrock, which are composed of at least 80% sand-sized particles and are classified as sand (Fig. 4).
Sand-silt-clay contents of the Las Vegas Formation (LVF) sediments (red circles), ≤2 mm alluvium (gray squares) and modern dust (tan diamonds) (after Reheis, Reference Reheis2003; see Table 3 for dust trap information). Domains for ≤2 mm alluvium (gray polygon) and modern dust (tan polygon) include data that falls between the tenth and ninetieth percentiles of the silt content. The results show that particle size distributions of the LVF sediments are similar to modern dust but are significantly different than the alluvial sediment. (For interpretation of the references to color in this figure legend, the reader is referred to the web version of this article.)

Mineralogy
The mineralogy of the LVF sediments is dominated by carbonates (calcite+dolomite), which account for 77 ± 3% of the total (uncertainties are given as the standard error of the mean at the 68% (1σ) confidence level), whereas non-carbonate minerals account for an average of 23 ± 3% of the total (Fig. 5; Supplemental Table 2). Of the non-carbonate minerals, quartz, K-feldspar, and plagioclase account for 99 ± 1% of the sand fraction and 94 ± 1% of the silt+clay fraction, with mica, amphibole, and gypsum accounting for the remaining few percent (Supplemental Table 2). The LVF sediments also contain trace amounts of clay minerals that include smectite, illite, mixed layer illite-smectite, chlorite, and kaolinite. We did not find any trends in the mineralogy of the LVF sediments with either unit age or hydrologic setting (Supplemental Figure 3).
Box-and-whisker plot showing semiquantitative mineral abundances (in volume percent) of (A) carbonate minerals and (B) non-carbonate minerals of the Las Vegas Formation (LVF) and alluvial sediments based on X-ray diffraction. Boxes represent the likely range of variation (known as the interquartile range, or IQR), which is defined by the first quartile (twenty-fifth percentile; lower limit) and third quartile (seventy-fifth percentile; upper limit). Median values are shown by horizontal lines within each colored box, whereas the full range of values are depicted by the whiskers that mark the tenth and ninetieth percentiles. Data that falls outside these bounds are considered to be outliers and are shown as filled circles. The results show that the LVF sediments contain more non-carbonate minerals than the >2 mm alluvium and ≤2 mm alluvium.

In contrast to the LVF sediments, the >2 mm alluvium exhibits exceptionally high carbonate concentrations (calcite+dolomite; 96 ± 1%) and only minor amounts of non-carbonate minerals (quartz+K-feldspar+plagioclase; 4 ± 1%), whereas the ≤2 mm alluvium also contains high concentrations of carbonate minerals (89 ± 1%), but slightly more non-carbonate minerals (11 ± 1%) (Fig. 5; Supplemental Table 2).
Magnetic Properties and Petrographic Information
Magnetic susceptibility (MS) values of the LVF sediments (3.27 × 10⁻⁸ m3kg-1–3.79 × 10⁻⁷ m3kg-1) are similar to the ≤2 mm alluvium (3.37 × 10⁻⁸ m3kg-1–5.07 × 10⁻⁷ m3kg-1), but are significantly higher than the >2 mm alluvium (2.73 × 10⁻¹⁰ m3kg-1–3.07 × 10⁻⁸ m3kg-1; Fig. 6; Supplemental Table 3). We did not find any trends in the MS values of the LVF sediments with either unit age or hydrologic setting (Supplemental Figure 4).
Box-and-whisker plot showing the low-frequency magnetic susceptibility (MS) values for the Las Vegas Formation (LVF) and alluvial sediments (see Figure 5 caption for parameter definitions). The results show that the MS values of the LVF sediments are significantly higher than the >2 mm alluvium, but are statistically indistinguishable from the ≤2 mm alluvium.

Petrographic observations reveal that magnetic minerals in LVF sediments consist mainly of silt-sized grains of magnetite, titanomagnetite, and ilmenohematite (Supplemental Figure 5). These minerals are formed at high temperatures in igneous rocks (Haggerty, Reference Haggerty and Rumble1976), outcrops of which are rare in the surrounding mountains (Fig. 3), indicating that they originated outside the Las Vegas Valley watershed.
Major and trace element geochemistry
Rubidium (Rb) and barium (Ba) substitute for potassium (K) in K-feldspar, and their ratios provide a means for comparing the LVF sediments, alluvial sediments, and modern dust (Reheis et al., Reference Reheis, Budahn and Lamothe2002). K/Ba and K/Rb ratios of the LVF sediments have relatively narrow ranges (19–63 and 204–282, respectively) and are similar to modern dust (30–50 and 164–222, respectively) and the ≤2 mm alluvium (10–58 and 185–360, respectively), but are significantly different than the >2 mm alluvium (32–170 and 296–623, respectively; Fig. 7; Supplemental Table 4). Concentrations of silica (8–24%), aluminum+iron (2–7%), and calcium+magnesium (14–31%) in the LVF sediments also closely correspond with the ≤2 mm alluvium data (8–28%, 1–12%, 6–29%, respectively) but are different than the >2 mm alluvium (2–14%, 0.2–1.5%, 26–35%, respectively; Fig. 8; Supplemental Table 4). Finally, iron and titanium contents reflect the presence of magnetic minerals and are also present in the LVF sediments (0.4–1.9% and 0.1–0.2%, respectively) in concentrations that are similar to the ≤2 mm alluvium (0.4–4.3% and 0.02–0.35%, respectively), and intermediate between the >2 mm alluvium (0.08–0.78% and 0.01–0.10%, respectively) and modern dust (2.5–4.2% and 0.17–0.28%, respectively; Fig. 9; Supplemental Table 4). We did not find any trends in the major and trace element geochemistry data of the LVF sediments with either unit age or hydrologic setting (Supplemental Figures 6–12).
K/Ba versus K/Rb ratios for the Las Vegas Formation (LVF) sediments, alluvial sediments, and modern dust (Reheis et al., Reference Reheis, Budahn and Lamothe2002). Domains for ≤2 mm alluvium (gray polygon) and >2 mm alluvium (blue polygon) include data that falls between the tenth and ninetieth percentiles of the K/Ba data. The domain for modern dust (tan polygon) includes all data points. The results show that these chemical ratios in the LVF sediments are similar to both modern dust and the ≤2 mm alluvium, but are significantly lower than the >2 mm alluvium. (For interpretation of the references to color in this figure legend, the reader is referred to the web version of this article.)

Ternary diagram of major elements for the Las Vegas Formation (LVF) and alluvial sediments. Domains for ≤2 mm alluvium (gray polygon) and >2 mm alluvium (blue polygon) include data that falls between the tenth and ninetieth percentiles of the Ca+Mg and Si data. The results show that the chemical signature of the LVF sediments is similar to the ≤2 mm alluvium, but is different than the >2 mm alluvium. (For interpretation of the references to color in this figure legend, the reader is referred to the web version of this article.)

Titanium and iron concentrations of the Las Vegas Formation (LVF), alluvial sediments, and modern dust (Reheis et al., Reference Reheis, Budahn and Lamothe2002). Domains for ≤2 mm alluvium (gray polygon) and >2 mm alluvium (blue polygon) include data that falls between the tenth and ninetieth percentiles of the Ti values. The domain for modern dust (tan polygon) includes all data points. The results show that the chemical composition of the LVF sediments is similar to the ≤2 mm alluvium, and intermediate between the >2 mm alluvium and modern dust. (For interpretation of the references to color in this figure legend, the reader is referred to the web version of this article.)

DISCUSSION
Physical and chemical properties of LVF sediments and modern alluvium
The large grain size of the >2 mm alluvium precludes aeolian transport, so these sediments must have been derived entirely from local sources and transported to the valley floor by non-aeolian processes. This is supported by the mineralogical data, which show that carbonates account for 96 ± 1% of the >2 mm alluvium, similar to the composition of the predominantly carbonate bedrock that surrounds the Las Vegas Valley (Fig. 3). In contrast, whereas the majority (77 ± 3%) of the LVF sediments are composed of carbonate minerals, the LVF also contains a large amount (23 ± 3%) of non-carbonate minerals that are relatively rare in the Las Vegas Valley watershed, including quartz, plagioclase, K-feldspar, mica, amphibole, gypsum, and small amounts of magnetic and clay minerals. At least some of the LVF sediments, therefore, must have originated outside the valley and were introduced to the spring ecosystems by aeolian processes. This hypothesis is supported by the median grain size of the LVF sediments (~35 μm), which is consistent with modern dust in the region (Reheis, Reference Reheis2003).
Mineralogical data show a marked difference in the quartz+K-feldspar+plagioclase concentrations between the >2 mm alluvium and the LVF sediments, with compositions of the ≤2 mm alluvium falling between these two endmembers (Fig. 5). Similar patterns are present in the magnetic susceptibility data, major element geochemical data, and trace-element geochemical data, as they all exhibit pronounced differences between the LVF sediments and >2 mm alluvium, with the ≤2 mm alluvium consistently yielding intermediate values (Figs. 6–9). These data indicate that the ≤2 mm alluvium likely contains sediments derived from the local bedrock as well as aeolian sediments that originated outside the Las Vegas Valley watershed. Collectively, our data and source interpretations of the LVF sediments and modern alluvium explain the presence of abundant non-carbonate minerals in the LVF sediments and the similarity in magnetic and geochemical data between the LVF sediments and the ≤2 mm alluvium, as well as the differences in the same data between these two fractions and the >2 mm alluvium.
Quantitative estimate of aeolian input to the LVF sediments
The amount of material in the LVF sediments introduced by aeolian processes may be quantified using calculations of the relative contribution of each potential transport pathway (aeolian or non-aeolian) for both carbonate and non-carbonate minerals (i.e., aeolian carbonates, aeolian non-carbonates, non-aeolian carbonates, non-aeolian non-carbonates). The mineralogical data confirm that the LVF sediments consist of an average of 77 ± 3% carbonates and 23 ± 3% non-carbonates, and therefore the following equations can be derived with their solutions shown in Supplemental Figure 13:


The mineralogy of the >2 mm alluvium, which is entirely non-aeolian, is composed of 96 ± 1% carbonate minerals and 4 ± 1% non-carbonate minerals, which is a ratio of ~19:1. That relationship is expressed in the next equation:

Finally, previous work has shown that modern dust in the Las Vegas Valley is composed of ~75% non-carbonate minerals and 25% carbonate minerals, or a ratio of 3:1 (Supplemental Table 5; Reheis, Reference Reheis2003). If we assume the same percentages of carbonate and non-carbonate minerals were present in dust during the middle–late Pleistocene and early Holocene, then the next equation follows:

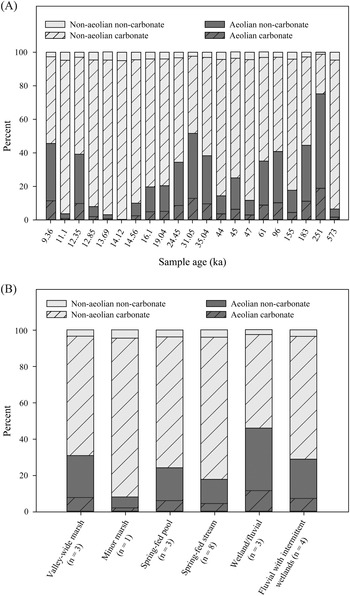
Solving all four equations simultaneously over the entire range of values permitted by the uncertainties in the geochemical data reveals that the LVF sediments are composed of an average of 6 ± 1% aeolian carbonates, 19 ± 3% aeolian non-carbonates, 71 ± 4% non-aeolian carbonates, and 3.7 ± 0.2% non-aeolian non-carbonates (Fig. 10; Supplemental Figure 13). By combining the two aeolian components (aeolian carbonates and aeolian non-carbonates), we establish that ~25% of the LVF sediments were introduced by aeolian transport.
Percentages of aeolian carbonates (dark hachured fill), aeolian non-carbonates (dark solid fill), non-aeolian carbonates (light hachured fill), and non-aeolian non-carbonates (light solid fill) compared to the (A) age and (B) hydrologic setting of the sampled units (after Springer et al., Reference Springer, Pigati, Manker and Mahan2018; also see Table 1). These results show than an average of ~25% of the LVF deposits were introduced by aeolian processes.

As it does today, some of the dust that originated outside the Las Vegas Valley watershed during the middle to late Quaternary would have settled on the landscape in Av horizons on alluvial fans positioned above the valley floor. Indeed, petrographic and geochemical data from soil horizons in the nearby Kyle Canyon alluvial fan have shown that the Av and uppermost B horizons are principally derived from dust (Reheis et al., Reference Reheis, Sowers, Taylor, McFadden and Harden1992). During the Quaternary, such dust could have been remobilized and transported to the valley floor via aeolian redistribution after some amount of time on the surrounding alluvial fans. This source of dust, along with dust that was deposited directly into the spring ecosystems in the valley, is included in these calculated estimates.
Sources and depositional mechanisms of the LVF aeolian and non-aeolian sediments
If an average of ~25% of the LVF sediments is aeolian, where did these sedimentary particles originate and how far could they have traveled before entering the Las Vegas Valley watershed? Climate models indicate that during the Quaternary, the prevailing wind direction in this part of the Mojave Desert was from the west/southwest (e.g., Lora et al., Reference Lora, Mitchell and Tripati2016). In addition, the median diameter of the LVF sediments is ~35 μm, which allows us to place constraints on the maximum distance transported by wind. Assuming a wind velocity of 15 m/s, light storms (low loft) could transport grains of this size up to ~10 km, moderate storms (moderate loft) up to ~100 km, large storms up to hundreds of kilometers, and extreme storms up to thousands of kilometers (but not more than 10,000 km; Tsoar and Pye, Reference Tsoar and Pye1987). Given that our sampling sites are, at most, 50–60 km from the watershed boundary in any direction, these data suggest that the dust likely originated in the Mojave Desert, which extends for 250–300 km to the west and southwest of the Las Vegas Valley. Although we cannot isolate specific source areas, they likely include numerous pluvial lake basins, alluvial fans, dune fields, and valley-bottom stream channels.
More than 70% of the LVF sediments consist of non-aeolian carbonates, which include three components: carbonate precipitated from groundwater, carbonate grains that were transported and deposited by alluvial processes, and soil carbonate. During wetter times in the Quaternary, carbonate-rich marls formed in the Las Vegas Valley where groundwater emerged at the surface and CO2 degassed into the atmosphere. The formation of marl was especially prevalent during full glacial times, as represented by member D of the LVF, when marshes and wet meadows filled the valley before abrupt warming intensified evaporative effects and depressed the water table, leading to desiccation of the wetlands and case-hardening of the marls (Springer et al., Reference Springer, Manker and Pigati2015, Reference Springer, Pigati, Manker and Mahan2018). We refer to this type of carbonate as authigenic groundwater carbonate.
In addition to this in situ formation of carbonate, some of the non-aeolian carbonate component of the LVF sediments could have been derived from sediments carried down from the surrounding mountains and deposited by alluvial processes. During dry times, alluvial sediments could have easily reached the valley axis as they do today. However, during the wetter full-glacial times, marshes and wet meadows that filled the valley would have acted as barriers to overland flow and made it difficult, if not impossible, for alluvial material to be transported all the way to the valley axis. The presence of standing water and thick vegetation would have slowed surface water flow such that the alluvial sediments would have been deposited along the edges of the wetlands and excluded from the valley bottom. In fact, this is exactly what we have observed in the field; alluvial deposits are largely absent from LVF deposits exposed in the middle of the valley, but are abundant near the valley margins where alluvial fan material and LVF sediments interfinger (e.g., section E1-6 in figure 16 of Springer et al., Reference Springer, Pigati, Manker and Mahan2018). Similar conditions existed in the other spring hydrologic environments represented by the LVF sediments (e.g., spring-fed outflow streams and spring pools), again minimizing the input of alluvial material in the resulting GWD deposits.
Petrographic techniques can be used to discriminate between authigenic groundwater carbonates and detrital carbonates in the LVF sediments, although the relative proportions of each were not quantified here. A few minutes of treatment with dilute HCl revealed that authigenic groundwater carbonates are less dense than detrital carbonates based on the etching that occurred both at the margins and the center of the grains (Supplemental Figure 14a). The groundwater carbonates are often irregularly shaped and are up to 450 μm in diameter as compared to the subangular to subrounded, detrital sparry grains with diameters up to 150–250 μm that generally resist etching during these acid treatments (Supplemental Figures 14b,c).
The final component contributing to the non-aeolian carbonate fraction of the LVF sediments is soil carbonate. Geologic deposits in the deserts of the southwestern U.S. are continually subjected to the addition of secondary carbonate through soil formation processes (Machette, Reference Machette and Weide1985). The amount of carbonate added by these processes is a function of time, and in geologically young deposits, the contribution is minimal for depths > ~1 m (Birkeland, Reference Birkeland1999). We were careful to stay below this depth at all of the outcrops chosen for sampling.
In sum, based on the paleohydrologic conditions in the spring ecosystems that covered the Las Vegas Valley during the middle–late Pleistocene and early Holocene, our extensive field observations, and petrographic information, we conclude that the non-aeolian carbonate component of the LVF consists mostly of authigenic groundwater carbonate with minor contributions of alluvial sediments and soil carbonate.
Implications for GWD and other Quaternary studies
Springs and desert wetlands are dynamic ecosystems, and studies of the LVF deposits have shown that wetland expansion and contraction occurred in direct response to abrupt climate oscillations during the late Quaternary (Springer et al., Reference Springer, Manker and Pigati2015, Reference Springer, Pigati, Manker and Mahan2018). The hydrologic settings represented by the LVF sediments sampled in this study are varied, and include valley-wide marshes, minor marshes and spring-fed pools, spring-fed streams, and fluvial settings with intermittent wetland development. Despite differences in the characteristics of these environments and the long age span of the Las Vegas Formation (>500,000 years), we did not find any significant correlations between the physical and chemical parameters of the sediments and either the age of the sampled units or the hydrologic settings (Supplemental Figures 2–4, 6–12). This lack of connectivity demonstrates that when groundwater appears on the landscape, the combination of wet ground and dense vegetation is extremely effective at capturing aeolian sediments regardless of the magnitude of discharge or the spatial scale of the spring ecosystem.
Geologic deposits associated with springs and wetlands can be used to reconstruct the timing and magnitude of past hydrologic and climatic changes on a variety of spatial and temporal scales. They are ubiquitous features in arid environments worldwide, including many places where lakes, speleothems, and other sources of paleohydrologic information are absent. Their distribution, combined with the sensitivity of wetland ecosystems to climate change and our ability to date the resulting deposits accurately using radiocarbon and luminescence techniques, makes GWD deposits an important archive of past environmental conditions. However, the results of this study show that because sediments are introduced to wetland ecosystems through multiple transport pathways, researchers should use caution when performing certain quantitative exercises related to GWD deposits, such as calculating dust fluxes or interpreting carbonate isotopic values (e.g., Pigati et al., Reference Pigati, Bright, Shanahan and Mahan2009), unless the contributions of the different pathways can be adequately characterized.
Finally, the data presented here allow us to address other specific questions regarding sediment inputs into the Las Vegas Valley wetlands from the surrounding watershed through time. For example, if the Spring Mountains were glaciated as suggested by Orndorff et al. (Reference Orndorff, Van Hoesen and Saines2003) but later challenged by Osborn et al. (Reference Osborn, Lachniet, Saines, Duebendorfer and Smith2008), did this putative glacial runoff affect the physical or chemical signatures of the LVF sediments that were accumulating in the valley bottom? If so, the effect should be manifested as an increase in both the total aeolian component and the carbonate content of the LVF sediments that date to the last glacial period, when input from glacial erosion and subsequent transport from the Spring Mountains would have been the highest. Although the LVF sediments exhibit an increase in the amount of aeolian material during this time (Fig. 10), the geochemical data of samples taken from beds D1, D2, and D3, which collectively date to between 35.04 ka and 24.45 ka and represent glacial conditions, do not show any evidence of an increase in the amount of carbonate minerals (calcite+dolomite) compared to samples that are either older or younger (Supplemental Figure 3). This indicates that either glaciers were not present in the Spring Mountains during the last glacial period or, if they were, they were not large enough to have a discernible impact on the sediments deposited on the adjacent valley floor.
CONCLUSION
The Las Vegas Formation (LVF) is the most complete record of GWD deposits in the southwestern U.S. and represents episodes of spring discharge separated by periods of aridification that are closely tied to climatic fluctuations over the past 500,000 years. As such, the LVF provides benchmark stratigraphic, chronologic, and hydrologic frameworks that can be used to evaluate competing climatic hypotheses, and to test new chronologic, isotopic, and geochemical techniques, making it a linchpin sequence for comparison against other regional paleohydrologic records. The current study improves our understanding of the LVF and paleowetland systems in general, particularly with respect to the deposition of aeolian sediment in desert wetlands, by testing the supposition that GWD deposits contain an aeolian component. Our results show that an average of ~25% of the deposits were derived from aeolian processes. Notably, we also found that the majority of the LVF sediments consist of authigenic groundwater carbonate with minor amounts of alluvial material and soil carbonate.
Finally, we demonstrated that paleowetland sediments in the Las Vegas Valley, and by extension at other paleowetland sites, are likely the result of multiple transport pathways originating from both local and extralocal sources. These results have important implications for interpreting past environmental conditions, particularly considering that the relative contribution of aeolian and non-aeolian transport pathways varies over time. These findings illustrate that continued development of GWD deposits as a high-resolution paleoclimatic and paleohydrologic proxy requires detailed knowledge of the physical and chemical processes operating within individual wetland ecosystems.
Supplementary Material
The supplementary material for this article can be found at https://doi.org/10.1017/qua.2021.14
Acknowledgments
We thank the National Park Service staff of Tule Springs Fossil Beds National Monument for facilitating our work under permit TUSK-2015-2019 SCI-001 (K.B. Springer, Principal Investigator). We thank Rich Reynolds, Jay Quade, an anonymous reviewer, and Janet Slate for providing constructive reviews of this manuscript. We also thank Rich Reynolds for assistance with interpreting the petrographic and magnetic susceptibility data, Jeremy Havens for graphical assistance, and Paco van Sistine for assistance with the figures. Any use of trade, product, or firm names is for descriptive purposes only and does not imply endorsement by the U.S. Government. Downloadable files of the data cited as Supplemental Information can be found at https://doi.org/10.5066/P96578BP.
Financial Support
This project was funded in part by the U.S. Geological Survey's Climate and Land Use Change Research and Development Program through the Quaternary Hydroclimate Records of Spring Ecosystems project.