Introduction
Cassava (Manihot esculenta Crantz) has the highest production of any crop in Mozambique (FAOSTAT, 2014) with the largest annual per capita consumption of approximately 85 kg (IOF, 2008/2009). Despite its importance, cassava production in Mozambique is seriously affected by two major viral diseases; cassava mosaic disease (CMD) and cassava brown streak disease (CBSD) with the latter regarded as the most devastating (IIAM, 2006).
As a short-term strategy to manage CBSD, identification and distribution of tolerant genotypes is effective (Legg and Hillocks, Reference Legg and Hillocks2002). Nevertheless, breeding more resistant cultivars as a long-term strategy is key. During the breeding process, it is important that farmer and consumer preferences are taken into consideration for easy adoption. In fact, it is normal for farmers to abandon new disease-tolerant varieties if they do not exhibit preferred traits (Owusu and Donkor, Reference Owusu and Donkor2012). This means that for the new tolerant varieties to be adopted, they should possess farmer and consumer-preferred attributes. This can be achieved by crossing consumer-preferred varieties with disease resistant genotypes. Once disease resistance has been introgressed, preferred traits can be recovered through back-crossing, although this may have to be limited to one or two generations as cassava suffers from inbreeding depression. However, due to the long generation time of cassava, releasing a new variety using conventional methods alone usually takes 10 years or more (Zacarias, Reference Zacarias2008). A technique that reduces this time to at least 6 years could have a tremendous impact. One such approach is called marker-assisted selection (MAS), which allows selection of the main target traits at the seedling stage thereby reducing the size of populations for evaluation (Ferguson et al., Reference Ferguson, Hearne, Close, Wanamaker, Moskal, Town, de Young, Marri, Rabbi and de Villiers2012a). One such example of this would be selection for CMD and CBSD at the seedling stage using MAS, followed by evaluation for other traits including cooking and eating quality under field conditions.
To implement MAS, a marker, or markers must be associated with a quantitative trait locus (QTL). Molecular markers associated with CMD resistance at the CMD2 locus are available (Wolfe et al., Reference Wolfe, Rabbi, Egesi, Hamblin, Kawuki, Kulakow, Lozano, Del Carpio, Ramu and Jannink2016), and for CBSD root necrosis and foliar symptoms in the Tanzanian variety Namikonga (Masumba et al., Reference Masumba, Kapinga, Mkamilo, Kasele, Kulembeka, Rounsley, Bredeson, Lyons, Rokhsar, Kanju, Katari, Myburg, van der Merwe and Ferguson2017) and Kiroba (Nzuki et al., Reference Nzuki, Katari, Bredeson, Masumba, Kapinga, Salum, Mkamilo, Shah, Lyons, Rokhsar, Rounsley, Myburg and Ferguson2017). Additional QTL studies involving two CBSD tolerant Tanzanian parents (NDL06/132 and Nachinyaya) and a CIAT line (AR40-6) are nearing completion at the International Institute of Tropical Agriculture (IITA) (Ferguson, pers. commun.), with Tanzanian variety, Albert as one of the susceptible parents. Since Tanzania and Mozambique are neighbouring countries, and there is a tradition of germplasm exchange among farmers, even across international boundaries (Pariyo et al., Reference Pariyo, Tukamuhabwa, Baguma, Kawuki, Alicai, Gibson, Kanju, Wanjala, Harvey, Nzuki, Rabbi and Ferguson2013) then there is a possibility that Mozambican and Tanzanian landraces are similar. If CBSD tolerant Mozambique varieties can be identified that are closely related to the CBSD tolerant Tanzanian varieties, then it is likely that the same QTL will be shared by the Mozambique varieties and MAS could be applied to accelerate breeding. The main objective of the study was to determine the genetic relationship between farmer-preferred varieties of Mozambique with Tanzanian genotypes whose resistance to CBSD is known and which are being used as parents in QTL studies.
Materials and methods
Sample size
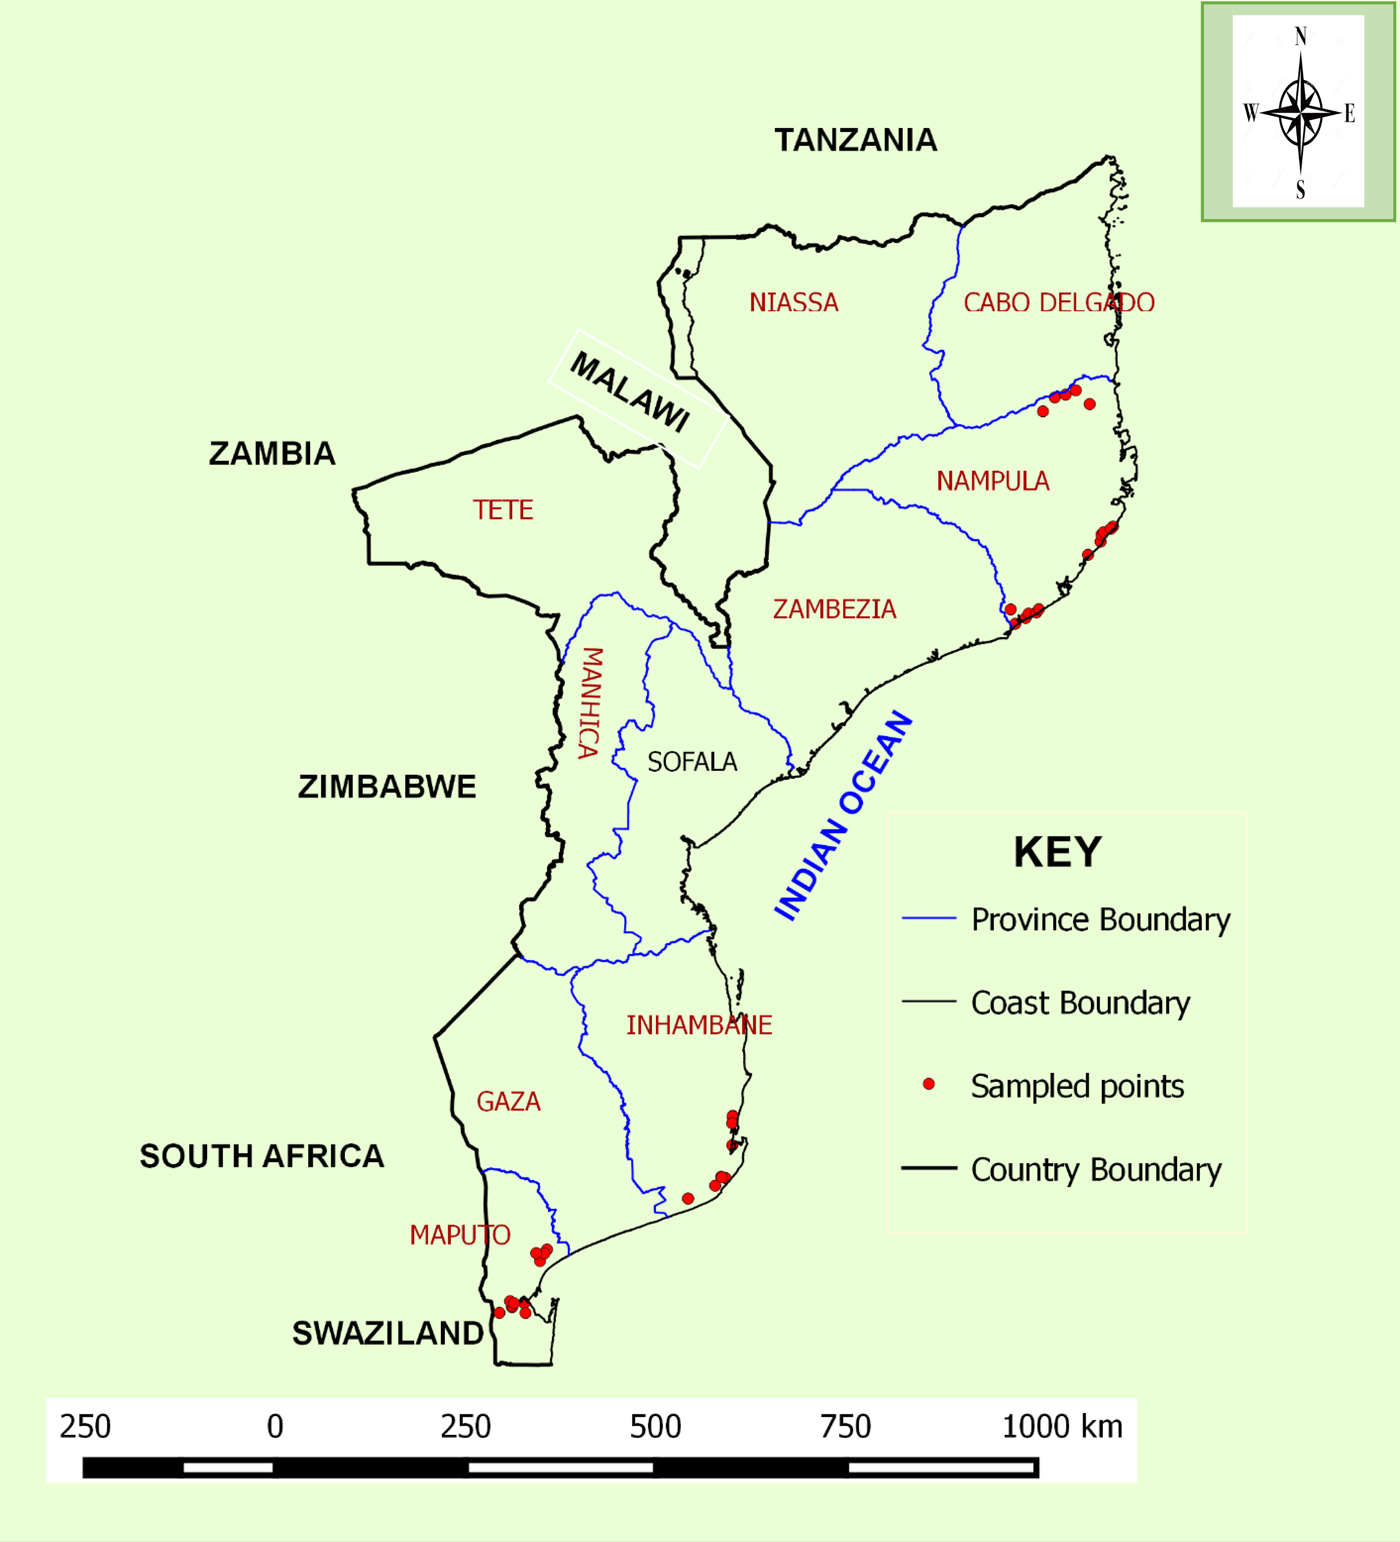
The choice for selection of provinces, districts, villages and farmers was based on production potential per province as well as the presence of diverse cassava varieties as opposed to uniform variety cultivation. Because of this, three provinces namely Nampula, Inhambane and Maputo (Fig. 1) were chosen for the study. Within each province, three districts, three villages and four farmers per village were selected to give a population size of 108 (3 provinces × 3 districts × 3 villages × 4 farmers = 108). The selected farms were approximately 10 km apart from each other.
Map of Mozambique with provinces where the survey was conducted.

Sampling method
On reaching a farmer, an explanation of the purpose of the visit was given and consent was sought for data collection. The methodology according to the manual of Cox et al. (Reference Cox, Nakabonge and Ferguson2015) prepared by the IITA, in collaboration with the National Crop Resources Research Institute (NaCRRI), Uganda was followed. This manual included a questionnaire for key informant interviews, a form for information on particular landraces, and a germplasm collection form. These forms have been used previously for the collection of cassava varieties and farmer knowledge in Uganda and Tanzania. The key informant interview included such aspects as the location and size of the farm, the age, gender, occupation and role of the key informant in farm operations and the name of each cassava landrace grown. A separate ‘landrace form’ was completed for each landrace detailing how long the key informant had grown the landrace, how they acquired it, whether they wanted to grow more or less of the variety and what they liked or disliked about the variety. Yield, storability in the ground, drought tolerance, maturity time, disease and pest resistance, cooking quality, flour quality, taste and market demand were scored by the key informant on a scale of 1 to 5, with 5 being excellent. Photographs of each landrace were also taken. A germplasm collection form detailed agro-morphological characters of each landrace. Leaf samples were collected both in 96-well plates and in Falcon tubes with silica gel as a desiccating agent, for subsequent DNA extraction. Snowball technique was used to locate the next farmer growing cassava landraces. On reaching the next farmer, a descriptor was used to compare photos taken from the previous farm to identify if there were different varieties on the farm, as well as by reference to variety name. This was used to try to avoid the collection of clonal duplicates.
DNA extraction, quantification and genotyping
Cassava leaf samples were shipped to IITA for DNA extraction following a modified protocol described by Dellaporta et al. (Reference Dellaporta, Wood and Hicks1983). The quantity and quality of DNA were assessed using a NanoDrop, with a 260/280 nm reading of between 1.7 and 1.9 indicating pure DNA, with little contamination of proteins or polysaccharides. DNA was then diluted to 50 ng/μl. Twenty microliters of DNA were prepared in 96-well plates and sent to LGC (UK) for KASP genotyping using 36 SNP markers (Table S1). Four SNPs (MeSc11_7401569, MeSc11_23108428, MeSc11_23161661, MeSc11_23161808) were putatively associated with CBSD resistance and 34 were not associated with any trait, but were selected from previous studies to have a high minor allele frequency (MAF), were more likely to be polymorphic and were distributed across the genome (Ferguson et al., Reference Ferguson, Rabbi, Kim, Gedil, Lopez-Lavalle and Okogbenin2012b).
Data analysis
Genotypes with more than 15% missing data were excluded from downstream analysis. The simple matching coefficient was used to calculate a dissimilarity matrix using DARwin version 6.0.13 (Perrier and Jacquemoud-Collet, Reference Perrier and Jacquemoud-Collet2006) with the minimum proportion of valid data required for each unit pair set at 70%. The unweighted neighbour joining method was used to construct a dendogram based on the dissimilarity matrix with bootstrap set at 10,000 times. Principal component analysis (PCA) was also performed using DARwin software as a different way of representing relationships among varieties.
GenAlEx 6.502 (Peakall and Smouse Reference Peakall and Smouse2006, Reference Peakall and Smouse2012) was used to conduct analysis of molecular variance (AMOVA) to discern the genetic variance within and among cassava growing populations. The same software was used to calculate diversity parameters between populations including; observed heterozygosity (Ho), expected heterozygosity (He), fixation index (F), Shannon's Information Index (I) and Number of effective alleles (Ne).
Results
Cassava varieties
A total of 108 cassava DNA samples were collected (Table S2). This comprised 103 samples collected from three provinces of Mozambique and five from Tanzania. Four CBSD tolerant Tanzanian genotypes with a known response to CBSD; namely Namikonga, Nachinyaya, Kiroba and NDL06/132, and a CBSD susceptible variety, Albert, also from Tanzania were used to identify closely related Mozambican varieties that were more likely to possess the same QTL (Masumba et al., Reference Masumba, Kapinga, Mkamilo, Kasele, Kulembeka, Rounsley, Bredeson, Lyons, Rokhsar, Kanju, Katari, Myburg, van der Merwe and Ferguson2017). The majority (89.8%) of genotypes collected in Mozambique were landraces, the rest (10.2%) being improved varieties. The greatest proportion of improved varieties was from Maputo, of the 27 varieties collected in Maputo, seven were improved and 20 were landraces. In Nampula province, only two of the total of 38 were improved varieties. All varieties (38) collected from Inhambane province were landraces. The dominant cultivated varieties were; Calamidade and Tambuca in Nampula; Chinhembwe, and Cucci in Maputo; Passi and Rungusabonet in Inhambane. These dominated because they were similar varieties grown under different names. For example, Calamidade was also grown under local names FP1 and Jaime, while Tambuca was similar to Kubha and Manel.
Farmers’ perception about cassava
A total of 44 key informants were interviewed, 91% were heads of families and the rest (9%) family members. The majority (45%) of these farmers had grown cassava for over 50 years; a few farms (9%) had just started growing the crop (less than 5 years). Both men and women participated in the production of the crop as opposed to one gender. 86% of the respondents reported equal participation of both genders in activities while 14% were only women. No single man was directly involved in cassava production without the help of a woman. Production was mainly on a small scale (less than 1 ha); this constituted 56.8% of the total production in the three provinces. Only two farms accounting for 4.5% had cultivated cassava on a large scale (greater than 10 ha). The rest of the farmers (38.7%) were engaged in medium-scale cassava production (5–10 ha). The main use of the crop was direct human consumption (94%) through fresh roots and leaves. Processing was restricted to a few varieties including, Xipolani, Amarelo, Rico, Vitoria, Rungusabonet and Cucci, which were made into ‘Rale’ (a fermented and precooked food product similar to West African gari). This accounted for 6% of the total utilization. The decision to grow a given variety was dependent on farmer preferences and these included pest and disease resistance, drought tolerance, market demand and cooking quality. Key informants were also asked to rank these factors on a scale of (1–5) per genotype; most varieties grown were ranked tolerant to drought and pests and diseases (average score of 3). Thirty-three varieties scored 4 or above for disease resistance, and all but five of these also scored 4 or above for either cooking quality and/or flour quality. Respondents reported a high (average score of 4) cooking quality and market demand for varieties grown. The overall most important and influential factors in variety selection were market demand and cooking quality (Fig. S1).
DNA genotyping
All the 38 SNP markers amplified the DNA with efficiency greater than 87%. However, three SNP marker (MeSc11_23108428, MeSc11_23161661 and MeSc11_23161808) was monomorphic and was omitted from the analysis. In addition, of the 108 varieties genotyped, four namely Sizankala, Namalide, Amarelinha and Desconecide1 had more than 15% missing data and were omitted from the analysis leaving 104 genotypes. The MAF was relatively high in most loci with an average of 0.372 per locus (Table S3).
Genotype clustering
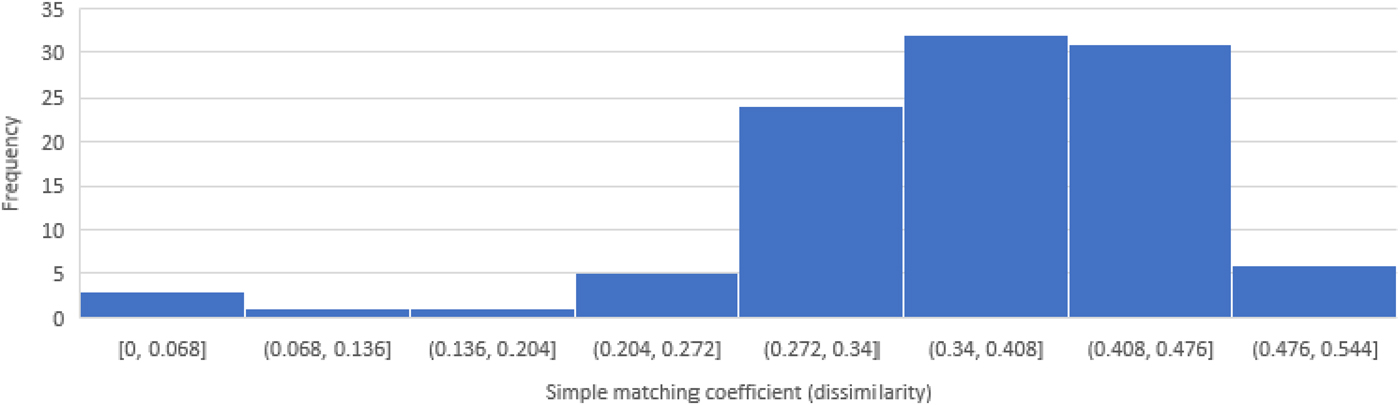
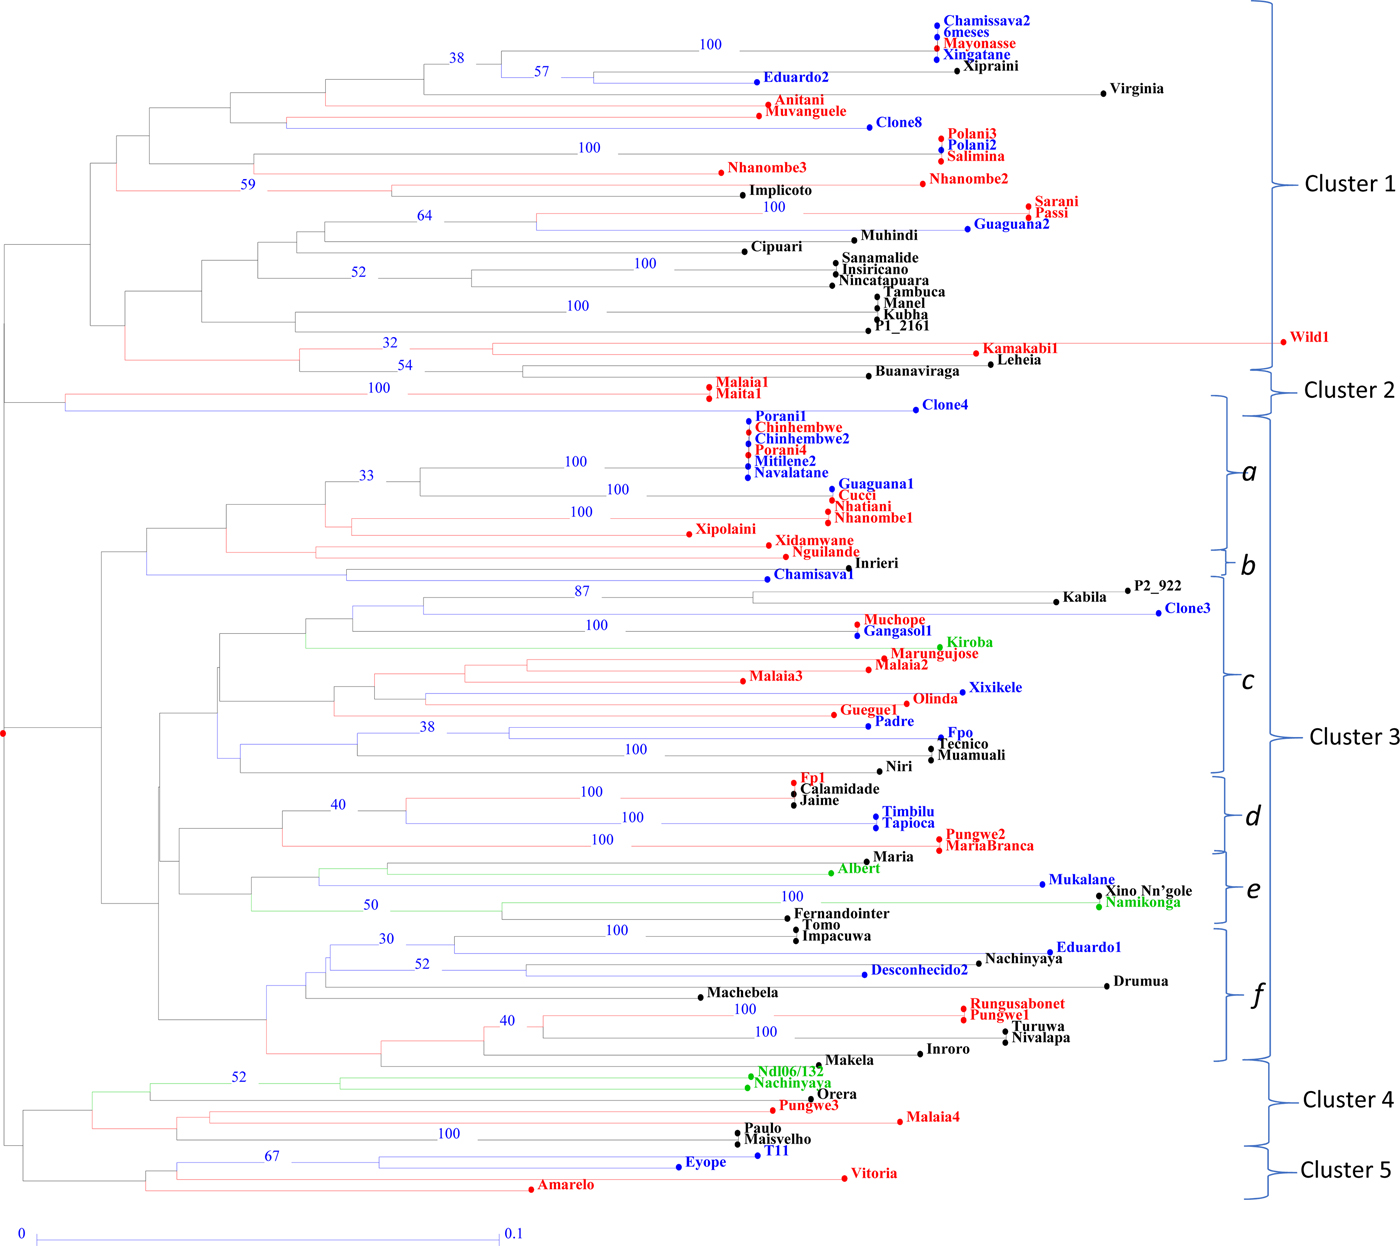
A histogram of the distribution of pairwise dissimilarity values as calculated by the Simple Matching Coefficient is provided in Fig. 2. Genotypes clustered into five main clusters are shown by the dendogram in Fig. 3. Bootstrap values of the initial branches of the dendrogram were less than 30, indicating little support for these branches, and a close relationship between all germplasm. No genotype from Tanzania was present in Cluster 1. This cluster had genotypes from all three provinces, with a group of particularly closely related germplasm from Nampula. Sanamalide, Insiricano and Nincatapuara all appeared identical, as did Tambuca, Manel and Kubha.
Histrogram showing the distribution of pairwise dissimilarity values as calculated by the Simple Matching Coefficient.

Dendogram produced by unweighted neighbour joining method, based on distances generated by the Simple Matching Coefficient. Genotypes are coloured according to the origin of collection. Black – Nampula, Red – Inhambane, Blue – Maputo, Green – Tanzania. Bootstrap values >30 indicated on branches. (see Powerpoint file attached).

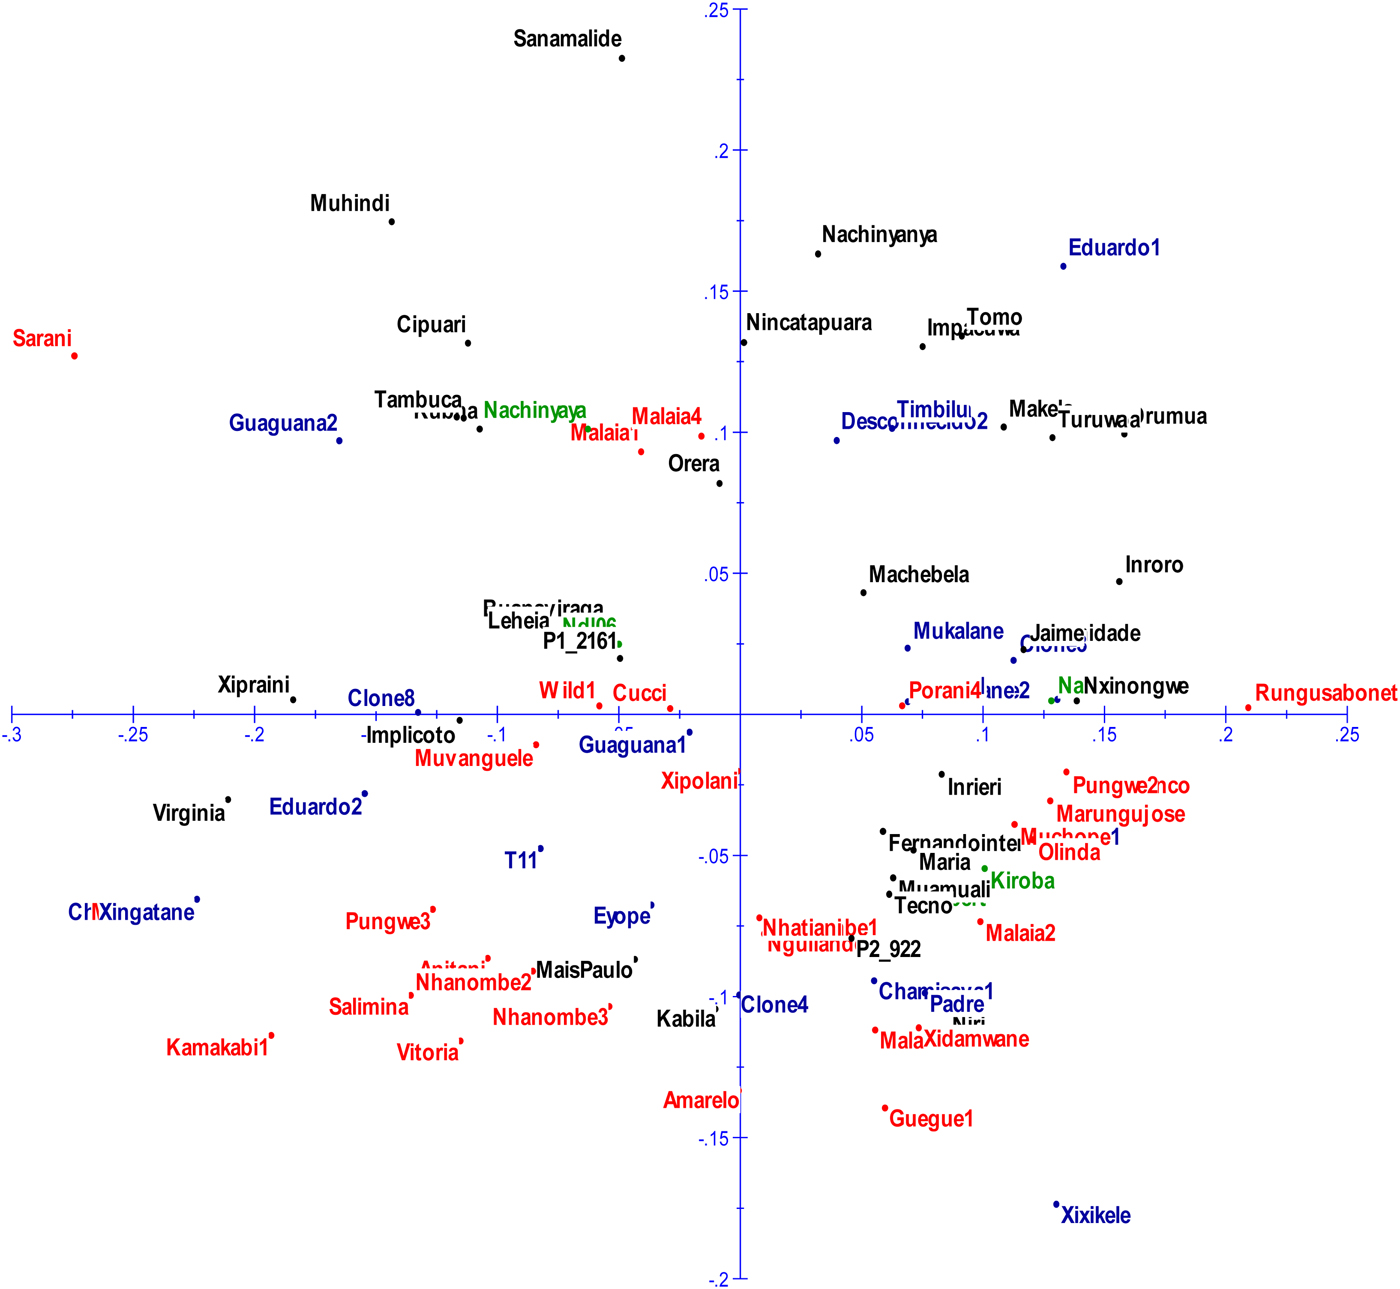
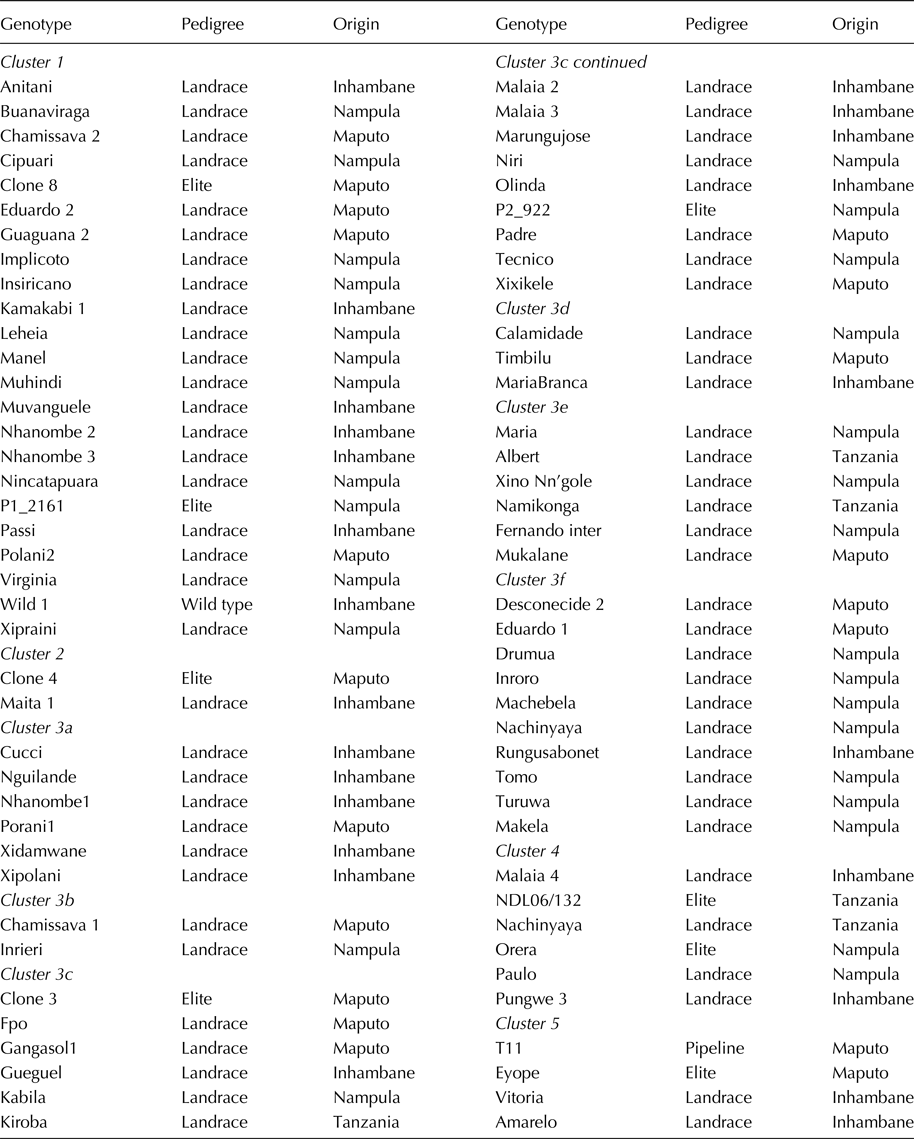
Cluster 2 consisted of only three genotypes; Maita1 and Malaia1 which were identical and from Inhambane, and Clone 4, an unidentified genotype, which was quite distinct and possibly a recent import to the Maputo area. Cluster 3 was the largest cluster with 57 genotypes representing all provinces. Although all relatively closely related, five sub-clusters can be discerned (Fig. 3). The first (3a) consists of 13 genotypes from Maputo and Inhambane, six and four of which form groups of identical genotypes. Sub-cluster 3c is the largest sub-cluster with 17 genotypes and is characterized by the CBSD tolerant genotype from Tanzania, Kiroba. Sub-cluster 3e consists of six genotypes including the CBSD resistant genotype Namikonga and the CBSD susceptible genotype, Albert, both from Tanzania. A summary of each cluster is presented in Table 1. The PCA as shown in Fig. 4, revealed the same trend as the dendogram with most genotypes from Maputo and Inhambane clustering together below the X-axis whereas genotypes collected from Nampula were above the X-axis. The X-axis accounted for 12.65% of the total variation while Y-axis accounted for only 7.45% of the total variation.
Principle component analysis of 104 genotypes. Genotypes are coloured according to the origin of collection. Black –Nampula, Red – Inhambane, Blue – Maputo, Green – Tanzania. the X-axis accounts for 12.65% while Y-axis accounts for 7.45 of the total variation.

Summary of genotypes in five sub-clusters based on genetic dissimilarity

Note: Genotypes with different names but genetically similar have been included once.
Genotypes similarity by CBSD response
Genotypes whose response to CBSD is clearly known were included in genotyping to relate such genotypes with Mozambican (Mz) germplasm. These included tolerant genotypes; Nachinyaya, Namikonga, Kiroba, NDL06 and a susceptible one, Albert (Kanju et al., Reference Kanju, Mkamilo, Mgoo and Ferguson2010; Kulembeka, Reference Kulembeka2010; Masumba et al., Reference Masumba, Kapinga, Mkamilo, Kasele, Kulembeka, Rounsley, Bredeson, Lyons, Rokhsar, Kanju, Katari, Myburg, van der Merwe and Ferguson2017). Closeness in identity defined as a dissimilarity value of less than or equal to 0.25 revealed that the Mozambican landrace Inroro from Nampula was similar to Kiroba (dissimilarity of 0.235), Cipuari (0.226) also from Nampula was similar to Nachinyaya, as was another CBSD tolerant clone NDL06/132 (0.177). Also within the defined threshold of dissimilarity to the Nachinyaya and NDL06/132 group were five genotypes all from Nampula province; these were Paulo (0.229) and Maisvelho (0.229) which were identical, Tecnico (0.243) and Muamuali (0.25) which clustered together, and Cipuari (0.229). Xino Nn'gole from Nampula was genetically identical to Namikonga based on the 35 SNPs used, and Fernandointer also from Nampula was very similar (0.191). Also within this cluster, but slightly more distant was the Tanzanian variety Albert, Fpo from Maputo and Xidamwane from Inhambane all with a dissimilarity of 0.25 to Namikonga. There were 13 genotypes with dissimilarities ⩽2.5 to the CBSD susceptible variety, Albert. These included six genotypes from Inhambane (Fp1 (0.229), Guegue1 (0.243), Malaia3 (0.25), Nguilande (0.243), Xidamwane (0.243) and Xipolaini (0.25)), four genotypes from Nampula (Calamidade (0.229), Fernandointer (0.2), Jaime (0.229) and Maria (0.2)), two genotypes from Maputo (Padre (0.229) and Porani1(0.25)) and the Tanzanian CBSD resistant genotype, Namikonga (0.25).
Genetic diversity by origin of collection
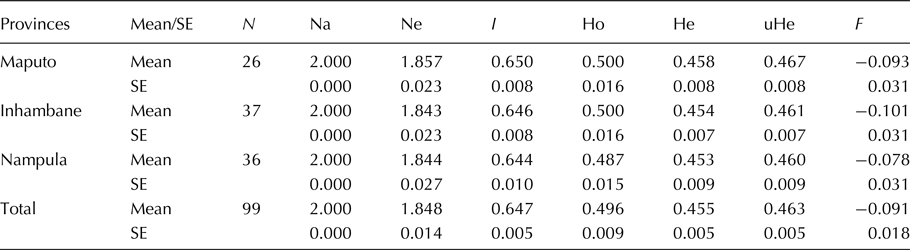
Generally, the genetic diversity for cassava germplasm among the three provinces was similar with mean Shannon information index (I) of 0.647 (Table 2). The proportion of observed heterozygotes (Ho) was the same in Inhambane and Maputo whereas the gene diversity/He was slightly higher in Maputo than either Inhambane or Nampula. MAF in all the provinces ranged from 0.23 to 0.5 (Table S3).
Mean and standard error for each province heterozygosity, polymorphism and F-statistic

N-Population size; Na-Number of different alleles; Ne-Number of effective alleles; I-Shannon information index; Ho-observed heterozygosity; He-expected heterozygosity/Nei's gene diversity index; uHe – Nei's unbiased estimate of gene diversity, and F-fixation index.
Analysis of molecular variance
AMOVA revealed that genetic variation was highly distributed within individual genotypes (98%) with very little variation among provinces accounting for only 2%. The Fst value based on permutation across all the data set was 0.023; this was low compared with a moderate one ranging from 0.05 to 0.15, thus indicating little variation in allele frequencies between populations, and little differentiation among provinces.
Discussion
The main objective of the study was to determine genetic relationships between cassava genotypes collected from farmers’ fields in Mozambique with five positive checks from Tanzania whose response to CBSD is known. A close relationship between a Mozambican variety and a resistant Tanzanian variety would indicate Mozambican varieties for further CBSD evaluation. Thirty-five SNP markers were used to amplify DNA from 108 Mozambican landraces. Genotyping results were able to confirm which varieties were different from one another, even though a far greater number of markers, and ideally whole genome re-sequencing data, would be needed to confirm identical clones. In total 108 genotypes were collected. According to Brown and Marshall (Reference Brown, Marshall, Guarino, Ramanatha Rao and Reid1995), a collection of 50–100 individuals provides 95% probability of capturing alleles with a frequency greater than 0.05. Thus, the selected sample size was adequate to capture all or nearly all polymorphic alleles.
Genetic similarity and cluster analysis showed genotypes clustering into five groups, although the distinction between groups is not well supported, as indicated by low bootstrap values of the initial branches. Inferences from this study thus focus mainly on actual dissimilarity values, as opposed to clustering.
Eight genotypes with the greatest similarity to the Tanzanian CBSD resistant germplasm were identified. This included Inroro which was similar to Kiroba; Cipuari, Paulo/Maisvelho (identical) and Tecnico/Muamuali (identical) which were similar to Nachinyaya and NDL06/132; Fernando inter, Fpo and Xidamwane which were similar to Namikonga, and Xino Nn'gole which was identical to Namikonga. It is important that these genotypes are further evaluated for field response to CBSD, as if found to possess CBSD tolerance, could contribute significantly to the cassava CBSD breeding program in Mozambique.
Phenotypic similarities between varieties found to be identical here, Xino Nn'gole and Namikonga, have been observed in the past (Kanju, pers. commun.). Namikonga is a CBSD resistant clone that was derived from the Amani breeding program in the late 1930s – 40s in Tanga Province, Tanzania (Masumba et al., Reference Masumba, Kapinga, Mkamilo, Kasele, Kulembeka, Rounsley, Bredeson, Lyons, Rokhsar, Kanju, Katari, Myburg, van der Merwe and Ferguson2017). Namikonga is closely related to one of the best Amani clones, Amani 46106/27, and Kaleso in Kenya (Hillocks and Jennings, Reference Hillocks and Jennings2003). It is possible that Xino Nn'gole is the Mozambican derivative of Namikonga, although this will have to be confirmed using whole genome re-sequencing or genotyping-by-sequencing. It is interesting to note that from the farmer questionnaire, farmers reported this variety as being tolerant to CBSD, but associated with low yields and takes on average more than 12 months to bulk commercial roots. According to Kanju et al. (Reference Kanju, Mkamilo, Mgoo and Ferguson2010) and Masumba et al. (Reference Masumba, Kapinga, Mkamilo, Kasele, Kulembeka, Rounsley, Bredeson, Lyons, Rokhsar, Kanju, Katari, Myburg, van der Merwe and Ferguson2017), these are attributes of Namikonga. Thus, the information gained from the key informant interview is consistent with breeder knowledge supporting the evidence that Xino Nn'gole is similar to Namikonga and Kaleso. It is highly likely that molecular markers associated with CBSD root necrosis and foliar resistance in Namikonga would be transferrable to Xino Nn'gole.
Dissimilarity measures also showed that Nachinyaya and NDL06/132 were closely related as were Namikonga and Albert. Recently, Bredeson et al. (Reference Bredeson, Lyons, Prochnik, Wu, Ha, Edsinger-Gonzales, Grimwood, Schmutz, Rabbi, Egesi, Nauluvula, Lebot, Ndunguru, Mkamilo, Bart, Setter, Gleadow, Kulakow, Ferguson, Rounsley and Rokhsar2016) through genotyping by sequencing of wild and cultivated cassava species reported the same relationship between these genotypes. Our findings using thirty-five SNP markers agree with this previous study making SNPs a reliable tool for diversity studies. Indeed Nachinyaya and NDL06/132 were also closely related to the Mozambique variety Cipuari that was reported by farmers to be tolerant to CBSD. The response of Cipuari to CBSD should be further evaluated under field conditions to ascertain its response to CBSD.
The five Tanzanian genotypes clustered within the Mozambican germplasm indicating the similarity of Tanzanian and Mozambican germplasm in general and implying that there has been an exchange of stakes even across international borders despite phytosanitary regulations. Our results agree with Kawuki et al. (Reference Kawuki, Herselman, Labuschagne, Nzuki, Ralimanana, Bidiaka, Kanyange, Gashaka, Masumba, Mkamilo, Gethi, Wanjala, Zacarias, Madabula and Ferguson2013) who reported that cassava germplasm from Mozambique clustered together with germplasm collected from Tanzania and Madagascar, as opposed to that from Uganda and DRC. Interestingly the genotypes with the greatest similarity to the Tanzanian CBSD resistant germplasm were all from Nampula. This included Inroro similar to Kiroba; Cipuari, Paulo, Maisvelho, Tecnico and Muamuali similar to Nachinyaya and NDL06/132; and Xino Nn'gole and Fernando inter, identical and similar to Namikonga respectively. Nampula is in northern Mozambique and borders Tanzania whereas Inhambane is just separated from Maputo by one province, in the south of Mozambique (Fig. 1). It is likely that there has been a greater exchange of germplasm between Nampula and Tanzania via the southern Tanzanian border. Pariyo et al. (Reference Pariyo, Tukamuhabwa, Baguma, Kawuki, Alicai, Gibson, Kanju, Wanjala, Harvey, Nzuki, Rabbi and Ferguson2013) also found that most genotypes from northern Mozambique clustered with Tanzanian genotypes. Results here suggest that resistance or tolerance to CBSD is most likely to be found in the northern Mozambique province of Nampula.
Recently, Pariyo et al. (Reference Pariyo, Tukamuhabwa, Baguma, Kawuki, Alicai, Gibson, Kanju, Wanjala, Harvey, Nzuki, Rabbi and Ferguson2013) stressed the need to identify more sources of CBSD resistance to add genetic variability to breeding pools to enhance the durability of resistance. Indeed, Oyesigye et al. (Reference Oyesigye, Zacarias, Mondjana, Magaia and Ferguson2016) during a screening of cassava genotypes for resistance to CBSD through mechanical grafting, reported that genotype Cucci resisted both foliar and root symptom accumulation while Timbilu and Fpo were tolerant. Interestingly, Fpo was closely related to Namikonga (dissimilarity of 0.25), whereas Cucci and Timbilu were more distantly related to all Tanzanian varieties suggesting they may possess sources of resistance or tolerance different from Tanzania genotypes included in the study. Moreover, these genotypes were from southern Mozambique which is distant from Tanzania. If the results obtained in controlled conditions (screen house) are shown to be consistent with the field trial, these genotypes may provide opportunities for combining different forms of resistance for an effective CBSD breeding program while considering farmer and consumer preferences of taste and cooking qualities
Kawuki et al. (Reference Kawuki, Herselman, Labuschagne, Nzuki, Ralimanana, Bidiaka, Kanyange, Gashaka, Masumba, Mkamilo, Gethi, Wanjala, Zacarias, Madabula and Ferguson2013) while working with cassava genotypes from different countries in southern, eastern and central Africa, included 82 genotypes from Mozambique which he genotyped using 26 simple sequence repeat markers. He reported high values of He and Ho (0.55 and 0.58 respectively) with a Shannon index value of 1.05. Pariyo et al. (Reference Pariyo, Tukamuhabwa, Baguma, Kawuki, Alicai, Gibson, Kanju, Wanjala, Harvey, Nzuki, Rabbi and Ferguson2013) while using 13 SNP markers associated with CBSD, included 29 genotypes from Mozambique and also reported high values of He and Ho (0.67 and 0.74, respectively) with a Shannon Index value of 1.33. We report slightly lower values of both He and Ho (0.455 and 0.496 respectively) with a Shannon index value of 0.647 while using 35 SNP markers. This slight discrepancy may be due to the fact that samples analysed here were from three Provinces only rather than dispersed across the whole country.
MAF results indicate a lack of low-frequency alleles, with the rarest minor allele having a frequency of 0.23 This will influence both Shannon's Information index and Nei's Gene Diversity (He). The high MAF is likely to be due to the SNPs selected. SNPs were selected for a high PIC value to increase the probability of them being polymorphic in the Mozambique germplasm. Indeed this was true and all SNPs selected to measure ‘similarity’ were polymorphic. SNPs were not selected specifically to measure diversity. If diversity was to be accurately measured, a larger number of SNPs would be required, with a broader range of PIC values, so that more rare alleles could be targeted.
Results indicated that Nampula province had both low values of Ho and He compared with Maputo and Inhambane. The observed higher values of He and Ho in Maputo and Inhambane compared with Nampula can be attributed to the cropping system in the two provinces. Farmers in Maputo province normally grow cassava for home consumption, not commercially (INE, 2011), however, Nampula is the largest producer of cassava in Mozambique (INE, 2011) and more improved clones are grown here. Improved varieties may be more closely related, having the effect of reducing He, as opposed to the greater diversity landraces seen in Maputo.
AMOVA revealed limited genetic differentiation among provinces. The most differentiation was observed within genotypes. This is also supported by a low Fst value (0.023). A moderate Fst value ranges from 0.05 to 0.15 (Wright, Reference Wright1978), thus indicating little variation in allele frequencies between populations. This limited differentiation among provinces may be due to frequent movement of improved varieties from the breeding programs which are disseminated to farmers (Zacarias pers. commun.) and/or movement of germplasm between provinces as it is customary for people to share cassava stakes as gifts when visiting. In addition, it is likely to reflect a narrow genetic base of germplasm in the country, which is also reflected by low bootstap values of primary branches in cluster analysis. Insufficient SNPs were used to really measure diversity, which was a secondary objective of this study, the major objective being the identification of Mozambican varieties which show similarity to CBSD tolerant Tanzanian varieties.
Breeding for CBSD resistant varieties that are also preferred by farmers is an integral part of managing the disease. To investigate the relationship between farmer preference and disease resistance, key informants were asked to rank the landraces they grow on a 1 to 5 scale for several traits including disease resistance as well as cooking and flour qualities. Of 33 landraces that scored highly in terms of disease resistance (scores 4 or 5), 28 also had scores of 4 or above for either cooking quality and/or flour quality. This suggests no negative association between disease resistance and cooking quality and/or flour quality. Obviously, a more detailed study is required in this regard, but this preliminary information is positive in terms of prospects for the breeding farmer and consumer-preferred disease-resistant varieties.
In conclusion, we identified eight genotypes in Mozambique closely related to four CBSD resistant genotypes in Tanzania. Seven of these are closely related to either Nachinyaya, NDL06/132, Kiroba or Namikonga, while Xino Nn'gole is genetically identical to Namikonga. It is important that these genotypes are evaluated further for response to CBSD as well as farmer and consumer preferred traits including organoleptic and cooking quality. It is likely that if the CBSD resistance in these genotypes is verified, that QTL found to be associated with CBSD resistance in Tanzanian varieties, would also be present in Mozambique varieties. If MAS is developed in Tanzania, it should be transferrable to Mozambican breeding programs.
Supplementary material
The supplementary material for this article can be found at https://doi.org/10.1017/S1479262118000126.
Acknowledgements
This work was conducted with financial support from Scientific directorate of Universidade Eduardo Mondlane and Instituto de Investigação Agrária de Moçambique (IIAM). The authors acknowledge the technical and logistical support from IITA-Nairobi, Kenya and they also thank Mr Federico Madabula, Mrs Nurbibi Cossa, Mr Sofrimento Matsimbe, Mrs Mercy Kairichi and Dr Chiulele Rogerio for their assistance in conducting this study.