Introduction
The digital divide has become a prominent concern across different domains of everyday life. Such a divide encompasses disparities in accessing, using, and being aware of digital technology, with certain marginalised groups being disproportionately affected such as low-income individuals, the elderly and people with disabilities (Chang et al., Reference Chang, Bakken, Brown, Houston, Kreps, Kukafka, Safran and Stavri2004; Yoon et al., Reference Yoon, Jang, Vaughan and Garcia2020). It further amplifies social inequities and contributes to disparities in social status, economic opportunities, education, and cultural engagement. It became especially prominent during the COVID-19 pandemic (Aissaoui, Reference Aissaoui2022; Litchfield et al., Reference Litchfield, Shukla and Greenfield2021) which exposed and exacerbated existing digital inequalities, giving rise to the concept of the ‘COVID divide’ (Beaunoyer et al., Reference Beaunoyer, Dupéré and Guitton2020; Robinson et al., Reference Robinson, Schulz, Blank, Ragnedda, Ono, Hogan, Mesch, Cotten, Kretchmer, Hale, Drabowicz, Yan, Wellman, Harper, Quan-Haase, Dunn, Casilli, Tubaro, Carveth, Chen, Wiest, Dodel, Stern, Ball, Huang and Khilnani2020). During this period the sudden shift to remote work, online education and digital service delivery disproportionately affected marginalised groups who often lacked access to reliable internet connectivity, digital devices, and the necessary digital skills (Nguyen et al., Reference Nguyen, Gruber, Marler, Hunsaker, Fuchs and Hargittai2022; Watts, Reference Watts2020). This amplified the need for a more comprehensive understanding of the digital divide and its impact on various aspects of life.
However, although lower income levels and higher age brackets are associated with increased difficulties in adopting the latest digital technologies, it cannot be definitively asserted that income and age alone are the causes of the digital divide. The digital divide is a multifaceted and systemic concept that signifies the societal disparity between individuals who possess access to and proficiently utilise digital information and communication technologies (ICT), and those who lack such access and skills.
Therefore, the central objective of this study was to identify profiles of individuals distinguished by combinations of factors which contribute to the digital divide, focusing particularly on the context of South Korea. While previous studies have examined various aspects of the digital divide in the country, research employing a person-centred approach to identify distinct profiles of individuals affected by the divide is lacking. Moreover, few studies have investigated the impact of these profiles on life satisfaction across multiple domains. Consequently, this study aimed to address these research gaps by utilising latent profile analysis to identify subgroups of individuals experiencing different levels and types of digital divide and by exploring the antecedents and consequences of these profiles.
To situate the digital divide in South Korea within the broader Asian context, it is essential to consider relevant cases from other countries in the region. For instance, Tahira (Reference Tahira2022) examined digital technology practices and vaccine campaigns in Korea amid the COVID-19 crisis, highlighting the role of health diplomacy. In the same year Dura (Reference Dura2022) investigated the determinants of financial and digital literacy on financial performance in driving post-pandemic economic recovery. Earlier, Danowski and Park (Reference Danowski and Park2020) explored the relationship between digital literacy and online political participation in South Korea. These studies emphasise the importance of understanding the digital divide and its implications across various domains in the Asian context.
South Korea itself is characterised by significant regional disparities in technological advancements, particularly between the capital city, Seoul, and other regions of the country. As the economic and technological hub of the country, Seoul enjoys a higher level of internet reliance and accessibility compared with other urban and non-urban areas. This disparity is often considered an important socio-economic factor, as it influences individuals’ access to information, resources, and opportunities. Residents of Seoul benefit from extensive technological infrastructure and support systems, which facilitate their adoption and utilisation of digital technologies (Lee, Reference Lee2016). By contrast, individuals residing in non-urban regions, especially those outside of Seoul, face additional challenges in acquiring the necessary technical proficiencies to fully participate in the digital society. Such challenges include limited access to high-quality internet connectivity, fewer opportunities for digital skills training and a lack of exposure to the latest technological advancements (Hwang, Reference Hwang2004).
The rapid dissemination of media further magnifies and perpetuates existing inequalities (Van Dijk, Reference Van Dijk2006). Asian nations, including South Korea, have made noteworthy advances in adopting these technologies and transitioning into information societies. However, alongside this progress, a new form of division has arisen between those who can fully capitalise on the advantages offered by the information society and those who are unable to do so (Wong et al., Reference Wong, Law, Fung and Lee2010).
In South Korea, a country experiencing rapid digital transformation and a high reliance on digital technologies, internet access is prevalent, with 99.96 per cent of households having access and approximately 93 per cent of individuals aged three years and older reported as internet users (NIA, 2022). However, although the information-vulnerable class in Korea has relatively high access to digital resources and information, significant disparities persist in terms of digital competency and utilisation. For instance, the information-vulnerable class exhibits lower levels of digital competency (64.5 per cent) and digital utilisation (78.0 per cent) compared with the general public. Understanding the characteristics of vulnerable groups with limited information accessibility and poor digital device utilisation skills can inform nationa l-level policies aimed at reducing the digital divide. Tailored policies that address the specific needs and challenges faced by different vulnerable groups can then provide targeted support and tackle the underlying causes of this divide.
The digital divide manifests differently across populations, influenced by a complex interplay of individual attributes, geographical contexts, and varying degrees of technological competence. This heterogeneity necessitates tailored interventions rather than uniform solutions to effectively address the multifaceted nature of digital inequality. Just as the reasons for encountering the digital divide differ, tailored strategies are needed to address these diverse factors effectively. With regard to the development of policies, if the divide primarily arises from limited information access, policies should focus on expanding physical infrastructure. Alternatively, if the divide is rooted in a lack of utilisation skills, targeted information utilisation education should be provided. Moreover, for individuals facing difficulties in interaction or forming social capital, policies can support them in overcoming social isolation and facilitating communication with a diverse range of individuals through the internet.
Theoretical background
The concept and three levels of the digital divide
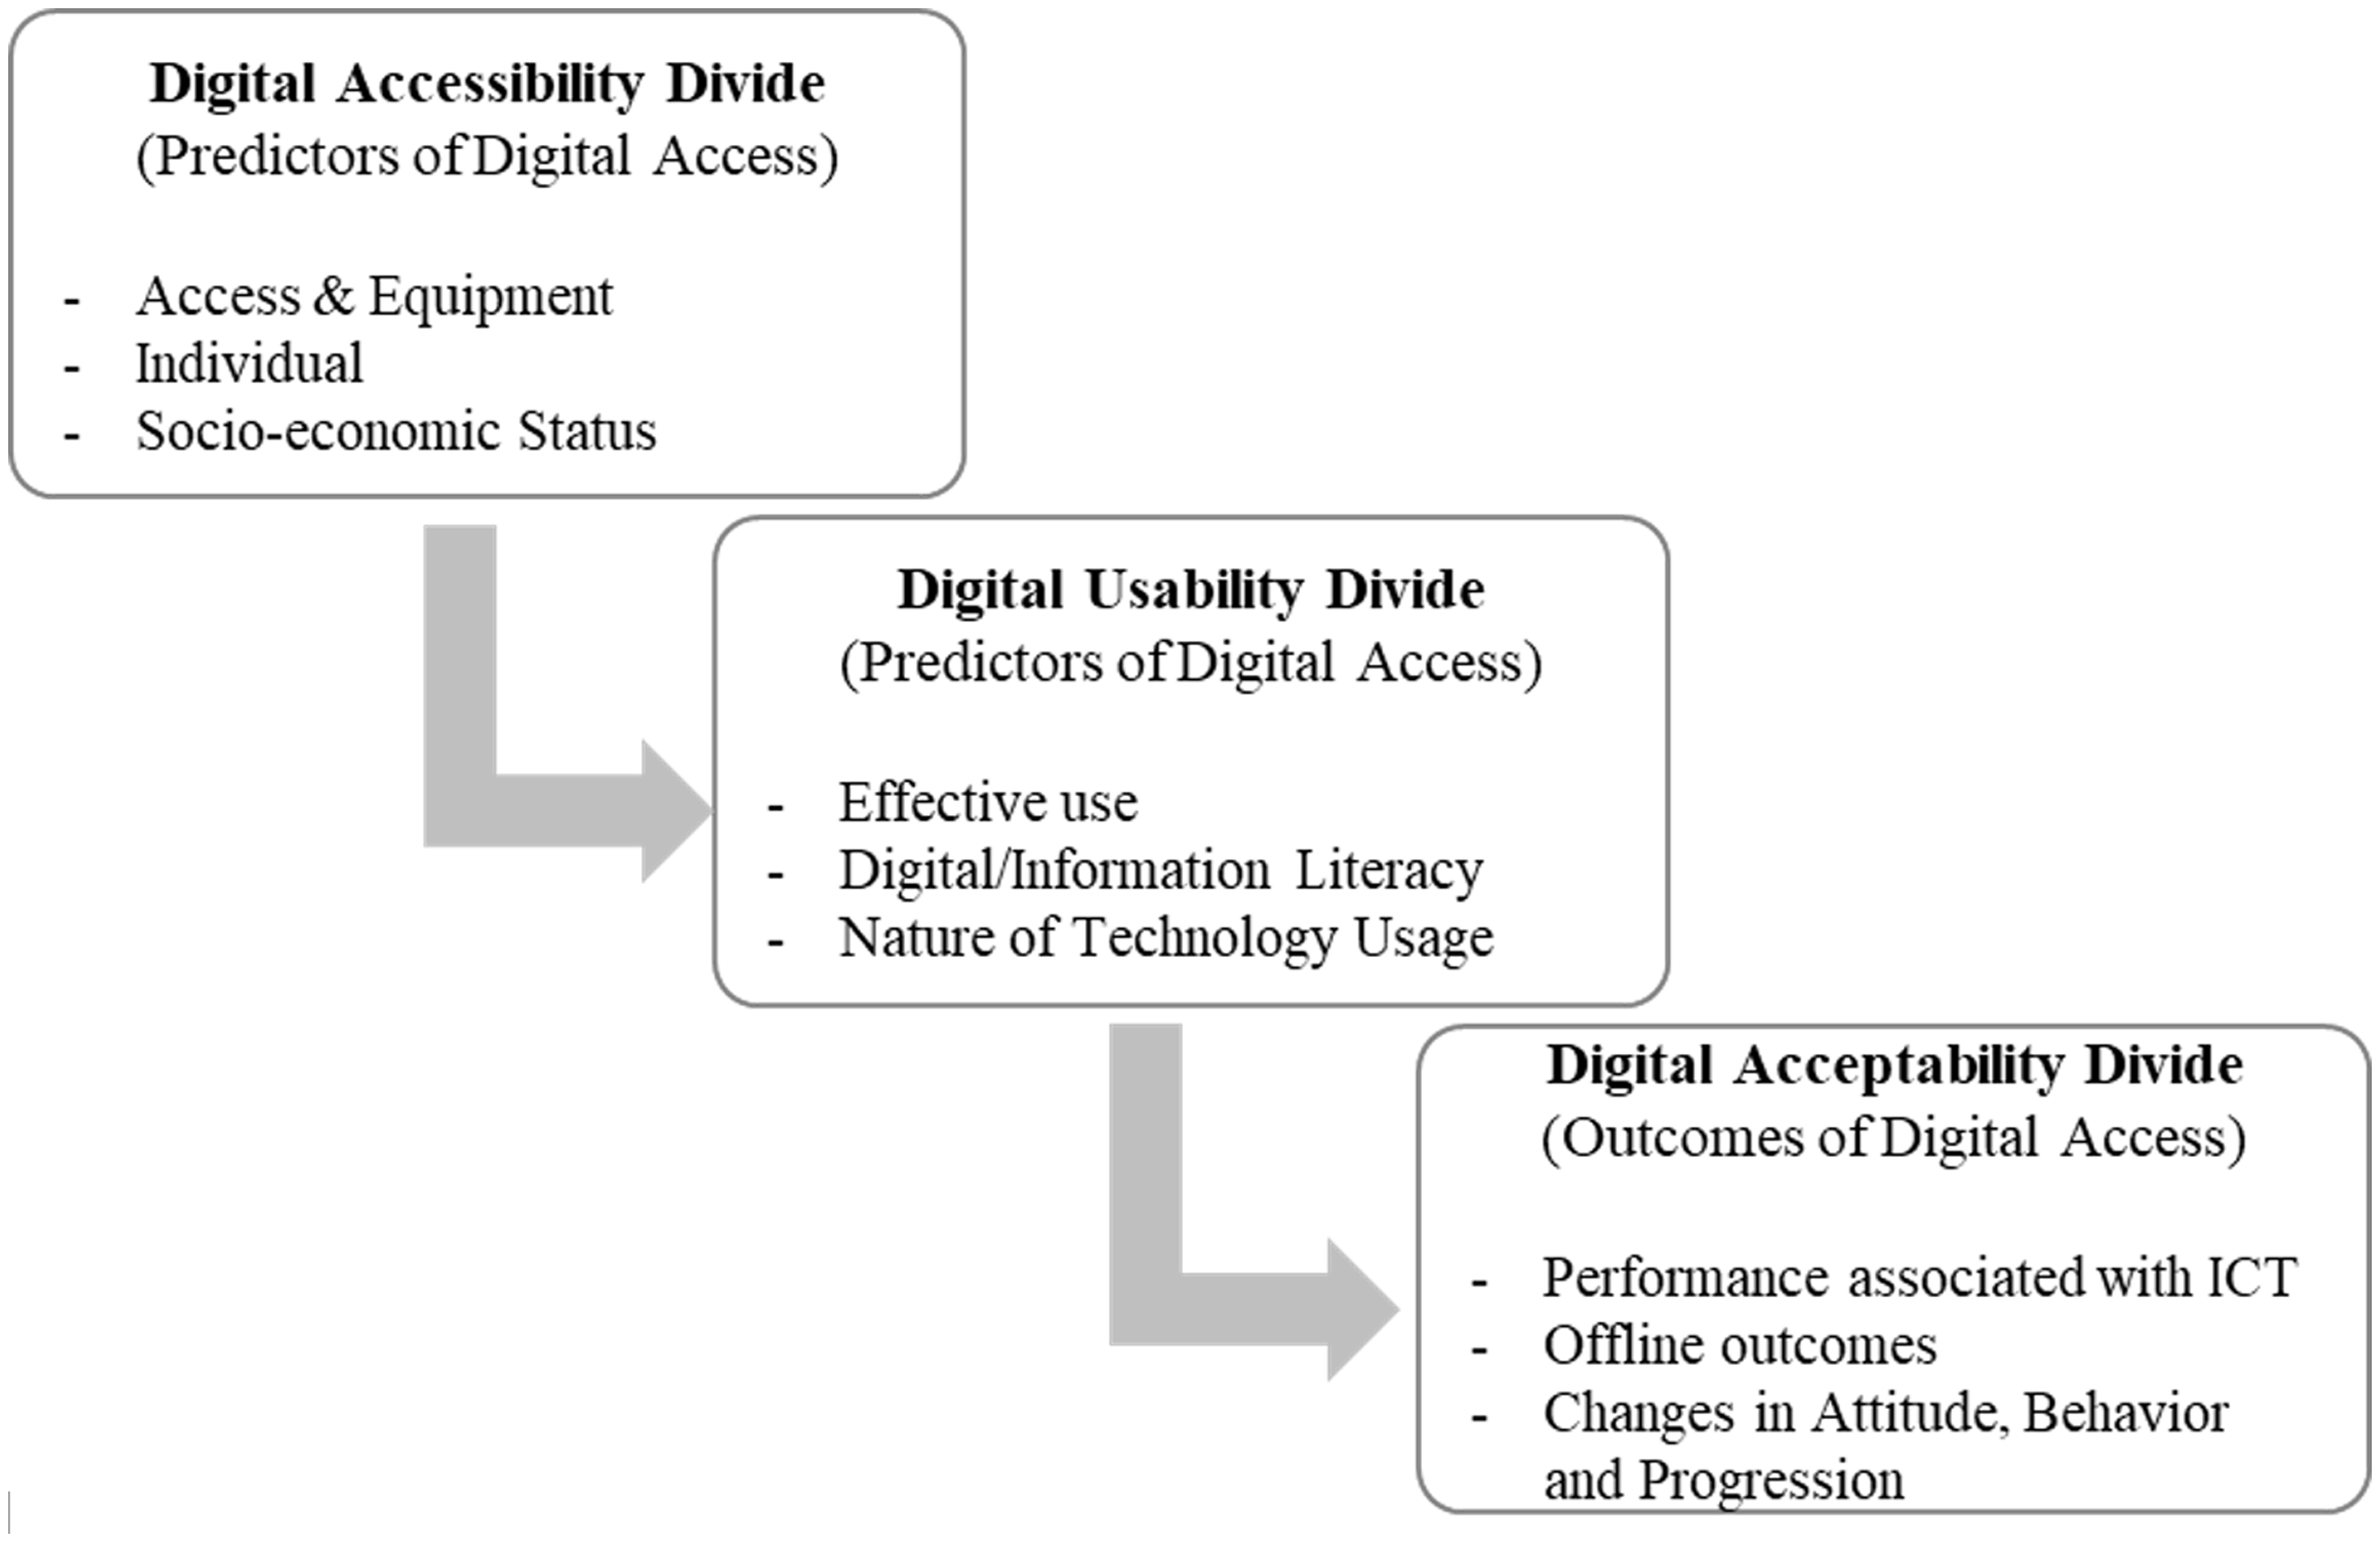
The digital divide is not a recent phenomenon and has been extensively explored in various studies, which have discussed its definitions and implications (Stevenson, Reference Stevenson2009; Vehovar et al., Reference Vehovar, Sicherl, Hüsing and Dolnicar2006; Venkatesh et al., Reference Venkatesh, Morris, Davis and Davis2003). In South Korea, the digital divide has been a subject of research since the early stages of its development. Park (Reference Park2002) examined the closing and widening divides in South Korea during the 1990s, providing a foundation for understanding the evolution of the digital divide in the country. Furthermore, the nature of political governance has a significant impact on South Korean social policy, as discussed in ‘Two-Track Democracy in South Korea: The Interplay between institutional politics and contentious politics’ by Yun (Reference Yun2023). This highlights the importance of considering the political context when analysing the digital divide and its implications for social policy. In recent times, a new approach has emerged to better comprehend the digital divide, aiming to address its complexity and contemporary challenges by considering three specific dimensions: coverage and access, usage, and real-world consequences. Fig. 1 illustrates the three levels of the digital divide: accessibility, usability, and acceptability, as adapted from Adhikari et al. (Reference Adhikari, Mathrani and Parsons2015) and Aissaoui (Reference Aissaoui2022). This framework serves as a foundation for understanding the multifaceted nature of the digital divide and its impact on individuals and society.
Three levels of digital divide (adapted from Adhikari et al., Reference Adhikari, Mathrani and Parsons2015; Aissaoui, Reference Aissaoui2022).

The first level: Accessibility
The first level of the digital divide centres on internet access and the utilisation of information and communication technologies (ICT) (Ferreira et al., Reference Ferreira, Sá, Martins and Serpa2021). Initially, this was linked to the socio-economic divide between individuals who had access to computers and the internet and those who did not. South Korea’s notable advancements in ICT development and minimal disparities in information accessibility are evident through its high rankings in the International Telecommunication Union’s ICT Development Index (IDI), reflecting its advanced infrastructure (ITU 2018). This, along with high internet penetration and extensive usage, means accessibility issues are not significant factors contributing to the information gap in South Korea. Instead, the information divide is more likely influenced by effective utilisation and the outcomes derived from such utilisation, emphasising the importance of digital literacy and skills.
The second level: Usability
The second level of the digital divide goes beyond mere access and encompasses disparities in the utilisation of digital resources (Lutz, Reference Lutz2019; Van Deursen and Mossberger, Reference Van Deursen and Mossberger2018). Research has demonstrated that people’s usage of digital technologies differs considerably, even in areas with high levels of access (Hargittai and Hinnant, Reference Hargittai and Hinnant2008). Various factors such as income, education, race, gender, geographical location, age, skills, awareness, and attitudes influence both the access to and active usage of ICTs (Mossberger et al., Reference Mossberger, Tolbert and Gilbert2006 ).
This underscores the significance of considering a combination of various digital divide factors and adopting a person-centred approach. Such an approach acknowledges the intersectionality of these factors, their cumulative effects and the necessity for tailored interventions to address the diverse needs of individuals and communities. By adopting this approach, this study sought to bridge the digital divide and foster a more equitable and inclusive digital society.
The third level: Acceptability
The third level of the digital divide, acceptability, focuses on the awareness gap and the real-world consequences resulting from disparities in access and usage of digital resources (Fuchs, Reference Fuchs2009; Scheerder et al., Reference Scheerder, Van Deursen and Van Dijk2017). Revolving around information acceptance and cultural capital related to information and the internet, this level is closely linked to tangible outcomes and quality of life, distinguishing it from the previous two levels. It directly influences quality of life by affecting information acceptance and cultural capital (Stern et al., Reference Stern, Adams and Elsasser2009; Van Dijk, Reference Van Dijk2005).
Understanding how the digital divide impacts life satisfaction is crucial for addressing societal inequalities and promoting well-being in the digital era. While the aforementioned studies do not directly address individual life satisfaction, they offer insights into the factors that can influence the quality of life and well-being of individuals within the context of the digital divide. Numerous studies indicate that individuals utilise the internet for personal advantages across various domains, including healthcare, social relationships and business (Blank and Lutz, Reference Blank and Lutz2018; Van Deursen and Helsper, Reference Van Deursen and Helsper2015; Millán et al., Reference Millán, Millán and Román2018; Scheerder et al., Reference Scheerder, Van Deursen and Van Dijk2017).
The research model and research questions
The research model adopted in this study was derived from Resource and Appropriation Theory (RAT), which provides insights into the process of accessing digital technology. This theory highlights the sequential steps involved in bridging the digital divide, including a positive attitude, physical access, skills, and ensuring a sequential flow (Van Dijk, Reference Van Dijk, Bus, Crompton, Hildebrandt and Metakides2012). By considering the key elements and factors influencing the digital divide, RAT provides a perspective for understanding the divide through the four phases of access to or adoption of digital media.
In addition to RAT and Hargittai’s (Reference Hargittai2003) digital inequality factors, other theoretical frameworks have been employed to understand the digital divide. For example, the Technology Acceptance Model (TAM; Davis, Reference Davis1989) and the Unified Theory of Acceptance and Use of Technology (UTAUT; Venkatesh et al., Reference Venkatesh, Morris, Davis and Davis2003) have been widely employed to examine factors influencing technology adoption and usage. However, these models focus primarily on individual-level factors and may not fully capture the multidimensional nature of the digital divide. RAT and Hargittai’s factors, by contrast, consider a broader range of factors, including technical means, autonomy of use, social support networks, and experience, making them well-suited for a comprehensive examination of the digital divide in the context of this study.
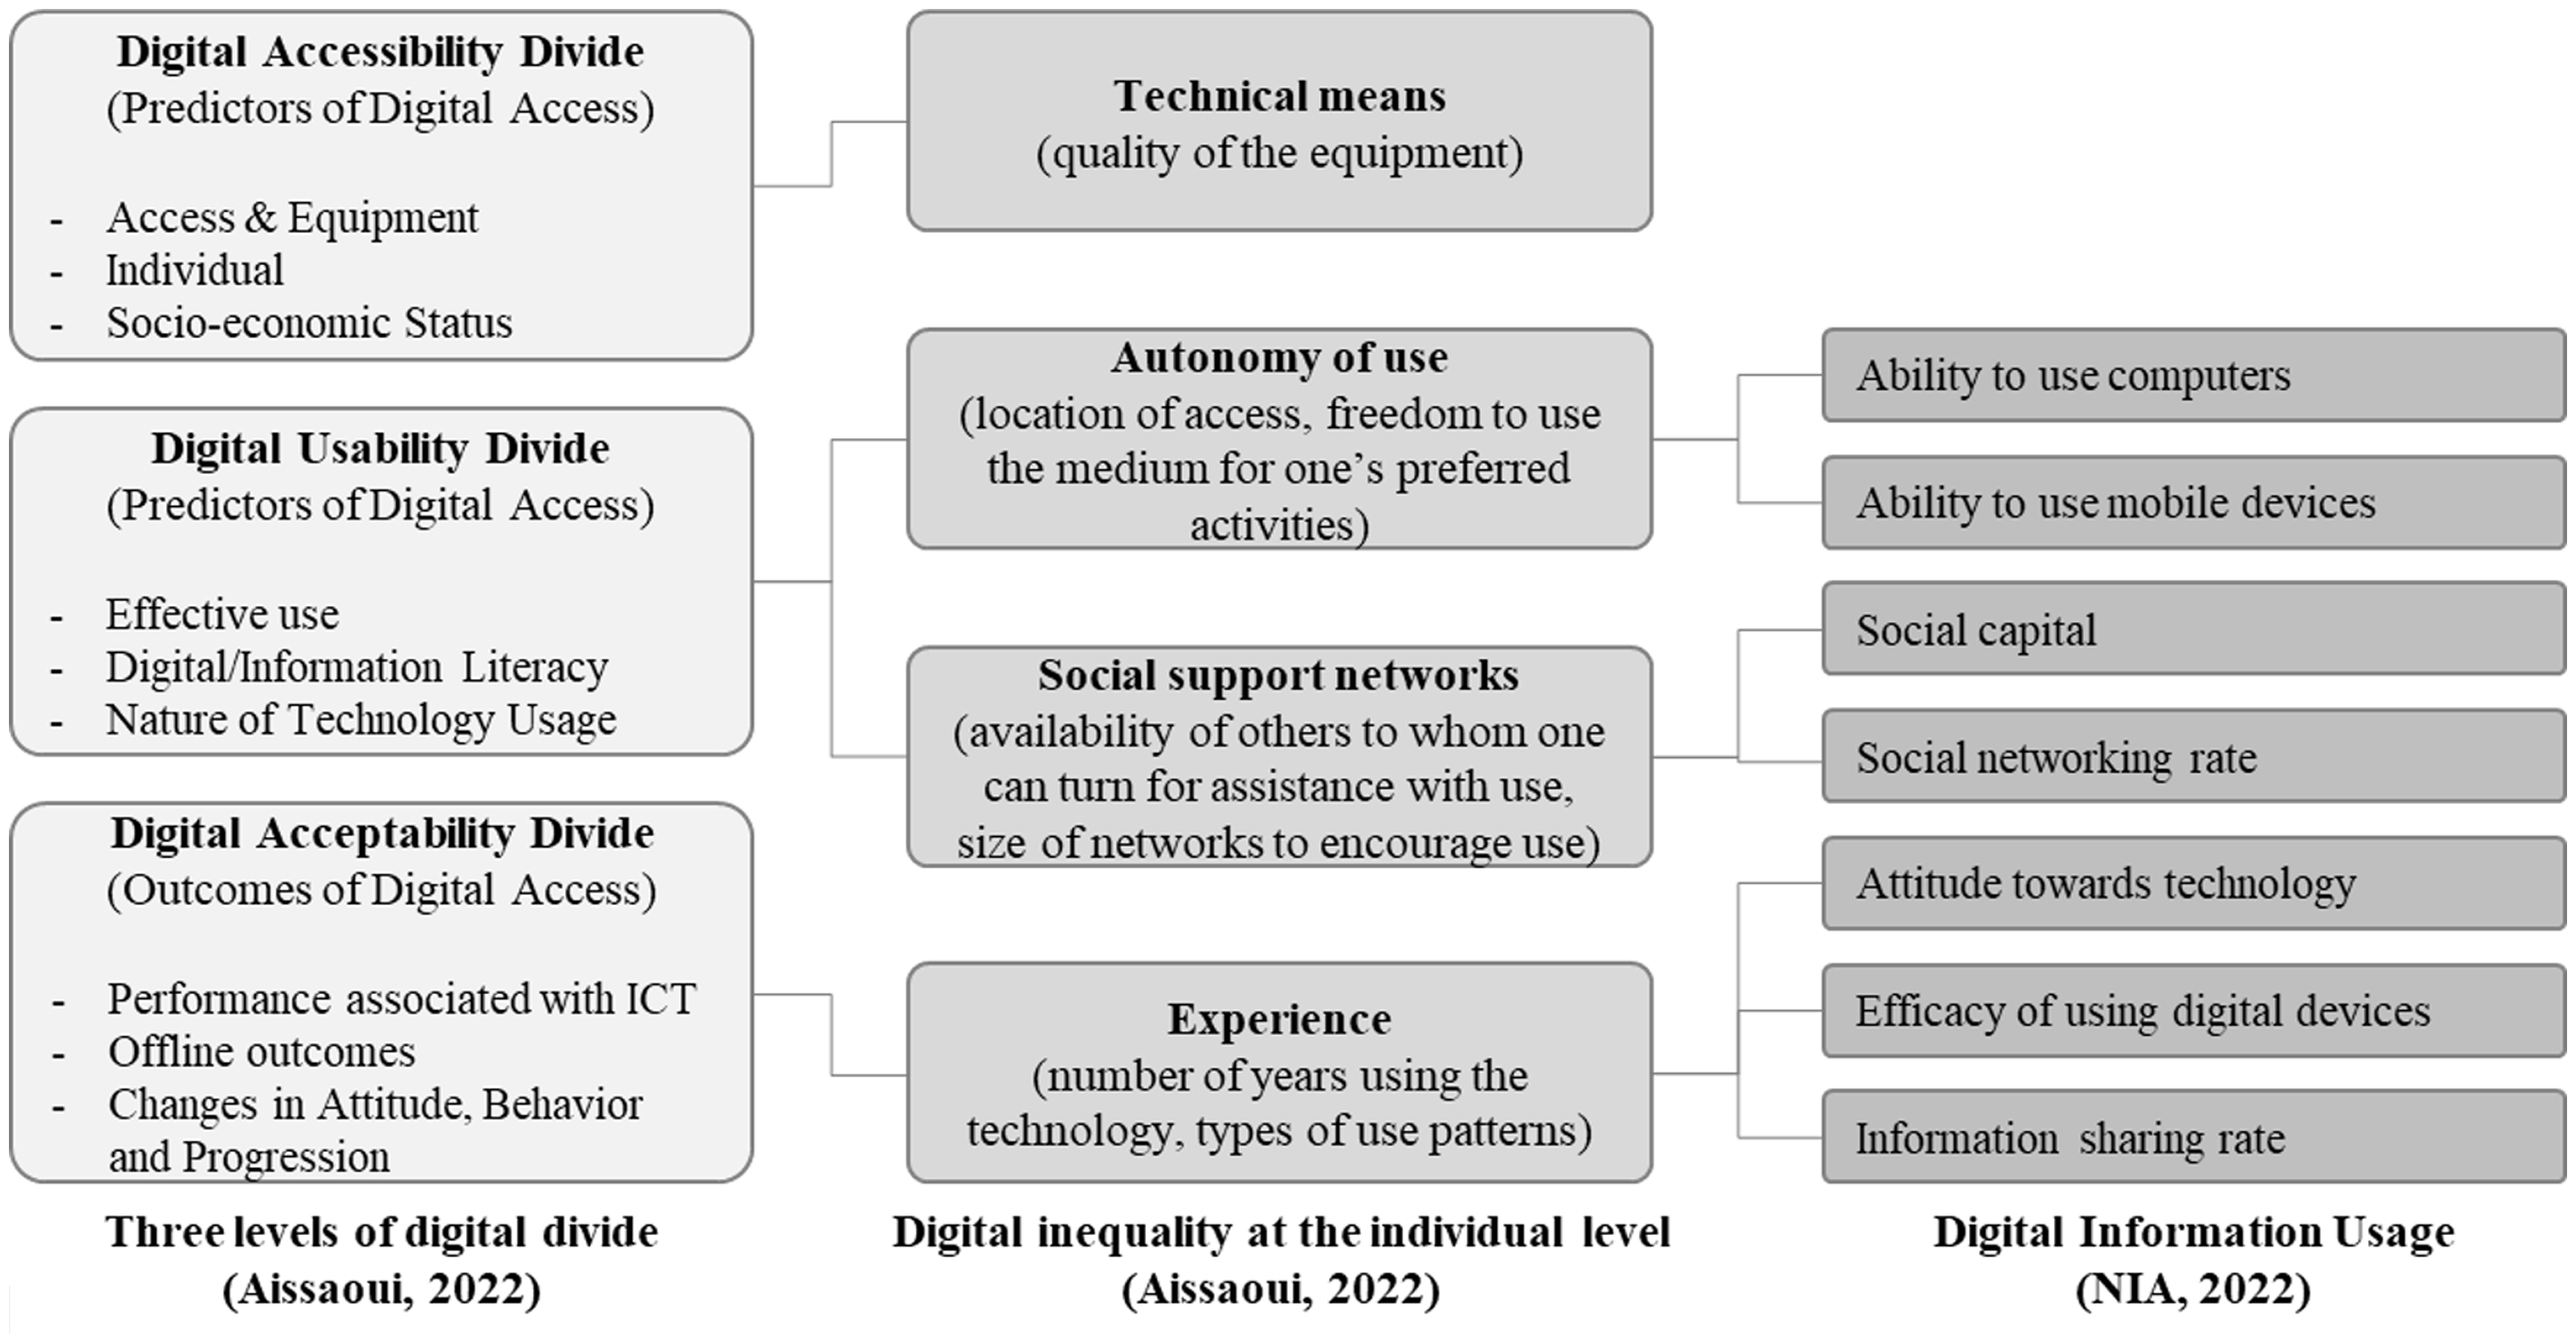
This study thus sought to integrate the three levels of the digital divide within the theoretical framework of RAT along with the four digital inequality factors proposed by Hargittai (Reference Hargittai2003), illustrating their applicability to the examined digital divide factors. Utilising data from the digital divide survey conducted by the National Information Society Agency (NIA), the study explored seven factors that influence the digital divide, drawing insights from the four phases related to access to and adoption of digital media. Fig. 2 presents the digital divide factors considered in this study, drawing from the four phases related to access to and adoption of digital media as outlined in RAT. These factors encompass technical means, autonomy of use, social support networks, and experience, providing a comprehensive framework for examining the digital divide in South Korea.
Digital divide factors (source: author).

The technical means component of the digital divide primarily focuses on accessibility, which is the first level of disparity. It encompasses the availability and quality of equipment that individuals can use to connect to the internet. According to RAT, unequal access to high-quality devices and internet connectivity can limit people’s ability to appropriate and benefit from digital resources, leading to disparities in accessibility (Ferreira et al., Reference Ferreira, Sá, Martins and Serpa2021). In the case of South Korea, where internet access and usage rates are high, the likelihood of digital inequality solely stemming from technical means is very low. Therefore, this study does not consider the first level of the digital divide, which pertains to technical means.
The autonomy of use component is associated with the second level of the digital divide, known as usability. This examines individuals’ freedom and ability to utilise digital technologies for their preferred activities. Usability, as emphasised by RAT, involves appropriating resources for personal activities. Factors such as ‘ability to use computers’ and ‘ability to use mobile devices’ reflect individuals’ technical skills and familiarity with digital devices. These factors are relevant to the accessibility and usability dimensions of the digital divide. Assessing individuals’ competence in using computers and mobile devices provides valuable insights into their ability to access and effectively utilise digital resources (Lutz, Reference Lutz2019; Van Deursen and Mossberger, Reference Van Deursen and Mossberger2018). Similar to the discussion in the preceding paragraph, autonomy of use also serves as a determinant in delineating latent profiles. Even when distinguishing between high and low levels of technical means and autonomy of use, four distinct profiles with different characteristics can be identified.
The social support network component is relevant to both the second and third levels of the digital divide – usability and acceptability. Social support networks play a crucial role in the context of the digital divide, as they can influence individuals’ access to resources, information, and emotional support (Choi and DiNitto, Reference Choi and DiNitto2013; Tsai et al., Reference Tsai, Shillair, Cotten, Winstead and Yost2015). In the digital age, online social networking activities have become an increasingly important aspect of social support networks, enabling individuals to establish and maintain social connections through digital platforms (Braun, Reference Braun2013; Yu et al., Reference Yu, Ndumu, Mon and Fan2018). Research has revealed that individuals with stronger social support networks, both offline and online, are better equipped to cope with the challenges posed by the digital divide (Helsper and van Deursen, Reference Helsper and van Deursen2017; Szreter and Woolcock, Reference Szreter and Woolcock2004).
The third level of the divide, acceptability, emphasises the social and cultural aspects of resource appropriation. ‘Social capital’ refers to the social connections and relationships that can support and assist individuals in using digital technologies. This factor also acknowledges the significance of social networks in addressing the digital divide and emphasises the role of interpersonal relationships in fostering digital inclusion (Chen, Reference Chen2013). Referred to as the ‘social networking rate’ factor, it focuses on the extent and breadth of individuals’ social networks in the digital domain. This factor investigates the online connections and interactions, which can impact their access to information and resources, as well as their involvement with digital platforms and services (Elena-Bucea et al., Reference Elena-Bucea, Cruz-Jesus, Oliveira and Coelho2021).
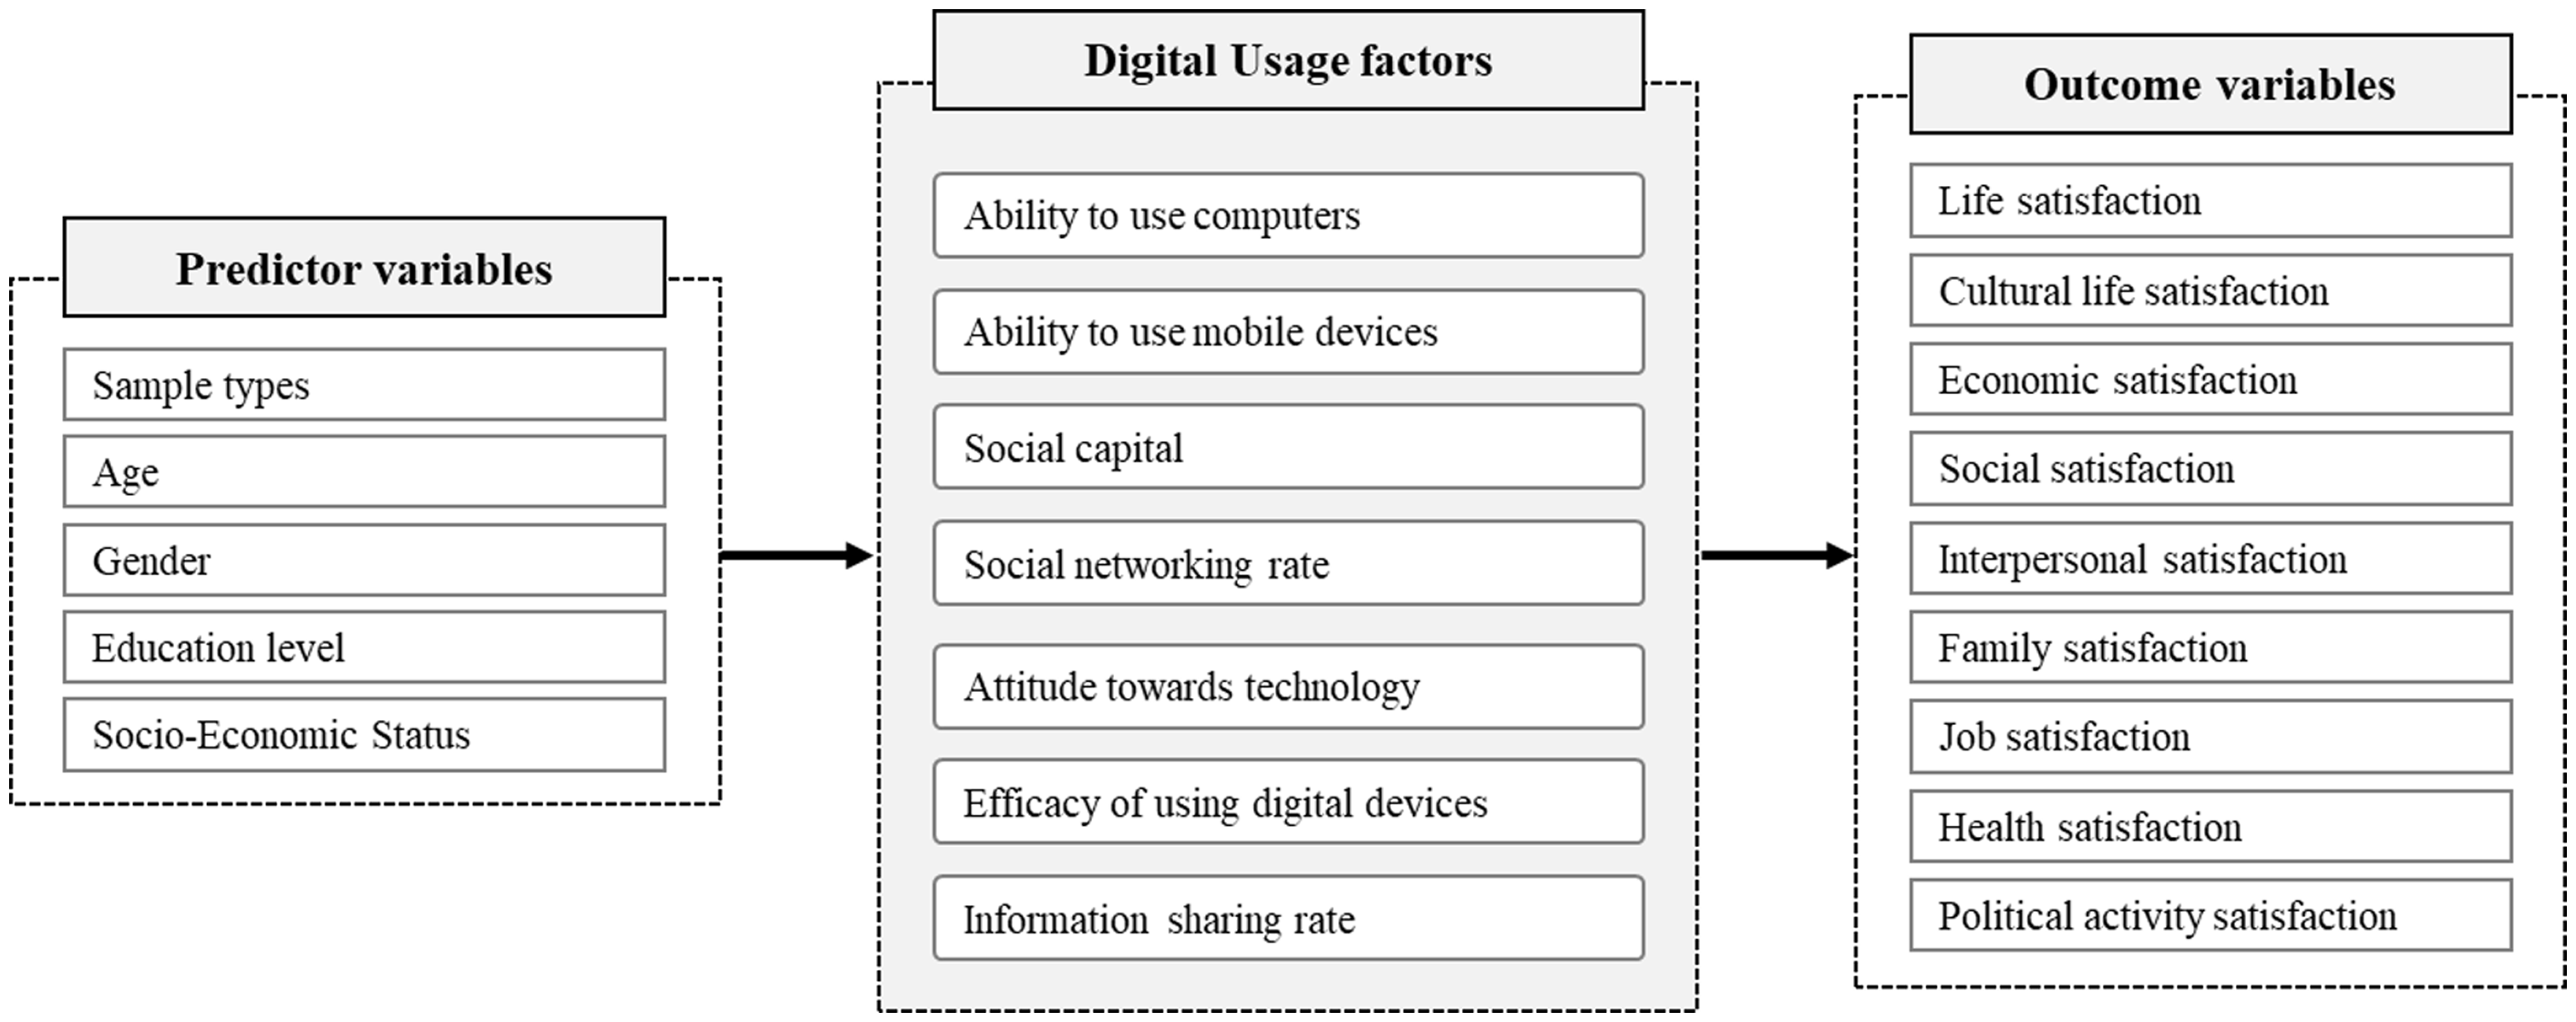
The experience component primarily pertains to the third level of the digital divide, acceptability. Experience with technology and diverse usage patterns can enhance individuals’ familiarity, comfort, and confidence in utilising digital resources. RAT suggests that individuals with more experience are better equipped to appropriate and benefit from digital resources, thus reducing disparities in acceptability (Fuchs, Reference Fuchs2009; Scheerder et al., Reference Scheerder, Van Deursen and Van Dijk2017). ‘Attitude towards technology’ reflects individuals’ attitudes, perceptions, and beliefs regarding digital technologies. Such attitudes shape individuals’ willingness to adopt and effectively use digital technologies. ‘Efficacy of using digital devices’ pertains to individuals’ perceived confidence and self-efficacy in using digital devices and technology. Higher efficacy indicates greater competence and mastery in using digital devices (Ma et al., Reference Ma, Chan and Teh2020). ‘Information sharing rate’ captures individuals’ involvement in creating and sharing digital content and information. This factor considers the extent to which individuals actively contribute to producing and sharing digital resources such as creating and publishing online content, participating in online communities and sharing information with others (Hoffmann and Lutz, Reference Hoffmann and Lutz2021). Thus, the researcher believed that the possibility of various combinations of factors influencing the digital divide would enrich the findings of this study. Figure 3 illustrates the research model, integrating the three levels of the digital divide within the theoretical framework of RAT and the four digital inequality factors proposed by Hargittai (Reference Hargittai2003). This model guides the exploration of the seven factors influencing the digital divide in South Korea.
Research model.

Three research questions were derived from the preceding discussion. RQ1 focused on identifying latent profiles among vulnerable groups affected by the digital divide, taking into account factors such as access, utilisation, and awareness of digital technology. By discerning these distinct groups, a more nuanced understanding of the digital divide was attained, revealing their specific characteristics. RQ2 explored the factors that influence the classification of latent profiles, encompassing demographic variables such as age, income, and education. Through these factors, valuable insights were gained regarding the likelihood of belonging to a particular profile. RQ3 investigated whether life satisfaction varies according to individuals’ latent profile as a component of the digital divide. Specifically, the study examined whether satisfaction with social, economic, and cultural aspects of life differs depending on the group identified by the combination of various elements of the digital divide. The specific research questions were as follows:
RQ1: How are latent profiles determined based on digital divide components?
RQ2: What are the factors that influence the classification of latent profiles and the probability of belonging to a specific profile based on the components of the digital divide?
RQ3: Does life satisfaction vary among individuals depending on their latent profile associated with the digital divide component?
Methods
Latent profile analysis (LPA) is one of the most commonly used methods within the person-centred approach. This approach, as described by Marsh et al. (Reference Marsh, Lüdtke, Trautwein and Morin2009), considers intra-individual variation across a set of variables. Unlike traditional variable-centred approaches that focus solely on the relationships among variables within the entire population, the person-centred approach seeks to identify and compare subgroups of individuals exhibiting similar patterns of variables within a population (Meyer et al., Reference Meyer, Stanley and Vandenberg2013). Consequently, LPA is well suited for investigating how components of the digital divide or focus combine, how these combinations are perceived, and how profiles with different combinations vary in terms of other variables.
Sample and data source
The data for this study were obtained from the Digital Divide Survey, which has been conducted on an annual basis by the National Information Society Agency (NIA) since 2002. Its primary objective is to examine the advances made in policies aimed at mitigating the digital divide through time-series analysis. Additionally, the survey aims to furnish policymakers with the essential data needed for informed and effective decision-making in this domain. The sample consisted of 7,000 participants selected from the general population. Among these, 2,300 were elderly citizens aged fifty-five and above. The remaining 2,200 participants were individuals belonging to various categories, including low-income individuals, people with disabilities, farmers, North Korean defectors, and marriage immigrants, with each group comprising 700 participants. For the purpose of this study, North Korean defectors and marriage immigrants were grouped together according to theoretical considerations. The analysis was conducted on a dataset comprising 15,085 records as of August 30, 2022.
Measures
The analysis employed three categories of measurement: autonomy of use, social support networks, and experience. Autonomy of use was assessed through an evaluation of the ability to use computers (seven items) and the ability to use mobile devices (seven items). Social support networks were evaluated according to social support (four items) and social networking rate (four items). Lastly, experience was evaluated through attitudes toward technology (four items), the efficacy of using digital devices (four items), and the information sharing rate (four items).
Drawing from previous research on LPA, demographic variables were used to identify five categories that could potentially influence the profiles. Thus, participant types were reorganised into six categories: general population, farmers and fishers, people with disabilities, low-income households, defectors and marriage immigrants, and the elderly. Age groups were divided into four categories: young adults aged nineteen to thirty-four (n = 3,507), middle-aged adults aged thirty-five to forty-nine (n = 3,390), older adults aged fifty to sixty-four (n = 5,249), and seniors aged sixty-five or older (n = 2,939). Gender was categorised as male (n = 7,740) and female (n = 7,345), while education level was categorised into five categories: elementary school or below (n = 1,493), middle school (n = 2,757), high school (n = 6,857), college (n = 3,675), and graduate school (n = 303). Finally, socio-economic status was measured using standardised scores based on monthly household income and educational level.
To identify differences in dependent variables across the identified latent profiles, a set of nine items was used, comprising one related to overall life satisfaction and eight related to satisfaction with different areas of daily life. These domains were further categorised as leisure and cultural life satisfaction, economic satisfaction, social activity satisfaction, interpersonal relationship satisfaction, family relationship satisfaction, job satisfaction, physical and mental health satisfaction, and political and government activity satisfaction.
Data analysis
To address Research Question 1, LPA was performed using Mplus software. The fit of the models with varying numbers of latent classes was assessed using several indices. These included information-based indices such as the Akaike Information Criterion (AIC; Akaike, Reference Akaike1974), the Bayesian Information Criterion (BIC; Schwarz, Reference Schwarz1978), and the sample-size-adjusted BIC (SABIC; Sclove, Reference Sclove1987). Classification quality was evaluated using entropy, with values ranging from one to zero. An entropy value of zero point seven or higher was considered appropriate (Clark, Reference Clark2010). Additionally, the Lo-Mendell-Rubin adjusted likelihood ratio test (LMR LRT; Lo et al., Reference Lo, Mendell and Rubin2001) and the bootstrapped likelihood ratio test (BLRT; McLachlan and Peel, Reference McLachlan and Peel2000) were utilised to determine the number of latent classes by comparing models with different class numbers.
To ensure theoretical relevance and interpretability, additional criteria were applied when determining the latent classes, drawing on insights from previous research (Muthén, 2002). Uncommon and rare groups were excluded as they are infrequent in the population. Latent classes that represented less than 5 per cent of the total sample or had fewer than twenty-five members were not considered distinct subgroups (Berlin et al., Reference Berlin, Williams and Parra2014; Jung and Wickrama, Reference Jung and Wickrama2008).
To address research questions two and three, the three-step approach was utilised. This approach accounts for the influence of covariates on the classification of latent profiles by incorporating auxiliary variables to control for these effects. R3STEP was employed to assess the predictive power of the covariates, while DU3STEP was used to examine differences in quality of life which served as the dependent variable of interest (Asparouhov and Muthén, Reference Asparouhov and Muthén2014). By employing these techniques, the study enhanced the accuracy and validity of the findings by considering relevant covariates and their impact on the latent profiles identified.
Results
LPA
LPA was conducted to determine the optimal number of latent profiles based on the seven digital literacy types. The optimal number was then selected by comparing different models using information criteria and entropy, which are relative indicators of the model’s goodness-of-fit.
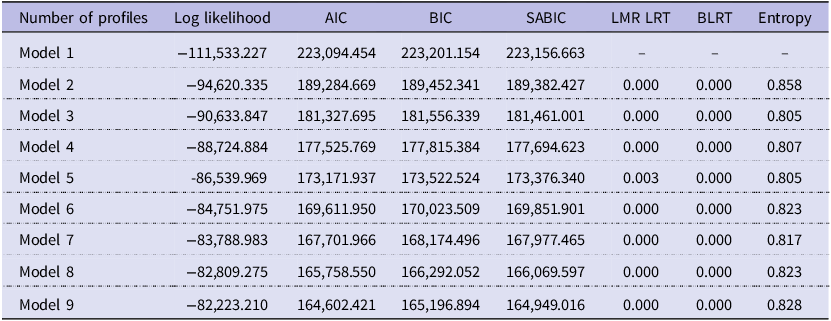
RQ 1 aimed to differentiate latent groups based on their digital literacy. To this end, a model was employed that excluded auxiliary variables in order to classify latent groups according to seven digital literacy indicators. The optimal number of profiles was determined by gradually increasing the number of latent groups. The results, as presented in Table 1, reveal that increasing the number of profiles led to reduced values for AIC, BIC, and SABIC, and that the entropy values moved closer to one, indicating higher classification accuracy. Consequently, all nine groups could be accurately classified.
Comparison of model fit indices according to the number of latent profiles

Table 1 Long description
A table with nine rows and nine columns comparing model fit indices across different numbers of latent profiles. The columns are Number of profiles, Log likelihood, AIC, BIC, SABIC, LMR LRT, BLRT, and Entropy. The rows are labeled Model 1 through Model 9. Each row provides values for each column, indicating the fit indices for the respective model. Notable trends include decreasing values for AIC, BIC, and SABIC as the number of profiles increases, and entropy values moving closer to one, indicating higher classification accuracy.
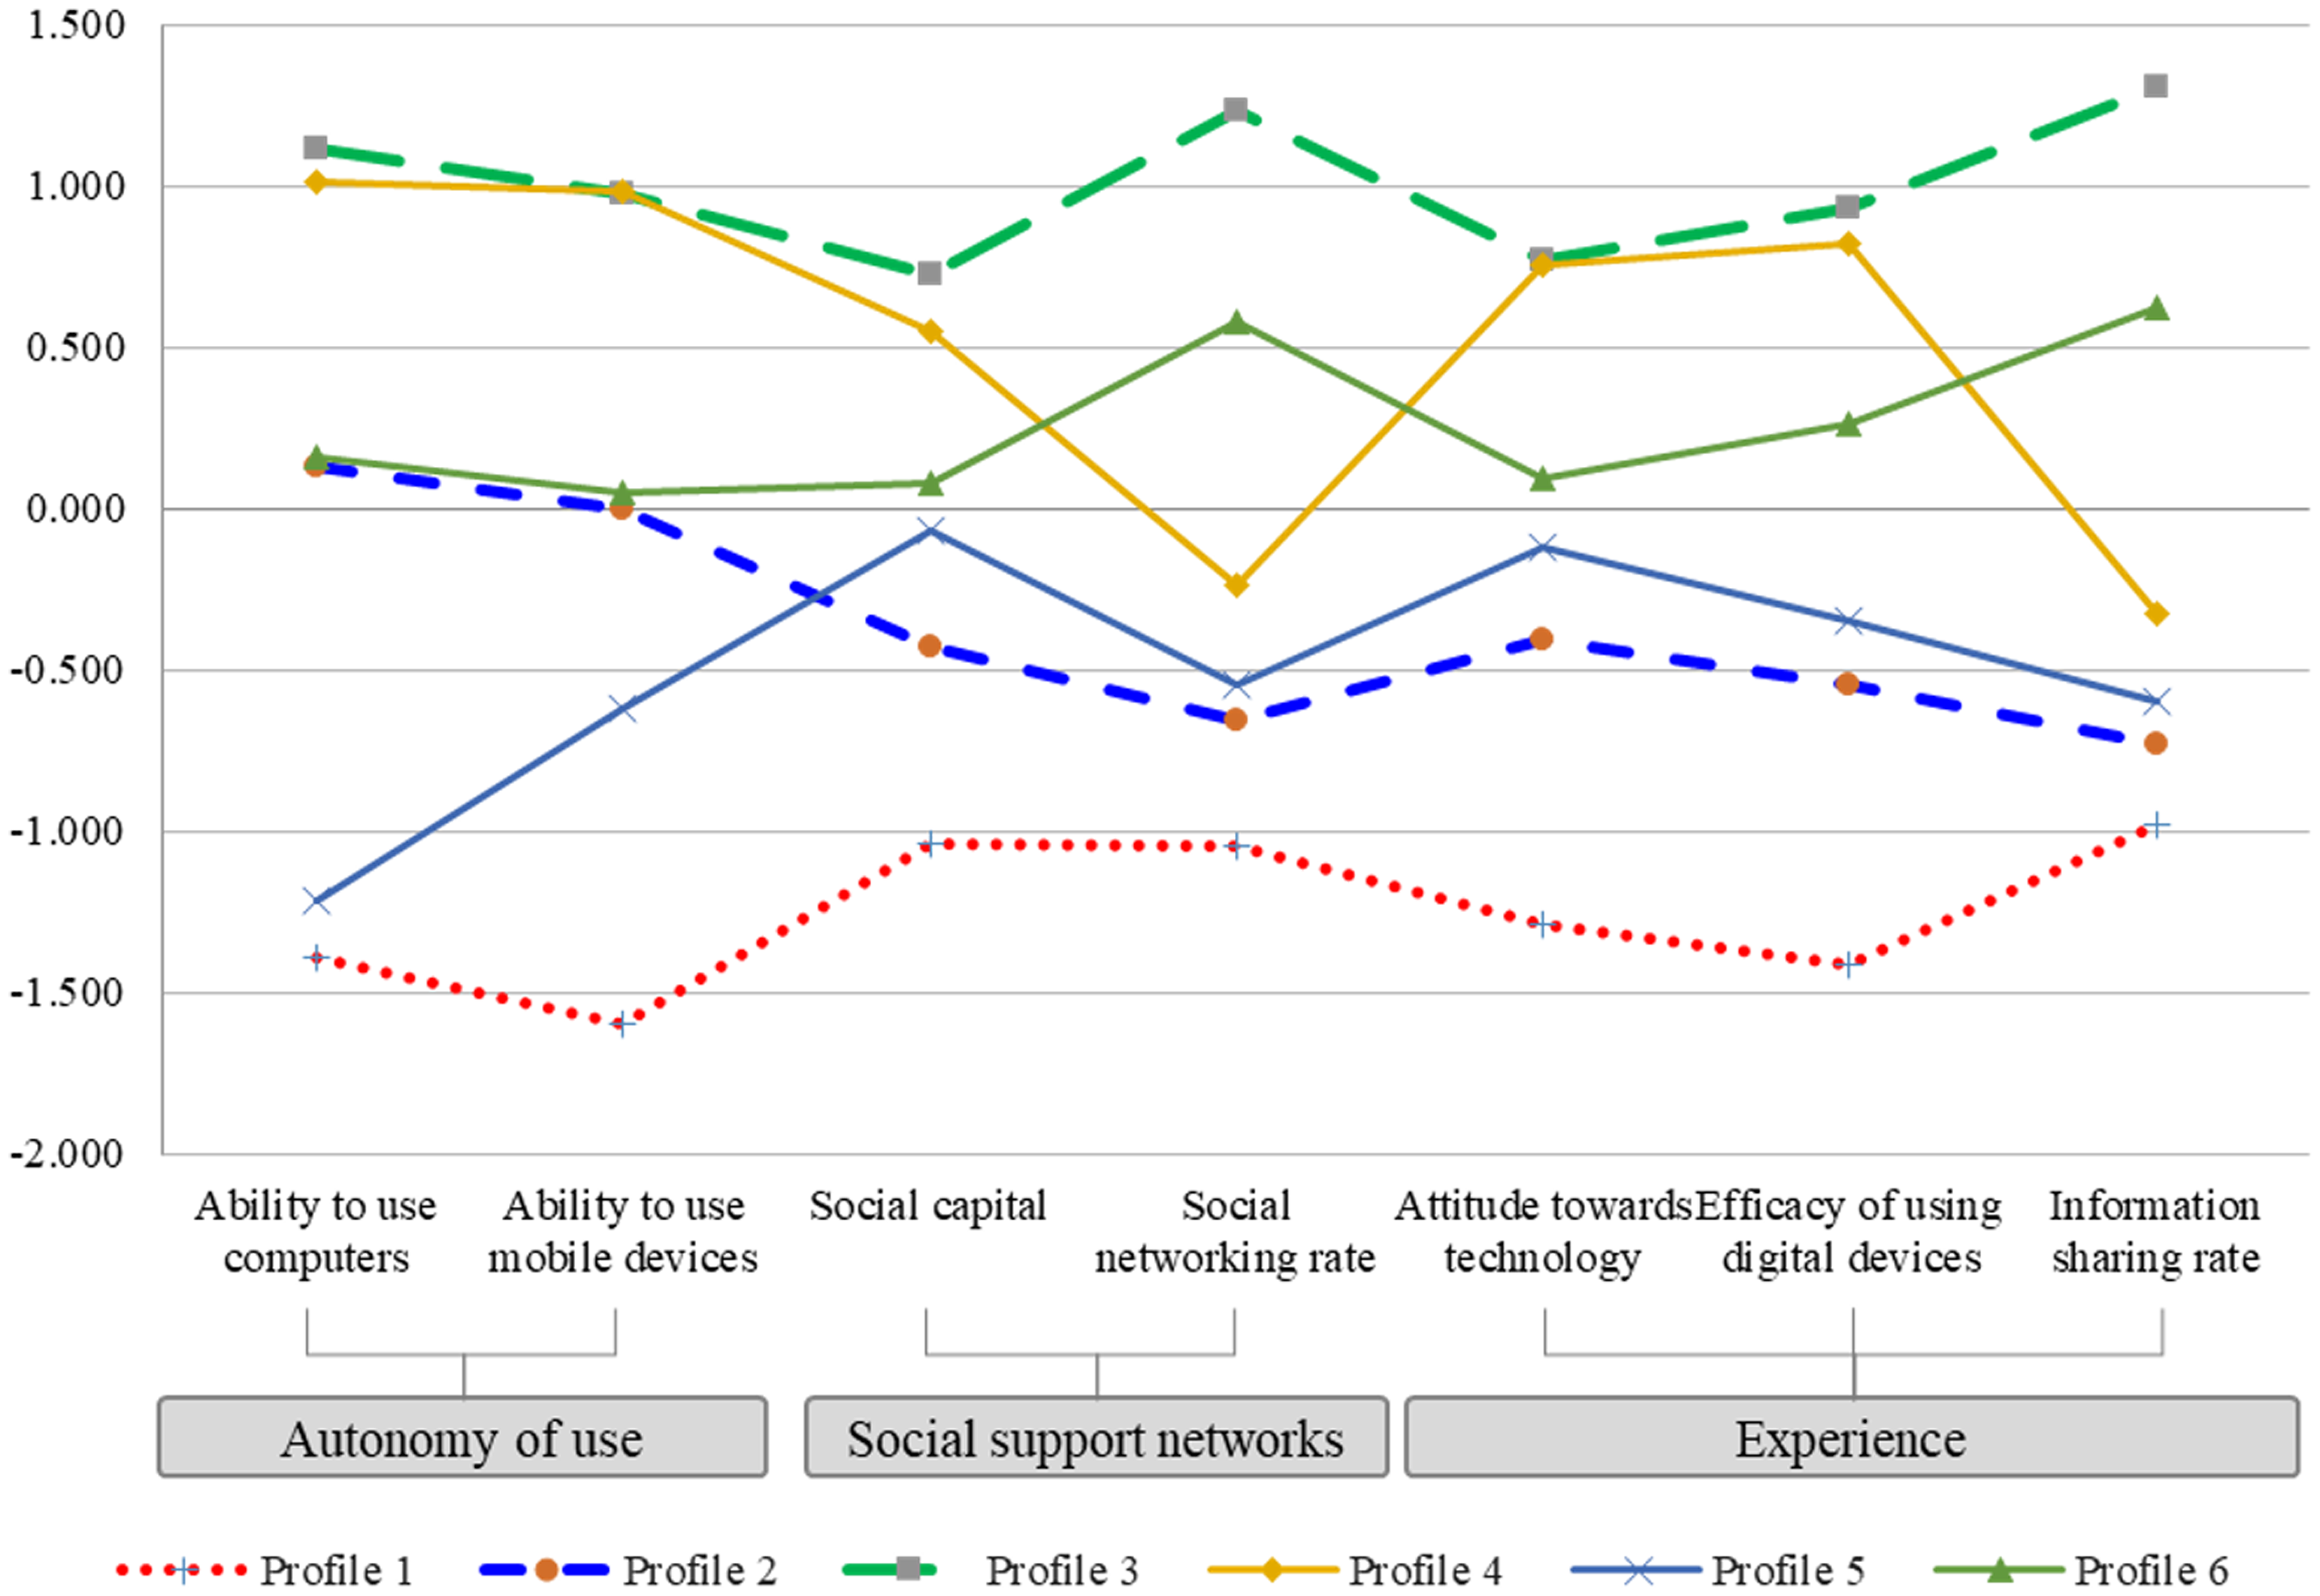
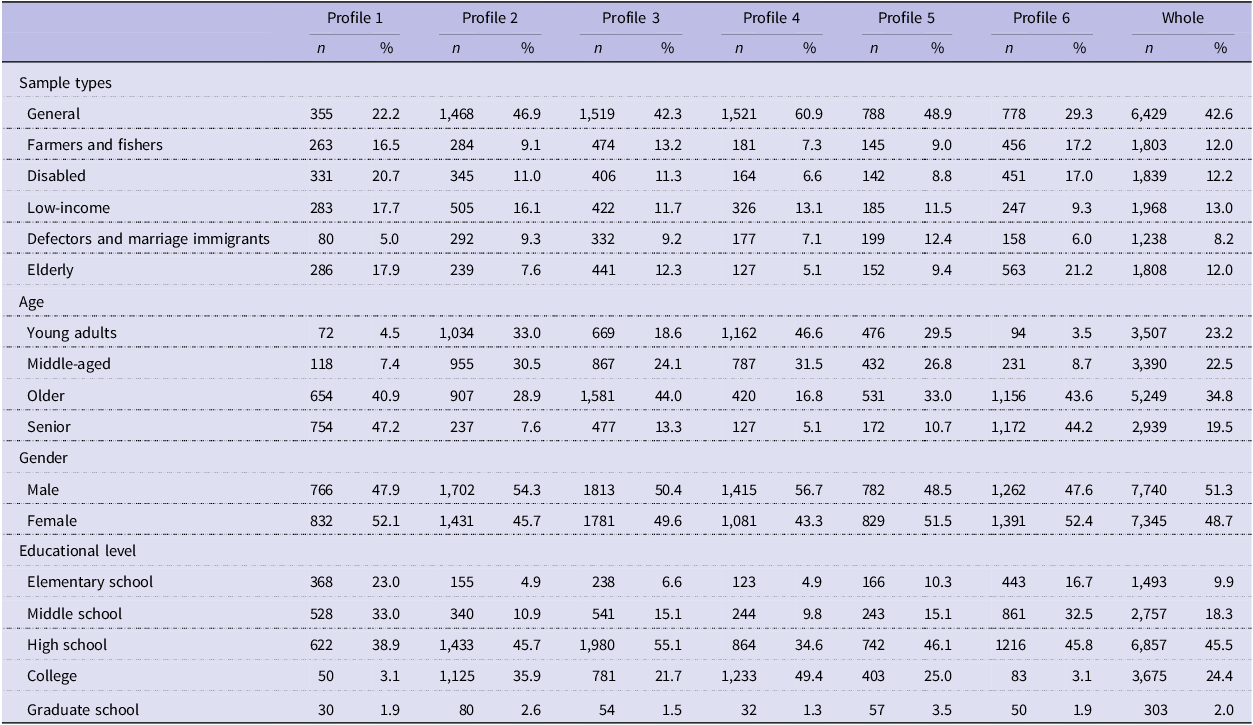
Upon examining the classified groups, it was observed that increasing the number of profiles to nine resulted in one group comprising only 541 samples (3.59 per cent). Previous studies suggest that when a profile’s composition ratio is below 5 per cent or the group size falls below twenty- five, too many profiles may be extracted (Hipp and Bauer, Reference Hipp and Bauer2006). Therefore, models corresponding to classified groups with a proportion of less than 5 per cent were not selected. As a result, the final model selected was Model 6 which was divided into six latent profiles. Figure 4 illustrates the distribution of digital divide scores for the six latent profiles identified through the LPA. These profiles reveal distinct patterns of digital divide factors among the South Korean population. Table 2 provides the demographic information for the sample and individual profiles. The distribution of participants across different categories, such as sample types, age, gender, and educational level, is presented for each latent profile and the overall sample.
Distribution of digital divide scores for the six latent profiles.

Demographic information for sample and individual profiles

Table 2 Long description
A table with 10 rows and 13 columns, detailing demographic information for different profiles and the whole sample. The columns are labeled as Profile 1, Profile 2, Profile 3, Profile 4, Profile 5, Profile 6, and Whole, each with sub-columns for n and percent. The rows are grouped into categories: Sample types, Age, and Gender. Sample types include General, Farmers and fishers, Disabled, Low-income, Defectors and marriage immigrants, and Elderly. Age categories are Young adults, Middle-aged, Older, and Senior. Gender categories are Male and Female. Each cell contains numerical values representing the count (n) and percentage (%) of participants in each category for the respective profiles and the whole sample.
Profile 1, identified as a group vulnerable to information disparity, exhibited lower levels on all seven indicators of information disparity compared with other groups. Specifically, they displayed significantly lower levels of ability to use PCs and mobile devices and lower levels of digital device usage efficacy and attitudes. This group comprised 1,598 respondents, representing approximately 10.6 per cent of the total sample.
Profile 2, identified as a group vulnerable to technology acceptance attitudes and efficacy, displayed intermediate levels of ability in using PCs and mobile devices. However, they exhibited relatively lower levels of information production and sharing, networking and social capital perception than other groups. This group comprised 3,133 respondents, accounting for approximately 20.8 per cent of the total sample.
Profile 3, identified as a high-level group, exhibited higher levels on all seven indicators compared with other groups, thereby contrasting with Profile 1. This group had the highest number of respondents, 3,594, accounting for approximately 23.8 per cent of the total sample.
Profile 4, identified as a group vulnerable to information production, sharing and networking, demonstrated excellent abilities in using PCs and mobile devices. However, they exhibited relatively lower levels of information production and sharing, as well as networking, compared with other groups. Despite their technical utilisation abilities, this group displayed limited engagement in social support network activities, unlike Profile 3. This group comprised 2,496 respondents, accounting for approximately 16.5 per cent of the total sample.
Profile 5, identified as a group vulnerable to digital device usage ability, exhibited lower levels of proficiency in using PCs and mobile devices than other groups despite having positive attitudes toward technology and social capital. They also experienced information disparity due to their limited ability to use digital devices. This group included 1,611 respondents, accounting for approximately 10.7 per cent of the total sample.
Profile 6, identified as an intermediate-level group overall, exhibited a similar pattern to Profile 3, albeit with slightly lower levels. This group included 2,653 respondents, accounting for approximately 17.6 per cent of the total sample.
Multinomial logistic regression
RQ 2 entailed analysing the factors influencing digital literacy and determining the probability of belonging to a specific group. To achieve this, a multinomial logistic regression analysis was conducted using the R3STEP option in Mplus. The factors influencing group differentiation were classified into five categories, and odds ratios (subject type, age group, gender, education level, and SES) were calculated to explain the probability of belonging to a certain group. The signs of the coefficients were examined to compare the reference group with the comparison groups and determine which group had a higher probability of belonging. Statistical significance was assessed using p-values.
In this study, the participants were categorised into six groups: general population, farmers, people with disabilities, low-income individuals, North Korean defectors and marriage immigrants, and the elderly. Analysis of these groups revealed consistent patterns across latent profiles. Among the statistically significant cases, the general population had the lowest probability of belonging to Profile 1, with Profile 4 as the reference (b = 0.665, p = .000). The probabilities of belonging to Profile 5 (b = −0.473, p = .115) and Profile 6 (b = 0.071, p = .746) were not statistically significant. Similar patterns were observed for farmers, with the probability of belonging to Profile 5 (b = 0.587, p = .031) and Profile 6 (b = 0.851, p = .115) being significantly higher than that of belonging to Profile 4. People with disabilities exhibited a higher probability of belonging to Profile 2 than Profile 1 (b = 1.953, p = .000). This pattern was also observed when comparing Profile 2 and Profile 4 (b = −1.864, p = .000), indicating vulnerability in terms of technology acceptance attitudes and efficacy. Low-income individuals had a higher probability of belonging to latent group 5 than Profile 1 (b = 1.340, p = .000), indicating weaker digital device usage skills. However, the probabilities of belonging to Profile 2 (b = 1.984, p = .000), Profile 3 (b = 1.957, p = .000) and Profile 6 (b = 1.243, p = .000) were higher than that of belonging to Profile 5. North Korean defectors and marriage immigrants had a lower probability of belonging to Profile 5 (b = −2.805, p = .000) and Profile 6 (b = −2.984, p = .000) than Profile 2, indicating a higher likelihood of being in the information-disadvantaged group.
Secondly, regarding age, participants were classified into four categories: young adults, middle-aged, older, and senior. Using these categories as a reference, comparisons were made between the probability of belonging to each latent group. Overall, senior adults had a higher probability of belonging to the information-disadvantaged group. When comparing Profile 2 and Profile 6, the youth and middle-aged groups had a higher probability of belonging to Profile 6 (b = 3.293, p = .000, b = 1.225, p=.000), while the older and senior groups had a higher probability of belonging to Profile 2 (b = −0.543, p = .000, b = −0.021, p = .000). Therefore, as age increases, there is a higher likelihood of increased vulnerability in terms of device usage skills and self-efficacy.
Thirdly, the participants were also categorised by gender. When comparing the probability of belonging to Profile 4 with Profile 1 for women, only the probability of belonging to this group was not statistically significant (b = −0.048, p = .576). Comparing Profile 3 and Profile 4 revealed a higher probability of belonging to the group vulnerable in information production, sharing, and networking than the high-level group (b = −0.648, p = .000). Comparing Profile 3 and Profile 6 indicated a higher probability of belonging to the high-level group than the intermediate-level group. When comparing Profile 4 and Profile 5, the probability of belonging to Profile 4 was relatively high (b =−0.825, p = .000), suggesting vulnerability in terms of information production, sharing, and networks.
Fourthly, educational level was classified into five categories: elementary school or less, middle school, high school, college, and graduate school. In most cases, the probability of belonging to a specific latent profile was not statistically significant. However, those with a graduate degree had a higher probability of belonging to Profile 4 than Profile 2 (b = 0.233, p = .000), while the rest displayed a higher probability of belonging to Profile 2. Additionally, those with a college education level had a significantly higher probability of belonging to Profile 6 than Profile 3 (b = 1.198, p = .008).
Finally, SES was assessed using standardised scores for income level and education. The probability of belonging to Profile 2 was higher than that of belonging to Profile 1 (b = 0.711, p = .000), while the comparison between Profile 2 and Profile 4 was not statistically significant (b = −0.082, p = .113). A comparison of Profile 3 and Profile 4 revealed a higher probability of belonging to Profile 3 (b = -0.338, p = .000), suggesting a higher likelihood of belonging to an overall high-level group based on socio-economic status. Furthermore, when comparing Profile 4 and Profile 6, the probability of belonging to Profile 6 was higher (b = 0.556, p = .000), indicating a higher likelihood of belonging to an overall intermediate-level group rather than a group with limited digital device usage skills.
Analysis of variance
To answer RQ 3, variations in life satisfaction and satisfaction with different domains of daily life were examined across the latent groups identified on the basis of digital literacy types. TheDU3STEP option in Mplus was used to perform ANOVA and explore the differences in satisfaction levels across the identified profiles. The findings consistently demonstrated a distinct pattern in life satisfaction scores which were measured on a 9-point scale, among the latent profiles.
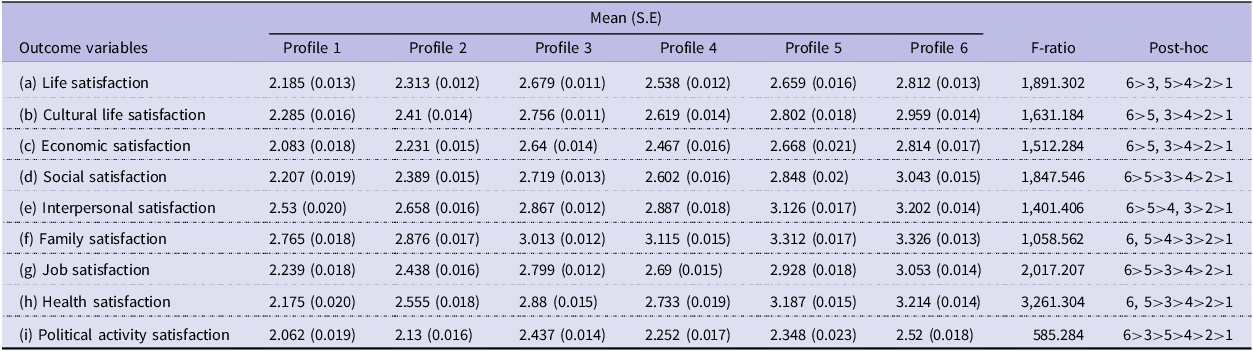
As shown in Table 3, individuals belonging to Profile 6 exhibited the highest satisfaction levels with (a) life. Profile 3 and Profile 5 followed closely behind, with no statistically significant difference in their average scores. Profile 4 had higher satisfaction levels, followed by Profile 2. The lowest levels of satisfaction were observed among individuals in Profile 1.
The result of mean differences of satisfaction level by latent profiles

Table 3 Long description
A table comparing satisfaction levels across different profiles. The table has 9 rows and 10 columns. The rows are labeled with outcome variables such as life satisfaction, cultural life satisfaction, economic satisfaction, social satisfaction, interpersonal satisfaction, family satisfaction, job satisfaction, health satisfaction, and political activity satisfaction. The columns are labeled with profiles 1 to 6, F-ratio, and Post-hoc. Each cell contains mean values with standard errors in parentheses. Notable trends include Profile 6 generally having the highest satisfaction levels across most variables, while Profile 1 often has the lowest.
Similar patterns were observed in terms of satisfaction with (b) cultural life, (c) economic status, and (h) mental and physical health across all groups. Profile 6 had the highest average scores, with no statistically significant difference between Profile 3 and Profile 5. Profile 4 and Profile 2 also had higher satisfaction scores, while Profile 1 had the lowest scores in these domains.
Satisfaction with (d) social activities and (g) jobs was highest among individuals in Profile 6, followed by Profile 5, 3, 4, 2, and 1 in descending order, with statistically significant differences in means. Similar to life satisfaction, each group exhibited a distinct pattern, with all mean differences being statistically significant when comparing each latent class.
Satisfaction with (e) interpersonal relationships and (f) family relationships followed a similar pattern to social activities, with the highest scores observed among individuals in Profile 6 and the lowest among those in Profile 1. However, there were differences in that the mean difference between Profile 4 and Profile 3 was not statistically significant for satisfaction with interpersonal relationships, and the mean difference between Profile 6 and Profile 5 was not statistically significant for satisfaction with family relationships.
Satisfaction with (i) politics and government activities exhibited the highest scores in Profile 6, with a notable difference between Profile 3 and Profile 5. Profile 4 and Profile 2 displayed lower satisfaction scores, while Profile 1 had the lowest satisfaction scores across all domains.
Discussion
Findings and academic implications
The primary aim of this study was to utilise LPA as a person-centred approach to identify latent groups within the Korean population based on factors contributing to information inequality. Additionally, the study sought to investigate the antecedents that influence these identified groups and explore potential differences in life satisfaction among them. The findings contribute to the growing body of literature on the digital divide in Asia, complementing research on digital technology practices (Tahira, Reference Tahira2022), financial and digital literacy (Dura, Reference Dura2022), and online political participation (Danowski and Park, Reference Danowski and Park2020) in the region. By situating the digital divide in South Korea within the broader Asian context, this study highlights the importance of addressing digital inequalities to promote inclusive social and economic development in the post-pandemic era. The key findings can be summarised as follows.
Firstly, the application of LPA provides valuable academic insights by confirming the complex interplay of various factors that contribute to the digital divide. The latent groups identified in the study were categorised into six distinct profiles based on factors such as digital device literacy, social capital (e.g., networking ability), and digital self-efficacy. This finding aligns with previous research that recognises the evolution of the digital divide to encompass access, usage, and outcomes of ICT in a more nuanced and multifaceted definition (Shakina et al., Reference Shakina, Parshakov and Alsufiev2021). The digital divide is now understood as a dynamic and multidimensional phenomenon influenced by a range of factors (Bruno et al., Reference Bruno, Esposito, Genovese and Gwebu2011). Furthermore, the study reveals that the divide manifests in different forms that determine equality within the digital realm (Kolb et al., Reference Kolb, Dery, Huysman and Metiu2020). It is also important to note that the divide can arise from a combination of factors, challenging the notion of fixed categories, thereby opening avenues for expanding our understanding of this subject (Lythreatis et al., Reference Lythreatis, Singh and El-Kassar2022).
Secondly, it was found that various factors, including age, gender, and education, influenced the likelihood of belonging to a specific latent group. Merely examining the forms and levels of the digital divide is insufficient; it is crucial to delve into the underlying factors contributing to these disparities.
The results have significant academic implications in terms of enhancing our understanding of how the digital divide unfolds, benefiting those working towards addressing the divide and striving for equitable digital opportunities in society (Lythreatis et al., Reference Lythreatis, Singh and El-Kassar2022). Previous research reviews have identified several factors, including sociodemographic, socio-economic, and personal elements, as well as social support, technology type, digital training, rights, infrastructure, and large-scale events that impact the digital divide. In this study, sociodemographic elements such as age, race/ethnicity, gender, population density, geographic disparity, urbanisation, urban/rural divide, remoteness, and country size were identified as influential factors (Lythreatis et al., Reference Lythreatis, Singh and El-Kassar2022; Scheerder et al., Reference Scheerder, Van Deursen and Van Dijk2017). Among these, age was conspicuous as a significant contributor to digital inequality (Lythreatis et al., Reference Lythreatis, Singh and El-Kassar2022). The findings suggest that older individuals with well-connected social networks experienced greater benefits from online communication than those without such networks (Lythreatis et al., Reference Lythreatis, Singh and El-Kassar2022). Additionally, Álvarez-Dardet et al. (Reference Álvarez-Dardet, Lara and Pérez-Padilla2020) highlighted significant heterogeneity in ICT adoption among the older adult population. Therefore, it is crucial to acknowledge the vulnerability of middle-aged individuals within Korean society to the digital divide, as they represent a demographic group that may lack the necessary digital education and social support networks to address their digital needs.
Thirdly, the significance of this study lies in its identification of latent groups classified according to various types of digital divide and its multidimensional analysis of various aspects pertaining to life satisfaction. Overall, six distinct latent groups differentiated by various manifestations of the digital divide exhibited significant mean differences across various satisfaction aspects, including overall life, leisure, economy, social activity, interpersonal relationships, and work. The widespread adoption of the internet in Korea has sparked sociocultural transformations, prompting us to question the extent to which digital technology has truly enhanced our quality of life. At a broader level, the formation and nurturing of social connections facilitated by the internet and information communication technology can be perceived as exerting both positive and negative impacts on life satisfaction, encompassing personal emotional stability and happiness. Previous studies have explored the potential differences in life satisfaction based on specific targets, generations, or regions such as the relationship between information utilisation disparities among people with disabilities and life satisfaction (Hwang, Reference Hwang2019) or the relationship between socio-economic status, the digital divide and life satisfaction (Koh, Reference Koh2017). While previous studies have provided value by arbitrarily dividing groups depending on specific targets such as age, disability status, and the like, there is merit in discussing concrete group characteristics specific to the target population. This study, however, contributes valuable insights by employing a person-centred approach to identify latent groups characterised by factors such as age, disability, income, and education, and by demonstrating differences in life satisfaction across these groups. Moreover, the findings underscore the significance of considering the political context when addressing the digital divide in South Korea. As discussed by Yun (Reference Yun2023), the nature of political governance plays a crucial role in shaping social policies. Policymakers should therefore consider the political landscape when designing and implementing initiatives to bridge the digital divide and promote digital inclusion.
Practical implications
This study has a number of practical implications. Firstly, it can serve as fundamental data for policy development to address the digital divide. Recognising its significance for democratic development, the study highlights the importance of realising the benefits of ICT as a universal service. Government bodies and civil society need to go beyond physical, digital device accessibility and focus instead on individuals’ ability to access diverse information and effectively utilise digital content. In this regard, the study aids in mitigating bias in policies aimed at reducing information disparities by demonstrating that various factors affect the digital divide such as information access, technological proficiency, attitudes toward technology, and social capital.
This study’s second practical implication lies in identifying vulnerable groups facing limited information access and poor digital device utilisation skills. These findings provide a direction for developing policies that support the inclusion and empowerment of these marginalised individuals. When formulating policies to bridge the digital divide in Korea, the characteristics of the latent groups identified in this study can be considered. For instance, based on the characteristics of Profile 1 and Profile 5, which correspond to Level 2 of the digital divide, policy initiatives could focus on implementing comprehensive national-level education programmes to enhance PC and mobile device usage skills, eliminate blind spots and foster self-sufficiency in technology utilisation. Efforts should be made to support individuals in acquiring the necessary digital skills to bridge the Level 2 digital divide. Regarding the characteristics of profiles 2, 3, 4, and 6, corresponding to Level 3 of the digital divide, policies can be further refined in the following areas. Firstly, emphasis should be placed on improving attitudes towards information utilisation, moving beyond device usage skills to foster effective information utilisation habits. Secondly, recognising the importance of competence in device usage, attention should be paid to addressing gaps in information production, sharing, and networking skills. Finally, policies to promote effective information utilisation should be strengthened.
Tailored support measures should be implemented by policymakers, taking into consideration the specific vulnerabilities of each group. Given the unique challenges different profiles face, comprehensive policies will serve to effectively narrow the digital divide. Additionally, proactively identifying and addressing emerging digital divides at Level 3 is crucial. Policy efforts should extend beyond educational institutions to encompass businesses and industries, emphasising the importance of information utilisation in various contexts. Collaboration between the public and private sectors is crucial to ensuring comprehensive support and bridging the digital divide across different domains.
Limitations and directions for future research
Paving the way for future research, this study also has numerous limitations that need to be addressed. Firstly, it relied on a secondary data set provided by the National Information Society Agency (NIA). While the use of a nationally representative sample from a government-affiliated agency is a strength of this research, the specific items used to measure social support networks, including the social networking rate, were predetermined by the NIA surveys. This limited the ability of the research to provide detailed information on the precise nature of these items. Nevertheless, efforts were made to clearly define the concept of social support networks and their relevance to the digital divide based on the available data and existing literature.
A second limitation is the exclusion of physical location as a contributing factor to the digital divide. In South Korea, residents of Seoul, the capital city, have greater internet reliance due to extensive technological systems not being as prevalent in other cities or rural areas. This technological advancement sets Seoul apart. Conversely, individuals in other urban areas may not acquire new technical skills as quickly as those in Seoul, while rural residents face challenges such as limited internet access (Hwang, Reference Hwang2004). Further research is needed to explore the role of physical characteristics in driving digital information inequality.
Another limitation concerns the analysis of digital inequality among people with disabilities. Although the study included individuals with disabilities, it did not analyse the specific types and severities of these. It is important to recognise that disabilities can both hinder and benefit ICT use. Future research should focus on identifying factors that predict internet use among people with disabilities and comparing Korea’s situation with other economically transformed countries. This will provide valuable insights into addressing the digital gap and effectively utilising information technology.
Building upon the work of Park (Reference Park2002), future research could explore further the early stages of the digital divide in South Korea. By examining the historical context and the factors that contributed to the closing and widening divides in the 1990s, researchers will gain valuable insights into the long-term dynamics of digital inequality in the country. This historical perspective can inform current policy discussions and help identify strategies for addressing the persistent challenges of the digital divide.
While this study has, to some extent, addressed regional disparities in technological advancements within South Korea, there remain several other areas that future research could explore. For instance, the current study relied on broad regional categories (Seoul, other urban areas, and non-urban areas) to examine the digital divide. Future studies could delve more deeply into the nuances of these regional disparities by considering more specific geographical contexts such as differences between specific cities or provinces.
Additionally, future research could investigate the underlying factors that contribute to regional disparities in technological advancements such as socio-economic conditions, local policies and cultural attitudes towards technology. Through an understanding of these factors, researchers and policymakers will be able to develop better targeted and more effective interventions to address the digital divide across different regions of South Korea.