The economic and societal context
The history of horses and their use is strongly marked by extrinsic elements. Several major upheavals within the horse industry have been the result of widespread economic and social changes, including, for instance, the rise of petrochemicals allowing for the motorisation of agriculture and transport, at the expense of animal traction (Rossier et al., Reference Rossier, Coleou and Blanc1984). Although economic and social change may still play a role in years to come, other elements may have an impact on the horse industry over the next 20 years. This includes, for example, the growing world population, heightening concerns about natural resource availability for energy and food production, climate change and fluctuating harvest yields. According to the United Nations, the world population is now close to 7 billion and is expected to total between 7.8 and 8.8 billion in 20 years’ time. France's population during the same period is estimated to grow by 3 to 8 million. Growth will inevitably be attended by a steep increase in global food demand, which could result in strong pressure on farmland (Paillard et al., Reference Paillard, Dorin and Treyer2011), as well as an increase in the price of grain that could adversely affect the horse industry.
Apart from these global trends, the panel considered France's economic growth prospects over the next 20 years, because they constitute a source of uncertainty with regard to the future use of horses. The study's investigation of factors potentially influencing the future of the French horse industry also revealed the importance of changes in society that may influence the ways in which horses are used and people's relationship with nature.
With regard to the context, the foresight exercise therefore considered that economics and society would be the most influential overall factors driving trends and change.
Trends and outlooks
Growth prospects for the French economy
The current economic environment is marked by uncertainties regarding both long-term growth prospects and the potentially lasting consequences of the current global financial crisis, which has not affected all countries in the same way. This context and its knock-on effects are particularly important with regard to the horse industry, for although it has become far more accessible, horse riding is still practised mainly by riders from middle and higher socio-professional categories (Idéactif, 2008). Although it is still too early to predict the impact of the crisis on the horse industry, this aspect should be given due consideration. The middle classes may massively and lastingly be affected or, conversely, there could be a return to sustained growth, which could encourage widespread interest in equestrian and horseracing activities.
Given the extreme complexity of this topic, the panel did not make trend assumptions on the economic environment, but did however consider it to be sufficiently determining to grant it a prominent role in the exploration of the horse industry's future. The economic environment chosen for the construction of each scenario was partly and very broadly based on economic growth scenarios for France in 2030, published in 2011 by the Centre d'analyse stratégique (CAS, Centre for Strategic Analysis) (Pichon and Schaff, Reference Pichon and Schaff2011) and underpinned by a global analysis. The panel did not perform a detailed analysis of the CAS scenarios but used them as a framework for the report's analysis.
The five CAS growth scenarios for France to 2030 are:
-
• a Worst Case scenario with a pessimistic outlook for the French economy against the backdrop of widespread deflation;
-
• a Business as Usual scenario of prolonged sluggish recovery;
-
• an Unsustainable Growth scenario that, after a period of relatively dynamic growth, leads to new imbalances, with no long-term vision and a failure to accommodate environmental constraints;
-
• a Sustained and Sustainable Growth scenario where gains in the reorientation of the productive system are linked to an environmentally aware approach;
-
• a Sustained and Sustainable Growth and More Effective Labour Market scenario that illustrates the additional gains associated with the implementation of proactive labour policies within the framework of the Sustained and Sustainable Growth scenario.
Evolution of the social context
Of the social trends that could affect the horse industry, the panel chose to focus on those that were likely to play a role in the uses of horses as a result of broader interest in horses or a collective commitment. The analysis thus addressed availability and use of spare time, standard of living, social ties and people's relationships with animals. Although these social elements informed the general contexts that guided the construction of the full scenarios, they have not been specifically included in the microscenarios.
Longer lives, more spare time and mobility, but increasingly poorer middle classes.
Longer life expectancy
Life expectancy in France has increased by almost 40% over the last century and is estimated to reach an average of 80 to 82 years for men and 86 to 90 for women in 2030.Footnote 1 This trend goes hand in hand with slowing demographic growth, resulting in an ageing of the population. In France, the proportion of people over 65 is expected to rise from 17% in 2010 to 22 to 24% in 2030 (Parant, Reference Parant2011). Apart from the ensuing socio-economic challenges, the increase in the proportion of elderly and very elderly people will have implications for the demand for goods and services, potentially creating new opportunities for the horse industry in the recreation, care and therapy sectors, and with regard to social ties.
The development of spare time and mobility
The way of relating to space and time has changed. Rapidly developing technology allows for faster information, communication and movement over greater distances (Rosa and Sheuerman, Reference Rosa and Sheuerman2009). With life spans increasing and the time spent working decreasing, the use of spare time is slowly becoming central to collective culture and lifestyles. This is encouraging urban sprawl as well as the development of mobility and holidays (Viard, Reference Viard2006). People's place of residence and their activities are influenced more and more by their spare time and less and less by their place of work. This trend facilitates their multiple belonging to different spaces, reflected in the tendency to live ever further away from their workplace, and thereby increasing the number and/or length of trips per person per day. The trend also generates greater interest in recreational activities. For those who can afford it, quality of life outside of work is becoming a selection criterion for the work itself. Our lifestyles, our choices of ways of relating to family, to nature, to holidays and to culture have had an impact on local and regional planning and development (Viard, Reference Viard2012). This makes holiday areas more attractive and transforms the places in which sport and recreational activities are practised.
Impoverishment of the middle classes
More spare time and longer lives may seem favourable to the development of leisure, sport, tourism or cultural activities. This will most certainly be the case, but the choice of activities will depend on the economic environment and the distribution of wealth. While poverty is expected to decline and new middle classes to emerge around the world over the next 20 years, these trends could be less significant in France where the poverty rate is stable and the overall number of poor people is increasing. Between the poorest 30% and the wealthiest 20%, the middle classes are being eroded as the lower fringes shift closer to the poorest categories (Cette, Reference Cette2011). This trend calls into question the true development potential of equestrianism. Although there still seems to be potential for new riders within the current core client base, this may be affected by a deteriorating economic environment. When added to the ageing of the population, the situation casts doubt on the long-term viability of social security systems, especially retirement benefits. It emphasises on the uncertainties surrounding future political priorities in general and the value and role that may be given to horses in this context.
Transformation of social ties
Several signs of social change suggest a weakening of the ties between individuals and their family, friends, colleagues and neighbours. As these relationships are all solidarity mechanisms and bonds that shape a sense of collective belonging, the results have been the destabilisation of the family as an institution, increasing isolation (whereas 6.1% of people lived alone in 1962, 18 to 20% will do so in 2020) (Hérault, Reference Hérault2012), disengagement from politics and trade unions, and growing delinquency and anti-social behaviour. These trends are partly the consequence of an acceleration of time wearing away at modern humans, yet they also attest to a strong expression of individuality and the desire for freedom of choice. People today want to be free and the greater acceptance of homosexuality and divorce, for instance, are signs that this is increasingly the case (Bréchon and Tchernia, Reference Bréchon and Tchernia2009). Being free, however, does not mean being alone, but being able to freely associate with likeminded groups (Cusset, Reference Cusset2009). This trend is fostered by the emergence of more diversified, flexible and freely chosen networks (Hérault, Reference Hérault2012). These may be cultural, political or industry networks, such as the Indignants movement, the rise of participatory democracy or design collectives that come together to work on collaborative projects or simply to share their innovations. Society is thus increasingly defined by flows and by the exchange of knowledge and know-how. Hence, the above-mentioned freedom of movement also reinforces ties between people, between homes, between the city and the countryside, and between work and holidays (Viard, Reference Viard2012). In the future, society may remain rooted in individualism or may become more collective, with greater solidarity, based on interest groups and a sense of collective belonging based on like-mindedness. Horses may be used in various ways, depending on collective dynamics that could develop through networks organised around the animal, such as horse adoption networks, trail riding groups, events such as the Fish Run (Route du Poisson),Footnote 2 horse lover networks, owner exchanges and equi-therapy enthusiasts.
New ways of relating to nature and animals
Nature in general and animals in particular are now perceived differently from how they were a few decades ago. Whereas contact with nature has become increasingly fleeting and artificial, new ties are being explored through ecotourism, outdoor or even ‘nature’ sports. Ease of travel facilitates these new relationships with nature, allowing people to live experiences ‘elsewhere’. Alongside this search for a special relationship with nature, society grapples with the conflict between the desire to protect the environment and the desire to exploit it, at the risk of destroying it. Environmental and sustainable development issues are, however, fuelling a growing sense of the importance of the relationship with nature in general, and of the individual and collective human impact on resources and natural environments in particular. Change is thus underway, reinforced by the perception of nature as a source of fulfilment, discovery, emotions, and awareness of the link between oneself and the world (Héas, Reference Héas2004). At the same time, contact with animals other than cats and dogs is increasingly rare and empirical knowledge about their behaviour and their needs is declining. The development of anthropomorphism also sees human mental and emotional states attributed to animals. These two factors have changed attitudes towards the animal world. Empathy towards all kinds of animals has thus developed, alongside the rejection of avoidable pain and suffering, particularly through the condemnation of certain breeding and fishing practices (Le Neindre et al., Reference Le Neindre, Guatteo, Guémené, Guichet, Latouche, Leterrier, Levionnois, Mormède, Prunier, Serrie and Servière2009). These attitudes are gradually extending to other relationships between people and animals, including those between people and horses in their different uses, particularly in competitions.
Changes in the economic and societal context as primary drivers of the scenarios
Recovery or a worsening crisis?
The enthusiasm for equestrian activities that has fuelled the industry for over 20 years raises questions about the limits of its growth. Surveys nevertheless show very strong potential for further development that is still limited by a number of constraints, including economic ones.Footnote 3 In order to launch an analysis of the industry's strengths and weaknesses, with a view to meeting the expectations of a population strongly attracted to horses, the choice was made to reduce the importance of the economic constraint. The first proposed context is favourable to the development of recreational activities. It combines slow economic recovery with improved purchasing power of the middle classes, who devote more of their spare time to recreation and to outdoor activities in particular. This economic climate is similar to the one described in the ‘Sustained and Sustainable Growth and More Effective Labour Market’ scenario of the CAS. This scenario is characterised by proactive labour policies and structural reforms in the fields of competition, R&D and the environment. Although these changes are favourable to long-term growth, they initially require significant innovation and investments before yielding competitiveness gains.
At the other end of the spectrum, the 2008 financial crisis and the ensuing debt crisis – whose outcome is still highly uncertain – motivated the panel to also explore a scenario of lasting economic decline. This option is similar to the second CAS scenario, which is characterised by sluggish growth, a high unemployment rate, little innovation and relocations through to 2030. The major impact of such a situation is the deterioration of middle-class purchasing power, to the point where recreational activities less costly than equestrian activities are preferred.
A society centred on relations between individuals in one case, and on people's relationship with animals in the other
After defining two opposite trends for the economic context, the panel chose to explore societal trends that, although not mutually exclusive, could lead to very different scenarios for the horse industry. It first explored a future in which society would be characterised by the development of solidarities rooted in social networks, and then imagined a steep increase in the population's empathy towards animals, reflected in rising concern for their welfare.
Here, changes in the economic context are less determining than in the first two scenarios. Thus, the development of a society emphasising on new forms of solidarity corresponds to an economic context that shifts from ‘Unsustainable Growth’, undermined by persistent debt and a lack of consideration for environmental constraints, to ‘Sustained and Sustainable Growth’ conducive to a more environmentally aware productive system.
The assumption of strong growth in concerns for animal welfare is largely independent of the economic context. To enable more in-depth exploration, the choice was made in this case not to consider a restrictive economic context, such as the one defined in the CAS ‘Worst Case’ scenario, so as to allow for the presence of horses in the family environment.
Users’ and society's expectations regarding horses and equestrian and horseracing activities
Horses have inspired humans’ dreams and desires for centuries and therefore hold a very particular place in French society, although one that has constantly evolved. Today, society's perception of animals is changing, particularly with regard to animal welfare, as is the knowledge of horses held by the people who are in contact with them. These changes are shaping the way people relate to and use horses, the role of horses in society and the way they are cared for. Growing awareness of the need for more sustainable development is furthermore leading to an increased use of horses and may contribute to different horse breeds being preserved across the country. The popularity of various physical activities in France, particularly outdoor sports, has also contributed to the development of horse riding as a recreational sport or a way of relaxing in contact with nature. The educational potential of horses is increasingly exploited to support people with social integration issues. Horsemeat consumption, however, has always been subject to taboos and controversies, and changes in meat consumption patterns only exacerbate its unpopularity. Finally, the appeal of gambling, and horserace betting in particular, is furthermore decisive for the future of racing and of the industry as a whole. The panel therefore considered the following to be decisive factors for the future of the French horse industry:
-
• the ability of horses to fulfil dreams and meet demand relating to recreational, self-realisation and gambling;
-
• the human–horse relationship and animal welfare;
-
• the value of horses for territorial development;
-
• horsemeat consumption;
-
• the role of sports in society, the spirit of competition and competition from other nature sports;
-
• recognising the educational value of horses;
-
• the popularity of gambling and betting.
Users’ and society's expectations: trends and outlooks
The ability of horses to fulfil dreams and meet demand relating to recreation, self-realisation and gambling.
The horse, a unique animal conveying multiple values
From very early human history, horses seem to have had a special symbolic value. They were the animals most depicted in prehistoric art, although they were unlikely to have been the most common animal at the time (Wagner, Reference Wagner2005). Unlike other animals, horses have a complex and multi-faceted symbolism. They are not associated primarily with one particular trait, such as foxes with cunningness (Cirlot, Reference Cirlot2003). People therefore freely associate different values with horses, for instance, strength, courage, loyalty, power, but also sensitivity or freedom, vitality and speed. This is confirmed by numerous everyday expressions making reference to horses in two opposing ways: the submissive, strong and determined work horse on the one hand, and the fiery, unpredictable and temperamental riding horse on the other.Footnote 4 Horses are strongly present in daily life and are used to represent both luxury and everyday consumer goods. Brands as diverse as Poulain, Ferrari, Hermès, Demeco and Marlboro use a horse as their logo. Horses are used to advertise all kinds of products, from internet access and jewellery to luxury perfumes and even food products. Advertisers use the fact that horses arouse emotion and desire across the population.Footnote 5 In a world that is both accelerating and shrinking, the image of horses is even more emotionally laden (Rosa and Sheuerman, Reference Rosa and Sheuerman2009); they simultaneously symbolise freedom, escape from everyday life and the return to traditional values. According to Olivier Domerc, former editor of Culture Pub, a French programme about the advertising industry, ‘horses, unlike dogs and cats, can help sell anything. Few animals have such a strong and universally appealing image’. Advertising industry specialists like horses because they are inclusive, they smooth over race or religion issues, and symbolise the intersection between dreams and reality, and virility and femininity (Bastides-Coste, Reference Bastides-Coste2004).
Horses thus hold a unique place in the hearts and imagination of French people. Horses are their third favourite animal (IPSOS, 2005), and one in three French people would like to own a horse, even though that is not always possible (Sociovision-Cofremca, 2006). Although horses have lost their utility for humans as a source of energy or a mode of transport, French people still want to be around horses, even if they are not riders, particularly during their free time and holidays. Carriage rides are therefore very popular, as are first pony rides and equestrian shows. French people also want to continue to see horses in the countryside. Who has not at some point gone to give stale bread or apples to the horse in a neighbour's field? In addition, apart from direct contact with horses, figurines and toy horses, such as rocking horses, styling ponies and hobby horses are all extraordinarily successful, as are horse raising and riding games on the internet or for game consoles. This confirms the need to integrate horses and the related imaginaire into games, from childhood.
Outlook
Irrespective of what the future is, it seems highly unlikely that horses will disappear from French people's imaginaire. In contrast, proximity to horses, the strength of ties with them and their use may vary across the centuries as a function of the economic, political or environmental conditions of the time.
The human–horse relationship and animal welfare.
From work animal to companion, through nobility
When horses were first domesticated roughly 8000 years ago, they were primarily intended as a food source. It was only around 1000 years later that they began to be used to either carry goods or humans, or as draught animals (Digard, Reference Digard2004). They then became an essential partner to humans. In the Middle Ages, when infantry was overwhelmingly replaced by cavalry, dominated by knights, horses became a means of securing nobility. Anyone wealthy enough to own a horse and equip it could become a knight and therefore a noble (Digard, Reference Digard2004). It was also in the Middle Ages that the cultural distinction emerged between the saddle horse, an instrument and emblem of warrior aristocracy, and the draught horse, a source of energy, a transport engine and a work tool for peasants (Digard, Reference Digard2004). In the seventeenth and eighteenth centuries, horses increasingly became a symbol of ruling class power and horse riding was the preserve of a minority. New cultural gaps developed between the different uses and types of horse. By the nineteenth century, despite rapid industrial and technological development, there had never been such a multitude or presence of horses. They were used for all types of work, in numerous ways. This contributed to the production and diversification of breeds, with certain horses being used solely to distinguish the elite, whose only leisure activities were equestrian. Thus, the nobility had a passion for Thoroughbreds, whereas the rising middle classes sought horses with plumpness, associated with wealth. The nineteenth century also saw the birth of the idea of animal protection. In the twentieth century, for the first time since the Neolithic Period, horses lost their functional utility and entered the realm of leisure, sport and games (Digard, Reference Digard2004). This went hand in hand with a huge increase in the number of riders, particularly women, more specifically from 1930 when they were allowed to ride astride (Tourre-Malen, Reference Tourre-Malen2009). The growing number of women riders fully contributed to the transformations underway. Whereas men readily limited their contact with horses to the time spent on horseback, women took pleasure in ‘mothering’ horses through activities such as grooming and feeding (Tourre-Malen, Reference Tourre-Malen2009). Older horsemanship traditions, based on the art of putting an animal to its best use and respecting it so as not to lose or damage it, gave way to a culture in which horses were no longer an instrument but living beings in their own right, with their own will and soul. Horses became the object of all kinds of care, attention and compassion. They were no longer ‘respected’, they were ‘loved’ (Tourre-Malen, Reference Tourre-Malen2009). This period also saw the emergence of ‘garden’ horses, kept in the family garden, whose maintenance took up most of the family's spare time and whose use was often very limited. From the 2000s, with the appearance of ‘whisperers’ using ‘ethological’ and natural methods, the desire to better understand and communicate with horses arose.
Animal protection, horse welfare and human safety
The changing role of horses has gone hand in hand with a transformation in concerns surrounding animal welfare and animal protection. The first notions of animal protection emerged in the nineteenth century, when horses were used everywhere and many horses died at work. The Société Protectrice des Animaux (SPA, Animal Protection Society) was created in 1845 to protect horses, before extending its efforts to other animals.Footnote 6 Today, numerous foundations campaign for the protection of animals, including horses. Two of the most well-known foundations in France are the 30 millions d'amis, founded in 1976, and the Brigitte Bardot Foundation, founded in 1987. The number of people involved in these foundations – 700 000 donors to the Brigitte Bardot Foundation,Footnote 7 27 400 SPA members in 2010 – bears witness to the considerable concern that people have for animal welfare issues. That is not to say that horse abuse has disappeared. Since 2005, the Brigitte Bardot Foundation has taken in 117 horses and receives over 10 calls per week from individuals no longer willing or able to look after their horse. The Centre d'Hébergement et de protection des Équidés Maltraités (Equidae Home and Protection Centre), created in 1978, currently counts 800 equidae taken in by volunteers, most of which have been removed from their owners following court action.Footnote 8 Unlike in the nineteenth century, these animals do not die from exhaustion or accidents because of overly harsh work; most often, they suffer from a lack of due care by their owner, such as insufficient feed or improper hoof care. Some abuse cases are unintentional, often owing to a lack of knowledge of the animal's specific needs. The transformation of ‘work’ horses into ‘beloved’ horses has been accompanied by changes to the type of individual in charge of their care. Some owners keep horses, despite a complete lack of knowledge on the matter.
Both for novices and for experienced horsemen, the notion of welfare is nevertheless hard to objectify and measure. It is most often defined by the following five freedoms set out in 1979 by the Farm Animal Welfare Council,Footnote 9 as prerequisites: (1) freedom from hunger, thirst and malnutrition; (2) freedom from discomfort; (3) freedom from physical pain, injury or disease; (4) freedom to express normal behaviour of the animal's own kind; and (5) freedom from fear and distress. Whereas the first three freedoms may seem relatively easy to ensure and their consequences simple to measure, the same is not true for the last two. In the case of equidae, respecting the fourth freedom implies their being able, for example, to graze and express social behaviours, which is not possible when they live in stalls. Freedom from fear and distress, particularly for animals participating in competitions, also seems difficult to guarantee. Ensuring the welfare of horses throughout their numerous uses may therefore seem complex and restrictive. On the other end of the spectrum, anthropomorphic reasoning taken to the extreme or coupled with a lack of knowledge of the needs of horses can ultimately be detrimental to animal welfare and lead to suffering or disease. The regulatory aspects associated with animal welfare are dealt with in Paragraph I.3.1(4) ‘Regulation on horse welfare’.
The human–horse relationship and human safety
In addition to the problem of involuntary abuse, a lack of knowledge about horses also raises a safety issue. A survey of American veterinarians revealed that horses were responsible for 15% of all work-related accidents, the third highest rate after cattle and dogs (Landercasper et al., Reference Landercasper, Cogbill, Strutt and Landercasper1988). In France, equestrian environments represent the second most dangerous branch of the green sector after forestry in terms of serious injury, and over 70% of accidents directly involve horses. A horseracing study shows that 60% of accidents are due to a fall from a horse, whereas 10% result from hoof kicks and 7% from head butts (Direction générale Humanisation du travail, 2009). Serious accidents can thus occur on foot, even for people accustomed to handling horses. It is therefore crucial for people who acquire a horse, or who come into contact with horses occasionally, to be informed of the potential dangers of this animal.
The shift from the role as a ‘work’ animal to a ‘beloved’ animal has profoundly affected human relations with horses. This has brought about the simple desire to ‘care’ for a horse, to communicate with it and to ensure its maximum welfare. However, it seems important, both for the welfare of horses and for their owners’ or riders’ well-being, not to forget that horses are ‘large’ and potentially dangerous animals that require specific care and handling.
The value of horses for territorial development.
After disappearing from the countryside, can horses find a role again in the various natural and social contexts?
After being omnipresent in France until the end of the nineteenth century, horses gradually disappeared from the landscape. With the development of motorised vehicles and the acceleration of lifestyles they became too ‘slow’ and therefore no longer useful. It has only been since the end of the twentieth century that horses have gradually reappeared outside of riding schools and racecourses. A number of factors have contributed to this change, including the development of environmentalism and green political movements (1970), the emergence of analysis surrounding the principle of sustainable development and society's growing general awareness of the need to protect the environment. Horses have an undeniable advantage in territorial development: their presence lends certain areas their identity, and others a particular appeal through the presence of racecourses, equestrian events or specific riding trails. In town, they highlight municipalities’ environmental or sustainable development goals. Horses are an environmentally clean, socially valued and at times cost-effective means of carrying out a wide range of activities, including collecting rubbish, sorting waste, environmental communication, maintaining green spaces and transporting children. In agriculture, they are very useful in organic farming, particularly for wine and vegetable growing, and unquestionably offer an excellent complement to machines for hauling. Particularly in environmentally sensitive areas, horses make it possible to move about or maintain spaces without damaging the soil or the ecosystem. They are also ideally suited for maintaining specific preservation areas, as they can clear the land while conserving plant and animal biodiversity (Fleurance et al., Reference Fleurance, Duncan, Farruggia, Dumont and Lecomte2011). A number of European Union Natura 2000 protected areas use horses in this way, both on their own or together with sheep and cattle. In temporarily or permanently unused areas such as mountains, they maintain the land and prevent overgrowth. In peri-urban areas, they use and maintain small green spaces no longer used by farmers that have not yet been developed. The development of equestrian farms also contributes to environmental planning.
More generally speaking, animal traction can be considered as a source of renewable energy, particularly when horses are used in extensive farming. The French government has committed to developing renewable energy and meeting 23% of France's total energy needs using renewable sources by 2020.Footnote 10 If animal traction were officially recognised as a form of renewable energy, initiatives of this nature could receive financial support and therefore develop even further.
Outlook
Recent trends in society and growing concern for environmental protection and sustainable development seem to be powerful forces driving the diversification in the use of horses for territorial development. However, given the current prolonged and worsening economic crisis, reduced public funding and the development of a market economy could hinder such projects, which are not always cost-effective from a purely economic perspective.
Horsemeat consumption.
Horsemeat consumption in France: history, symbols and a controversial present
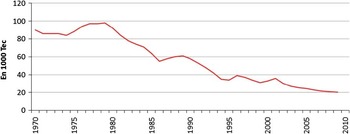
Horsemeat has been consumed by humans since prehistoric times, as attested by the hunting scenes in rock paintings. Following the domestication of horses, however, the conception of horses as a food source gradually changed and consumption slowly decreased (Fleurance et al., Reference Fleurance, Duncan, Farruggia, Dumont and Lecomte2011), particularly following several successive bans, as detailed in Paragraph IV.3.1(4) ‘Regulation on horse welfare’. Horsemeat consumption became a taboo in the eighth century as part of a fight against the pagan rituals of Germanic peoples who killed horses and consumed their flesh during religious celebrations. Nobility thus shunned horsemeat until it was reintroduced by Napoleon III. The SPA actually played a fundamental role in its reintroduction by promoting horsemeat consumption as a means of ensuring that old horses were not ill-treated (Digard, Reference Digard2004). In the nineteenth century, arguments against horsemeat consumption were no longer religious or health-related but essentially commercial and moral. Horsemeat was eaten mainly by the poor, or even the destitute, and was associated not only with waste and carrion, but also with prostitution (Leteux, Reference Leteux2005). Very soon after it was legalised, the virtues of horsemeat were recognised and numerous doctors prescribed it to patients and to workers with high-energy intake needs. Although horsemeat consumption gradually increased from 1870 to 1970, mainly in cities with a large working-class population, it remained a marginal practice. In 1888, it accounted for hardly more than 3% of total meat consumption. After peaking in 1911, horsemeat consumption rapidly decreased from 1970 onwards (Figure 1), in tandem with the decline in the working-class share of the population (Leteux, Reference Leteux2005).
Trend in horsemeat consumption (FranceAgriMer data).

In recent years, despite a few increases following food-safety crises affecting other meats, average horsemeat consumption per capita in France has continued to fall. This can be explained by a change in availability, but also and especially by the relative prices of other meats (FranceAgriMer, 2010b). In the 1990s, horsemeat began to lose its price advantage over beef (Leteux, Reference Leteux2005). Starting in 2007 to 2008, the economic crisis and reduced buying power accentuated the general decrease in households’ meat consumption, including horsemeat. This behaviour has also been accompanied by shift from red meat to white meat consumption (FranceAgriMer, 2010b). In 1970, beef accounted for 39% of all meat consumed in France. By 2009, the figure had dropped to 29%, whereas the share of poultry had risen from 16% to 28%. Discourses promoting white meat, meat with less fat, smaller meat portions and even meat-free days have accentuated this phenomenon (FranceAgriMer, 2010b). Meat consumption is also affected by the depiction of the livestock industry as polluting, not always respectful of animal welfare, and siphoning grain away from human consumption (FranceAgriMer, 2010b). Yet unlike other red meats, horsemeat has very little fat – <5% lipids in main horsemeat cuts, 60% of which are unsaturated fats. The nutritional properties of horsemeat could make it more attractive to a more health-conscious society.
The Italian horsemeat market
Italy is the number one European consumer of horsemeat produced in the European Union (EU). It is the primary market for French foals produced for meat; 71% of live-export animals are sent to Italy where they are fattened for slaughter (Heydemann et al., Reference Heydemann, Boyer, Couzy, Dornier, Madeline, Morhain and Ragot2011). However, over the last 10 years, Italy's horsemeat consumption has dropped by a third, from ∼70 000 to 50 000 tonnes per year (FranceAgriMer, 2010a). Moreover, meat from live-import animals is losing ground to direct meat imports, which accounted for one-third of available horsemeat in the early 2000s and now account for over half. The apparent growth in imports from the EU most likely conceals an increase in purchases from non-EU countries, with imports received in a second EU country giving rise to intra-EU flows. The Italian market for French meat and foals seems to be gradually decreasing, which could jeopardise the French production industry.
Declining horsemeat consumption therefore stands out as a major trend in France, which is compounded by the shrinking Italian market for meat and foals.
The role of sports in society, the spirit of competition and competition from other nature sports.
The development of sport in France and the place of horse riding
The first stage in the development of sport in France saw the rise of private clubs between 1880 and 1920. In 1958, sport was mostly practised by young people, with a distinct advantage for boys and a preference for competitive sport. In 1967, INSEE statistics showed that 39% of French people over the age of 14 practised a sport. From the 1980s onwards, more people began practising it, although competitive sport continued to predominate (INSERM, 2008a). In the 2000s, the number of people practising sport continually increased, and by 2010 the percentage of French people over the age of 15 practising a physical activity was estimated at 89% (Lefevre and Thierry, Reference Lefevre and Thierry2010) – more than double the 1967 figure. However, only 65% practised a physical activity on a regular basis, at least once a week, and 30% were members of a sports group or team. The main factors motivating sport practice were well-being (89% of those practising a sport) and health (83%), followed by the need to meet people (69%). Generally speaking, sports are practised in three ways: competitively through clubs; high-level sport practised within professional clubs; and sport practised independently (INSERM, 2008a).
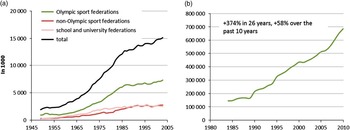
Although registered club members represent only a small share of people practising a physical activity, they provide an objective means of quantifying trends in sports practices. From 1949 to 2003, the annual number of memberships issued by registered sports federations increased eightfold (Figure 2a). This trend can be broken down into three phases: from 1949 to 1956, average annual growth was 3% and mainly because of school and university federations; from 1957 to 1986, the average annual growth reached 5.8% and concerned all types of sport federation; and finally, growth has significantly slowed down since 1987 to an annual average 1.0%, although there have been signs of recovery in recent years. Throughout this period, the proportion of women has consistently increased: from 19.4% of memberships in 1962 (Crosnier and Boisson, Reference Crosnier and Boisson2004) to 37.6% in 2010 (Tourre-Malen, Reference Tourre-Malen2009).
Memberships and other forms of participation, all sports considered (a) (Crosnier and Boisson, Reference Crosnier and Boisson2004) and for horseriding (b) (FFE data).

Whereas the total number of memberships, all sports considered, grew by only 1% a year from 1987 onwards, the number of equestrian club memberships grew by ∼6% a year from 1984 to 2010 (Figure 2b). No other major federation comes close to matching this spectacular figure for a federation that had only 20 000 riders in 1949 (Tourre-Malen, Reference Tourre-Malen2009). At the same time, there have been major changes in equestrian practices: they are increasingly accessible and are practised more and more by women and children (Tourre-Malen, Reference Tourre-Malen2009), their variety has grown, as has recreational riding, and equestrian centres have developed and changed, along with instruction methods (Digard et al., Reference Digard, Ould Ferhat, Tourre-Malen, Caporal and Vialles2004). The steep increase in the number of riders has thus gone hand in hand with the growing diversity of horse uses. The French Equestrian Federation (FFE) is now the third largest sports federation after football and tennis. It is also the federation with the most women members among federations with over 100 000 members.
Is the growth of horse riding related to its proximity to nature?
‘Nature sports’Footnote 11 are sports practices that offer a special means of discovering the natural environment. They can be divided into land-based practices (14 federations including horse riding), water-based activities (12 federations) and air-based ones (eight federations). Approximately 1 in every 3 French people over the age of 15 practices a nature sport, and 4 of the 10 most practised physical and sport activities in France are nature-related activities. Cycling and hiking represent a large proportion of these activities and, in general, land-based activities are more popular than water-based and air-based ones. In contrast, unlike swimming, hiking or cycling that are practised extensively in the summer holidays, horse riding is practised less during the summer than the rest of the year (Ministère de la santé dljeds, 2007).
Like horse riding, nature sport federation memberships have grown significantly, at 9% per year between 2001 and 2005, compared with only 4% per year for other single-sport federations (Ministère de la santé dljeds, 2007), and 3% per year for horse riding over the same period. This demonstrates a very strong, although recent, interest in these sports. While the growth of horse riding is greater than the average of other sports, it is similar to, if not lower than that of other nature sports. Horse riding, however, differs from other nature sports. It is practised throughout the year rather than during the summer, and often in indoor schools and arenas, and thus it is not always outdoors and in nature. This may make other nature sport activities more popular, particularly if they are more affordable, such as hiking for instance.
Recognising the educational value of horses
The FFE communicates increasingly widely on the value of horses for education and on the fact that horse riding encourages respect for others, for animal life and for the natural environment. It also highlights the fact that equestrianism gives people a taste for effort, for commitment and for perseverance, and contributes to the physical well-being of those practising it (see footnote 4). Despite its efforts, however, the educational value of horses is often unknown and underused. Riding and caring for a horse is no trivial matter. For children, who are normally looked after by adults, it enables an enjoyable role reversal that gives them a sense of responsibility, teaching them to be more autonomous. In pony clubs, children must take care of an animal much larger than themselves, guide it and communicate with it. Horse riding therefore offers a real educational opportunity for young riders to assert themselves and learn to interact with others, whether that is a horse, a pony or a peer.
Horse riding is also very helpful for developing social skills. Ponies and horses allow people who have been discriminated against to gain or regain confidence, thanks to a relationship that precludes any such prejudice (Houard, Reference Houard2007). What is more, as each rider shares the ponies and horses with the other riders and with club staff, social ties are developed through sharing (see footnote 4). The organisation Cheval insertion, Maison d'enfants à caractère social (Integration with Horses, Social Care Home for Children), for instance, has a social care facility for children, linked to a riding school that welcomes young people with difficulties in social integration, in relation to others, or in their own personal development. In this not-for-profit organisation, equestrian activity is the main educational medium used. A ‘microsociety’ is thus built around a riding school that is also used by the public, thereby allowing these young people to acquire values inherent to a balanced social life. As the riding school also serves the general public, the interactions enrich both programme members and other riders. Another example is the not-for-profit organisation Cheval et Insertion en Île de France (Horses and Social Inclusion in Île-de-France), created in 1993 with the purpose of ‘promoting, coordinating, offering and designing activities using horses for entertainment, prevention or social inclusion’.Footnote 12 Horses and ponies become an educational partner and a means of building relationships, used to encourage the learning of values such as respect, sharing, discipline and listening. The organisation offers a variety of activities: a travelling pony club, to give the oldest children a sense of responsibility, promote neighbourhoods and attract the parents’ interest; weekly riding sessions for teenagers that stimulate their involvement and are a motivational lever from both a social and an educational perspective; discovery and equestrian workshops; and so on. The organisation also operates in prison settings, where the objectives are slightly different: getting fresh air, emotional and relational healing, recidivism prevention, competence building and integration.
Generally speaking, such actions are highly beneficial in a number of ways (Haxaire, Reference Haxaire2011):
-
• for personal development skills, the horse is a means of finding a place in relation to the animal, as well as in relation to oneself and to others;
-
• from a relational perspective, horses are excellent mediators for re-establishing dialogue; they allow for the setting of rules and boundaries and serve to build, safety, trust and values such as courage, willpower and perseverance;
-
• from a psychological perspective, through horse grooming and care, individuals adjust their behaviour in relation to the horse and thus to others; this enables learning about managing emotions and about caring for someone other than oneself;
-
• from a physical perspective, horse riding enables riders to learn to adapt their own movements to those of the horse;
-
• from a professional perspective, there are a large number of vocations in the equestrian world, and there is tailored training catering to all levels and tastes; practising an activity linked to horses therefore provides an opportunity to discover the world of work and to imagine a future for oneself.
Feedback both from young people and from correctional facilities about these programmes is always highly positive. No other method seems to be able to match the results obtained with horses. Developing such activities for a wider public is, however, limited by a lack of funding, which primarily depends on policymakers’ willingness, at national or European level, to encourage this kind of initiative.
The popularity of gambling and betting.
Is growth in the sector a source of development or of addiction?
After being banned for many years, gambling was gradually legalised in France from the last third of the eighteenth century, starting with the creation of the Royal Lottery. Casinos were then legalised in 1906, the Pari Mutuel Urbain (PMU, French horse-betting agency) was created in 1931 and the French National Lottery in 1933, which became the Française des jeux in 1976 (Costes et al., Reference Costes, Poucet, Eroukmanoff, Le Nezet, Richard, Guignard, Beck and Arwidson2011). These three operators still control most gambling in France, which is becoming increasingly popular. Household spending on gambling increased by 148% between 1960 and 2005, reaching 134 euros per year and per capita in 2004. However, gambling expenses account for only 0.9% of French household spending, which is slightly less than the 2004 EU average of 1.0% (Trucy, Reference Trucy2006).
Whereas close to 1 in 2 people aged 18 to 75 years report having gambled in the last year, only 1 in 5 players play at least once a week (regular player), and just under 1 in 10 report having spent over 500 euros during the year (big spenders) (Costes et al., Reference Costes, Poucet, Eroukmanoff, Le Nezet, Richard, Guignard, Beck and Arwidson2011), with men playing overall more than women. Of the regular players and big spenders, 3.7% can be qualified as problem gamblers, 7.1% as moderate-risk gamblers and 12.2% as reduced-risk gamblers. These proportions seem relatively lower in other developed countries having performed similar studies, although differences in methodology make comparison difficult. Compared with other types of players, problem gamblers are more often male, young, financially unstable and single, with few or no qualifications.
Unlike lottery and scratch card games, which do not involve any learning process, horseracing and sport betting seem to remain the preserve of experienced players, as they account for only 23.2% of regular players and big spenders. Conversely, 62% of PMU players are regular players and it would seem that games like those of the PMU, sport betting and Française des jeux's Rapido are more closely associated with problem gambling or addiction than are other types of games (Costes et al., Reference Costes, Poucet, Eroukmanoff, Le Nezet, Richard, Guignard, Beck and Arwidson2011).
Outlook
In the past, horseracing betting was limited by the need to travel to a racecourse or a point of sale. The Law of 12 May 2010, however, allowed for the development of online gambling in France in three areas: sport betting, horseracing betting and poker. The change allows anyone to play and bet anytime from anywhere, which could lead to a high and rapid increase in the number of bettors and bets. It may also encourage gambling addiction. By causing the number of people with one or several of the profiles described earlier to increase, a persisting or aggravated economic crisis could lead to a rapid increase in the share of problem gamblers.
Users’ and society's expectations: microscenarios
The microscenarios of public expectations in 2030 were based on a comprehensive analysis of all the trends presented, in connection with the socio-economic context.
Microscenario 1: horses for everyone, at all ages and levels
Recreational activities are developing considerably in urban, peri-urban and rural areas, and are increasingly diverse. They are creating new ties between cities and the countryside. For many, the strong desire for contact with horses has been met and equestrian activities have become recreational activities accessible to a majority of the population. They are regularly practiced at all ages and levels, and are once again appealing to men. Riders and their families are fond of ‘club’ competitions, where a friendly atmosphere prevails, and of trail rides with friends or family where they can be in contact with nature and relax. French people, whether riders or not, like gambling and betting on horseraces and on equestrian and other sports. Cities closely associated with horseracing rely on horses to develop their tourist appeal. This nature-oriented society does not, for the most part, consider horses as a consumer good.
Microscenario 2: horses as a preserve of the elite
Equestrian practices have become very costly and horse ownership even more so. They are the preserve of the elite and are inaccessible to the middle classes, which consequently prefer more affordable outdoor recreational activities such as hiking and mountain biking. Little effort is made to use horse traction. Horse riding has become a way of asserting social status, particularly through high-level competition. Most people's expectations of horses are now focused on horseracing and betting, which continue to exist. Horsemeat consumption remains low, even though exploiting the meat value of cull animals is often an economic necessity.
Microscenario 3: horses, a source of harmony and territorial development
Horses are recognised and promoted for their numerous virtues in personal development, in building social ties and, more broadly, in the development and planning of land resources. They are a source of entertainment and enhance the quality of life. They are also a tool for environmental protection. Horse riding differs from other educational and recreational activities through the relationship with the animal, while also creating ties between individuals and contributing to their well-being. Equestrian centres are lively meeting places for riders and locals. Equestrian tourism is highly popular, bringing together contact with nature and the discovery of heritage, in a welcoming atmosphere. The important social role of horses discourages horsemeat consumption and consequently the production of horses for meat. While the desire for contact with nature favours horserace betting over other types of gambling, the development of problem gambling raises ethical concerns over addiction.
Microscenario 4: the horse, a life companion
The perception of nature and animals has considerably evolved within society, reinforcing concerns for animal protection. Long seen as work animals, horses have become life companions. Horses are admired, loved and respected, and people wish to understand and care for them. They are also loyal companions who do not judge. They enable individuals to break away from loneliness, to make themselves feel useful and to have a fulfilling emotional relationship. In the home environment, the care and maintenance of horses is a source of recreation for all family members, and their presence strengthens intergenerational ties. Horse riding is no longer the primary activity, compared with other activities surrounding the horse itself. The majority of the population refuses to eat horsemeat. Horseracing is discredited and bettors play without preferences across all of the PMU's horseracing and other sport offers.
Public policy and regulation
Public policy on the horse industry is shaped by trends in national policy and in the application of EU policies. Given the recent reorganisation of the industry's public regulatory structures, French horse policy is both a source of concern, particularly relating to funding cuts, and an opportunity for greater autonomy for industry stakeholders. The regulation of horserace betting, equally decisive for the industry's financing, reflects major uncertainties, especially for the economy of the racing sector, which is being jeopardised by the opening of online betting to private operators. In the shorter term, the industry is faced with uncertainty surrounding the outcome of debates between France and the EU on the taxation of equestrian and horseracing activities. This will in turn affect their status and their revenues. Finally, changes in relationships between people and animals, as outlined in the previous sections, as well as changes in animal welfare regulation in countries such as Switzerland and the United States, call for serious reflection on possible future developments. In Europe, some of the horse welfare regulations are already controversial and could have a strong impact on equestrian competition and horseracing practices. The panel therefore considered the following to be decisive factors for the future of the French horse industry:
-
• French policy on horses and related funding;
-
• the management and regulation of horserace betting;
-
• tax rates applied to equestrian and horseracing activities;
-
• horse welfare regulations.
Public policy and regulation: trends and outlook
French policy on horses and related funding.
Recent restructuring reflects the government's gradual withdrawal from industry management
For several centuries, the Ministry of Agriculture sought to guide breeding and help breeders meet France's needs for horses of all kinds (Gendry, Reference Gendry1973). It created the Haras administration system for stud farms, which has been instrumental in the implementation of French horse policy. For over 300 years, the Haras have adapted and evolved to meet the needs of the French army, farmers, breeders, breed associations, riders, horse enthusiasts, and local businesses and authorities.Footnote 13 In 2000, the Haras became State stud farms known as the Haras nationaux. In 2010, the Haras nationaux were placed under the remit of the Institut français du cheval et de l’équitation (IFCE, French Horse and Horse Riding Institute) along with the École nationale d’équitation (National Horse Riding School) (Lebrun, Reference Lebrun2010). The IFCE is focused on public service missions and is under the remit of the Ministries of Sport and of Agriculture. It is the sole public body supporting the professionalisation of the horse industry. The Haras nationaux activities, which used to deal with commercial interests and compete with other stud farms to offer stud and identification services,Footnote 14 have been entrusted to a public agency, France Haras, with the aim of being privatised. These changes have accompanied other government modernisation efforts, budget cuts, and a separation of political and technical functions into separate agencies. As a result, the Ministry of Agriculture has resumed its responsibility for defining horse policy, drafting regulatory texts, exercising its role as a supervisory authority and distributing incentives to the industry paid by the IFCE. From a regulatory point of view, the Ministry of Agriculture must contribute to the expansion of horse-related activities to support the industry's economic development and its presence throughout France. To do so and to improve funding effectiveness, the Ministry first prioritised increasing industry stakeholder responsibility and making the industry more structured and professionally oriented (Ministère des Sports et al., 2003). This phase requires measures and gradual transitions that justify maintaining financial support, although it is to be discontinued in the near future. This is a general trend in most EU countries and is supported by the European Commission.
Declining national funding
Until 2002, public funding for the horse industry depended on the revenues generated by horseracing betting, which were transferred directly by the PMU to the Haras, and later to the Haras nationaux. To ensure better control and greater effectiveness of public spending, subsidies were dissociated from revenues by the 2002 Budget Act. The State levy on PMU stakes has since been integrated into national budget revenues and funding for the industry has been integrated into the budgets of the ministries responsible for agriculture and sport. Subsidy levels fell in line with the drop in State funding imposed by the General Revision of Public Policies (RGPP). Subsidies were then attributed to meet government objectives for the industry, including its financial and professional autonomy.Footnote 15 This has translated into a rapid decrease in national public subsidies.
This contraction of public funding has been partly offset by the creation of the EPERON fund (Encouragement aux Projets Équestres Régionaux ou Nationaux), an incentive fund for regional or national equestrian projects, managed by industry professionals. The aim is to support investment projects and actions designed to unite or consolidate the industry, improve knowledge about it and develop it internationally. The creation of this fund, with an annual budget of ∼10 million euro, is fully in line with the political objective of empowering and professionalising the industry – provided its funding from PMU revenues is not called into question, which may be the case in the future.
National subsidies
IFCE funding
The IFCE is a government agency set up to encourage equine breeding and horse-related activities, and to promote the spread of French horse riding and equestrian art. In 2012, the Ministry of Agriculture subsidy to the IFCE for providing public services amounted to 38.8 million euro, which represents a 15% drop compared with 2000. The IFCE also received a 7.1 million euro subsidy from the Ministry of Sport in 2012.Footnote 16 Until 2015, government support to IFCE running costs will be assessed on the basis of its territorial organisation and the progress achieved in transferring its competitive activities to the private sector. Beyond 2015, government support to the IFCE will depend on the missions entrusted to it. RGPP audits recently confirmed that these missions will include the equine identification system, training and research, support for high-level sport, promotion of equitation in the French tradition, support for the organisation of the horse industry, and of local and regional cultural and sport events (IFCE, 2012).
Direct aid to the industry
Financial support from the Ministry of Agriculture is allocated for balanced and sustainable land management, as part of the programme for the economy and sustainable development of agriculture, fishing and the regions. Aid to the industry is designed to support horse production by funding breeding contests and allocating grants to horse breeders who have bred winning race and sport horses. It also comes in the form of subsidies to contest organisers, approved national not-for-profit breed organisations and national not-for-profit organisations that serve the public interest (Handi-Cheval, Ligue de protection du cheval, Equine Law Institute).
This support amounted to ∼12 million euros in 2000; it dropped to 9 million euro in 2010 and was almost halved over the next 2 years, reaching 4.52 million euro in 2012. Since 2009, the industry has also suffered the consequences of the deregulation of the public carcass disposal service, the cost of which is no longer borne by the State. Partial compensation for the reduction in subsidies has been made through the creation in 2011 of a new 3 million euros fund to promote draught and sport horse and pony breeding. This fund, levied on the EPERON fund, will be financed by horseracing bet earnings and will be managed by the Société Hippique Française (French Equine Association), the oversight agency for the breeding and sport sectors. This compensation will offer only very partial relief from the gradual and direct disengagement of the Ministry of Agriculture, and constitutes a new stage in the process of transferring greater responsibility to industry stakeholders.Footnote 17
Support from local government
Specific funding may be allocated to the horse industry regionally through the State–Region Project Contract (CPER). For the 2007 to 2013 period, only five French regions (Burgundy, Pays de la Loire, Lorraine, Lower Normandy and Champagne-Ardennes) benefit from specific funding to support the horse industry. Through these contracts, the national government's commitments to the horse industry amount to over 6 million euro for the current period.Footnote 18 This is generally even lower than the regions’ own contributions. More generally speaking, the value of the government's overall contributions under the CPER framework has increased since its creation in 1984, confirming the trend in public policy territorialisation. The regions further allocate co-funding as part of rural development programmes supported at European level by the European Agricultural Fund for Rural Development (EAFRD). A few regions, such as Pays de la Loire and Brittany, have also set up long-term regional plans for the horseracing sector in collaboration with regional horse councils and the IFCE. In addition, numerous actions are supported by local authorities as part of their policies for training, education, support for sport, tourism, agriculture or biodiversity. The diversity of organisations involved makes action at local level difficult to evaluate.
EU subsidies
Horses have been recognised by the EU as a resource for sustainable rural development. Horse industry stakeholders can therefore request EU funding within the general framework of aid from the European Agricultural Guarantee Fund (first pillar of the Common Agricultural Policy (CAP)) if they are a part of the agricultural sector as per the EU definition.Footnote 19 More broadly, funding can also be granted as part of the EAFRD, which comes under the second pillar of the CAP and supports, among other things, the preservation of endangered breeds through a subsidy (PRME – Prime aux Races Menacées d'Extinction).Footnote 20 The industry can also benefit from support from the European Regional Development Fund. Greater inclusion of environmental, social and territorial issues over successive CAP reforms has been beneficial for horses.
Government involvement to 2030.
Only 15 years ago, public action supporting the horse industry seemed to be evolving very slowly. The desire to improve the effectiveness of public funding, to respect EU regulations and to accommodate changes in horse use has gradually led the French government to review its missions and, consequently, its management and funding of the horse industry. The government's food safety and hygiene responsibilities are not likely to be called into question. In light of recent government declarations on horse-related policy, it furthermore seems probable that, at least in the medium term, government management of the industry through the IFCE will continue. Similarly, its involvement in traceability, in genetic regulation, in support for endangered breeds, in the use of horses as mediators in social inclusion policies, and in research and training is likely to be maintained. This trend has been accompanied by the cessation of national aid for industry stakeholders, although this does not preclude the development of new forms of support for equestrian and horseracing activities through regional policies for local economic development, regional planning and development, and socio-educational or environmental activities. This may reflect a growing desire by the national government to shift policy to the regions; conversely, it may be the product of the initiatives by local authorities, aware of the importance of equestrian and horseracing activities for regional planning, and development, tourism, culture and the local economy. It is nevertheless not entirely unlikely that national and regional public action might favour the industry's total liberalisation should economic conditions over the next 20 years be particularly difficult. All financial support for industry stakeholders would then be withdrawn, except for non-specific support from which it would be difficult to specifically exclude horses, such as agricultural or rural development aid from the EU, which would be granted to other sectors. The national government can, however, be expected to maintain its commitments to traceability.
The management and regulation of horserace betting.
How does the introduction of competition through online betting threaten horserace industry financing?
Horserace betting stands out from other gambling games through its history, which is linked to the breeding and improvement of the various horse breeds. The French racing system has been strictly managed since the first Organic Law of 2 June 1891, in terms of which racing companies fell under the control of the Ministry of Agriculture. The law allowed racing companies whose ‘exclusive goal is the improvement of the equine breed’ to organise betting within their racecourses, based on the pari-mutuel model. From the outset, national levies were placed on the stakes with the aim of funding both charity and breeding. Reconstruction needs following the First World War gave rise to new levies to fund the construction of hospitals, public drinking water conveyance networks and the modernisation of agricultural training.
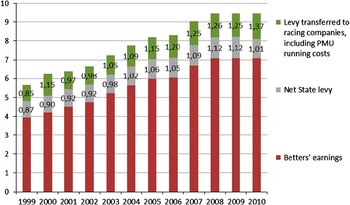
In 1930, Parisian companies were authorised to take bets outside of racecourses; they then came together under the name of PMU to manage and collect gamblers’ stakes. The popularity of gambling overtook shows and sport, and drew the public to racecourses. New levies on stakes came directly under the remit of the budgets of the ministries concerned, and were attributed to the various beneficiaries without passing through the national budget. In 1941, levies accounted for 12% of stakes placed with the PMU, and by 1956 they reached 14.5%. The levies allowed for the creation of new funds for families (1956), for the development of sport (1980) and for community life (1984). To retain control over the PMU, the government restructured the racing industry. In 1983, the PMU became an economic interest grouping managed by the national government, and racing companies were obliged to pass through the PMU to organise bets outside of racecourses (Camillieri, Reference Camillieri2008). The monopoly afforded the PMU significant revenues, placing it in the top 50 companies in France across all industries. It has contributed to funding both the horseracing industry and the national economy. The 10 billion euro of bets made in 2011 brought in 1 billion euro for the national government and a little more than a billion for the racing industry through the returns to racing companies and as funding for the PMU's running costs (Figure 3).
Allocation of horseracing stakes, 1999 to 2010, in billions of euro (IFCE).

The development of online gambling, which is hard for the State to tax but easy for players to access, disrupted the system's equilibrium. This happened at a time when the EU informed France that the PMU's monopoly (and that of Française des jeux) was in complete contradiction with the European push to liberalise services and offer greater competition in the gambling sector (Martignoni-Hutin, Reference Martignoni-Hutin2011). Other European countries came under attack for the same reasons. Some chose to rapidly conform by liberalising games, either completely, such as Italy and the United Kingdom, or partially, such as Germany and Belgium. Others such as Portugal and Sweden defended State monopolies in the name of fighting addiction, and committed to capping stake values. Given the PMU's and Française des jeux's marketing efforts to expand their client base, it was difficult for France to plead for a maintained monopoly on the basis of limiting dependency through reasonable and responsible playing (Myard, Reference Myard2011a). Various verdicts thus led to the Law of 12 May 2010, which opened gambling to online competition. The law was designed to meet EU requirements while legalising and certifying private operators. Seven horserace betting operators were certified when the Law was enacted. The law imposes a maximum 85% rate of return to players, a direct taxation of 7.5% of stakes and an 8% takeout on the sums wagered by bettors for the profit of racing companies and for the public service mission that the operators have been entrusted with to improve and promote horse breeding. The measures taken by France were not accepted by the European Commission, which filed legal proceedings against the country on the grounds of the incompatibility of the levies with European lawFootnote 21 (Trucy, Reference Trucy2011). Pending the outcome of the case, tax provisions allow race organisers to reclaim these amounts. The Law has also allowed municipalities with racecourses to benefit from a 15% share of the tax levy in proportion to the value of the stakes placed at the racecourse in their municipality, up to a limit of 700 000 euros per municipality and 10 million euro in total.
The opening to competition has until now not penalised the PMU, which has become the number one betting site in France, thanks to its successful diversification. Online betting accounts for only ∼10% of bets placed with the PMU, but has nevertheless grown rapidly, increasing by 30% between 2010 and 2011 (ARJEL, 2012). The future of the horseracing industry's financing is a greater source of uncertainty. The potential challenge to the returns to horseracing companies threatens the current functioning of racing insofar as they represent 80% of their budget for organising races, maintaining training centres and, more particularly, paying subsidies and allowances to breeders and horse owners. Moreover, a share of the levies transferred to race organisers provides funding for development and innovation for the entire industry through the EPERON fund (9 million euro in 2010). This resource therefore plays a decisive role, given that no right of the public exists that could afford compensation for the use of racing to support bets (Myard, Reference Myard2011a).
Developing regulation to accommodate a free market, consumer protection and industry financing
The racing sector, largely financed through horseracing bets, is caught in a maelstrom of gambling policy that affects a wide variety of operators. To continue as it has in the past, the racing industry depends first and foremost on levies on stakes, returned to race organisers. While the 8% share may seem ‘institutionalised’ in French law, its future remains uncertain at EU level. The principle of a levy to organise races and pay incentives can certainly be seen as compatible with European law. However, the amount of the levy may be restricted to a certain proportion of the stakes placed, because of pressure from foreign operators and particularly from bookmakers who are at war with the ban on fixed odds. At best, France will successfully defend its 8% return on stakes to finance the missions entrusted to race operators, but the percentage may be reduced should horserace betting continue to grow. Maintaining this percentage in the long term will surely only be defendable on the basis of the need to collect sufficient funds to cover horserace running costs.
The 2010 law is merely the beginning of the contentious issue of gambling regulation. Widespread debate on the subject has had the advantage of reviving concerns about the social and health-related impacts of gambling (INSERM, 2008b). In the long term, the current push for free and open competition could very well come up against the public health consequences of gambling and bring about a return to a State monopoly on games of chance. A future monopoly may take a different form from previous models and be based on control over the stakes and rules guaranteeing responsible betting. With the development of powerful global operators, the long-term complete liberalisation of gambling, including in ‘bricks-and-mortar’ outlets, should not be excluded, because of government's inability both to control and to tax companies. For racing, this would imply the total cessation of financial returns to the industry and the concentration of racing in private businesses across a few racecourses with sufficient technological, material and human resources.
These possible trends should be put into perspective against bettors’ interests. The return of levies to the industry, should it be successfully secured over time, will benefit the industry only if stakes are sufficient. Organising 18 000 races a year for 30 000 active horses cannot happen without the contributions of bettors and players, who will have to make choices from the multitude of available games of chance.
Taxation applied to equestrian and horseracing activities.
Recognition of agricultural status, a major change for economic stakeholders that conflicts with European tax harmonisation
Until 2005, only activities relating to horse breeding were considered agricultural. Activities consisting of the training and use of horses were subject to distinct social, fiscal and economic regulation, causing a distortion of competition and a lack of clarity. For example, equestrian centres registered as businesses had to pay 19.6% VAT, whereas those registered as not-for-profit organisations were exempted from VAT. To simplify the various taxation systems, especially that of breeder trainers,Footnote 22 the French Rural Code incorporated into agricultural activities the preparation and training of domesticated equines for use other than in the performing arts.
The harmonisation of the official status of different types of business was officialised by the law on the development of rural areas in February 2005. This law allows breeders, horse-breakers, trainers and equestrian centres to access agricultural and land-related support and assistance, as well as to benefit from tax breaks, including the application of a reduced VAT rateFootnote 23 (Bertrand-Ferrandis, Reference Bertrand-Ferrandis2007). Note that the reform did not change the tax system for non-breeder and non-trainer racehorse owners, or for breeders without land.Footnote 24 Many activities thus saw their VAT rate drop from 19.6% to 5.5%. This was particularly true for equestrian centres, which, among others benefits, were thus able to confer an improved status on their employees and to upgrade their facilities.
In 2006, the European VAT Directive stipulated that only services relating to foodstuffs for human and animal consumption, along with live animals, seeds, plants and ingredients normally intended for use in the preparation of foodstuffs and agricultural inputs, could qualify for the reduced VAT rate.Footnote 25 Reduced rates could therefore not be applied to the supply of pet animals such as dogs, cats, dwarf rabbits, guinea pigs and canaries, or to racing ponies and horses that are neither intended for human or animal consumption, nor used as agricultural inputs (European Council, 2006). Many European countries, including France, thus found themselves in breach of the Directive and were gradually brought before court following a complaint by another Member State. In France, the Senate backed the position of industry stakeholders by adopting a resolution which specified that ‘France does not share the European Commission's analysis, which aims to deprive the horse industry of the benefit of applying a reduced rate, on the grounds that not all horses are generally or usually intended for consumption’. The Senate in fact considered that ‘the reduced VAT rate, or else an intermediary rate, must continue to apply to the entire horse industry, including the production of equidae and related activities’. In parallel, the French Budget Act of 28 December 2011 increased the VAT rate from 5.5% to 7% for foodstuffs not directly consumable by humans. This applied to equestrian and horseracing activities benefiting from a reduced rate.
In 2012, the European Court of Justice ruled that by applying a reduced rate to horse-related activities, France had not properly implemented the VAT Directive. Therefore, France had to change its laws to avoid penalty procedures for late compliance. The reduced VAT rates could nonetheless still be applied for live animals ‘normally’ intended for use in the preparation of foodstuffs. It could also be applied to horse-related activities, provided they supplied services intended for use in agricultural production. The acquisition of stallions or broodmares for breeding purposes, as well as technical acts related to stud services, could benefit from a reduced VAT rate insofar as they constituted agricultural supplies or inputs for horse breeding. This was the case for breeding of all types, including the Thoroughbred horses. Conversely, a reduced VAT rate could not apply to operations related to horseracing, or to the activities of equestrian centres, which relate to competition, sport, recreation or tourism and not to the use of horses in agricultural production as understood by the Directive (Fraïoli, Reference Fraïoli2012).
The VAT rate increase from 7% to 19.6% for the horse industry can be a significant change for businesses whose customers may not be able to claim back the VAT and for whom the increase constitutes a net additional cost if entirely reflected in the price of the service. This is the case, for example, of most equestrian centre customers. The change has thus weakened horse industry businesses even though the taxation of this particular industry has not constituted a major issue for EU Member States. This has reinforced the sense of injustice felt by the industry (Myard, Reference Myard2011b).
Increasingly limited application of reduced VAT rates
European tax harmonisation is now seen as a major issue in addressing the budget crisis and deterioration of public finances in various EU countries. The Commission has noted that the key longer term factor contributing to the deterioration of public finances is ageing populations and the impact thereof on labour markets and on saving and consumption habits (European Commission, 2010). In view of this, government funding is likely to rely less on labour and capital income taxation than on indirect taxation, particularly through VAT. The increase in VAT rates is likely to continue as part of an EU drive for harmonisation and for strongly limiting the application of reduced rates. The Commission will soon be undertaking a detailed examination of all Member State VAT rates and their justifications (European Commission, 2010). The ensuing debate will see the repositioning of arguments in favour of reduced rates for equestrian activities, justifying in particular their value as a healthy sport and their agricultural character. Given the Commission's criticism of the fact that the use of reduced rates is often not the instrument best suited to the targeted objectives, particularly when it comes to promoting products seen as socially desirable, the outcome of the discussion will heavily depend on the arguments put forward to defend the case.
The long-term future of VAT on equestrian and horseracing activities therefore seems to be heading towards a return to standard rates, except for breeding, which benefits from grandfathered rights. Debate on this issue is, however, not over. It may lead to a shift if the arguments put forward by France and other countries successfully convince the Commission of the suitability of the reduced rate to reach targeted objectives, and of the absence of obstacles to the proper functioning of the internal market.
Given current trends, the foresight panel considered that it would be more relevant, in order to prepare for change, to envisage the increase of the VAT rate as a major trend for the next 20 years, rather than counting on the highly uncertain maintenance of a reduced rate.
Horse welfare regulation.
General regulation on animals and specific codes for certain equestrian activities
Human duties towards horses are regulated by laws that, for the most part, pertain to animal welfare in general. More specifically, although horses are covered by laws relating to livestock animals, they are unique in that they may in some cases be covered by other codes as well, such as the sport code, the flat race code or the harness race code. Such codes carry strong legal implications, insofar as they place a contractual obligation on the companies and stakeholders to whom licenses are granted. Unlike the various codes, laws concerning horse welfare evolve slowly. It was nevertheless thanks to horses that the first law on animal protection was passed in 1850. This law officially penalised public and abusive ill-treatment of domestic animals, particularly horses, which were often abused by coach drivers or in the mines that they never left, and were frequently mutilated on battlefields (Dupas, Reference Dupas2005). The law initially dealt with ‘animal protection’ and was first and foremost part of rural law, which included clauses on animal protection in breeding activities or activities involving animal use. However, it could also be used in conjunction with penal law in cases of ill-treatment and acts of cruelty, or with civil or even veterinary law. The rules applied depended on the status given to the animal. Today, animals are still legally classified as ‘chattel’, as opposed to ‘people’, and as such constitute a transferable good with no rights or duties. Yet, although animals have no rights, they do involve duties and constitute a source of responsibility for the owner or keeper (Verhaeghe, Reference Verhaeghe2006). Thus, since 1976,Footnote 26 the rural code stipulates that ‘as all animals are sentient beings, they must be placed by their owner in conditions that are compatible with the biological requirements of their kind, ill-treatment of animals is prohibited, the abusive use of animals is prohibited’.Footnote 27 Animal protection law is therefore underpinned by the idea of ‘animal sensitivity’, and came at a time when growing interest in animal protection was developing in society. The change calls into question the perception of animals as ‘chattel’, although it does not equate them to ‘people’ either (Le Neindre et al., Reference Le Neindre, Guatteo, Guémené, Guichet, Latouche, Leterrier, Levionnois, Mormède, Prunier, Serrie and Servière2009). Animal welfare can be broken down into a number of different areas, some of which are or may be subject to regulation. This is the case for the living and transport conditions that apply to all equidae. Distinct measures relating to the use of horses then apply, mainly concerning their use in competition and as food.
Living conditions
The duties of animal owners set out in the Rural Code draw on the foundations established by the 10 July 1976 law, according to which owners must place their animals in conditions compatible with the biological needs of their kind. Moreover, it is prohibited to subject domestic animals, or tamed or captive wild animals, to ill-treatment.Footnote 28 In this sense, French law complies with EU regulations. The Directive does not apply to animals intended to take part in competitions, exhibitions or cultural or sport events or activities. French regulation, however, stands out from the European Convention for the Protection of Animals kept for farming purposes (Council of Europe, 1976), ratified by France and the EEC in 1978 (Council of Europe, 1978), and from subsequent directives, through an approach that is focused far more on the obligations and prohibitions of breeding activities than on animal welfare as such.
In Switzerland, the laws are more stringent. In 2005, the federal parliament passed a new animal protection law that emphasises information and training for people who own animals and who care for them. Successive rulings have specified that, among other things, horses must not be kept tied up and that young horses must be kept in groups. Since 2008, keeping horses in paddocks fenced with barbed wire is also prohibited, despite the strong opposition to the measure, especially when horses are raised with cattle (Poncet et al., Reference Poncet, Boessinger, Guillet, Klopfenstein, König-Bürgi, Lüth, Martin, Montavon, Obexer-Ruff, Rieder, Rubli, Rüegg and Trolliet2009). In addition, a day-long certification course is mandatory for people wanting to own more than five horses for private use. To own more than 11 horses, professionals must follow a 22-day certification course (Equigarde®), which is also compulsory to practice breeding. Variations of these training courses have since been developed to meet breeders’ needs, over and above regulatory requirements.
Transporting equidae
The regulation pertaining to animal transport constitutes some of the oldest EU animal protection measures. The first recommendation by the Council of Europe in 1961 resulted in a Convention in 1968 (Council of Europe, 1968), which provided the foundations of current regulatory texts. From 1996, new rules stemming from the 1991 European Directive came into effect (Council of Europe, 1991). The text sets the maximum transport time for domestic equidae to 8 h, after which the animals must be unloaded, fed and watered, and be allowed at least 24 h rest in an approved facility before continuing their journey.Footnote 29 The most fragile animals – ill, injured, pregnant, newborn – are deemed unfit for transport unless it is necessary for veterinary care or for emergency slaughter, provided this does not entail additional suffering for the animals.
The amendment of all these rules in 2005 by the EU reinforced stakeholder responsibility. It also strengthened control of the norms and checks applied to transport vehicles, of the transport rules for extended durations, and of monitoring and licensing measures. Since 5 January 2007, European regulations have been applied in France for all horse transport of over 65 km as part of an economic activity.Footnote 30
Some lobbies, however, see this regulation as insufficient. This is the case of the ‘World Horse Welfare’ not-for-profit organisation, which, in 2011, submitted a report to the European Commission, the Member States and the Parliament with proposals to amend the most recent Council of Europe regulation on animal protection in transport. Among other things, this organisation defends the interests of horses intended for slaughter, generally of low value and therefore given less consideration. It proposes a total limitation of transport time to 12 or even 9 h (interrupted by a compulsory break past 8 h of transport) and new rules concerning watering animals during transport. The organisation considers that, given the distribution of horse slaughter facilities across Europe, the very long transport times endured by live animals and the suffering and risks of disease that this entails are unjustified.
European law and animal protection
The European Union considers livestock animal welfare under the framework of its Common Agricultural Policy. It has put regulation in place that is growing in importance over time, mainly targeting improved conditions for animals in modern intensive farming (Antoine, Reference Antoine2005). The EU has some of the strictest rules in the world in this field, and they are regularly reassessed to take into account experience gained and changes in scientific knowledge and in society's view of animal welfare.
The Treaty of Rome of 25 March 1957 placed livestock within the ‘agricultural merchandise and products’ category, in other words, the category of chattel. Changes in society and scientific discoveries on animal sensitivity subsequently encouraged the emergence of the notion of animal welfare. Thus, the Treaty of Maastricht of 7 February 1992 includes a declaration on animal protection that calls for animal welfare requirements to be taken into account in the drafting and implementation of community legislation in the CAP and in the fields of transport, the internal market and research.
In the Treaty of Lisbon, which came into effect on 1 December 2009, a new article was introduced. This article stipulates: ‘In formulating and implementing the Union's agriculture, fisheries, transport, internal market, research and technological development and space policy, the Union and the Member States shall, since animals are sentient beings, pay full regard to the welfare requirements of animals, while respecting the legislative or administrative provisions and customs of the Member States relating in particular to religious rites, cultural traditions and regional heritage’.
Horsemeat consumption and slaughter
Horsemeat consumption from a regulatory point of viewFootnote 31
Dietary restrictions in France are not subject to regulation beyond food-safety prescriptions. Therefore, even cannibalism, once a crime in Europe and still one in certain countries, is not prohibited in France, although the acts of horror and barbarity leading up to it are crimes. However, from 732 to 1866, horsemeat consumption was prohibited in Europe. The prohibition, based on the religious precepts of the time, as mentioned in the previous chapter, endured long after the Christianisation of Europe and the disappearance of paganism. In 1832, the value of horsemeat for feeding the most underprivileged sections of the population raised the question of legalising horsemeat consumption, which was practised illegally at the time. The position in favour of horsemeat consumption was later adopted by the SPA, which saw the attribution of a market value to animals sent for slaughter as a solution to the ill-treatment of old horses. At the time, it was not uncommon to see old animals die of exhaustion in the middle of the street under coach drivers’ lashes (Digard, Reference Digard2006). It took until 1866 for a police regulation to allow the sale of horsemeat, thereby encouraging free enterprise and breaking the ancient butcher's guild. Horsemeat consumption was then relatively popular, before declining as living conditions improved (Leteux, Reference Leteux2005). In 1967, to avert a potential salmonella risk, the use of horsemeat in school canteens and university dining halls was prohibited. Later, following a first epidemic linked to a parasitic disease – trichinosisFootnote 32 – regulation imposed a trichina diagnosis for all animals imported for slaughter. Owing to this measure and to reinforced checks in slaughterhouses, horsemeat is now authorised again, although consumed very little and by no means popular, even after a slight return to favour following the mad cow disease crisis (Poulain and Corbeau, Reference Poulain and Corbeau2002). Notwithstanding the constant decline in horsemeat consumption, it is once again a subject of controversy. The SPA, which advocated horsemeat consumption to protect animal welfare in the mid-nineteenth century, is now involved in a communication campaign against it, as a part of the organisation ‘un cheval, ça ne se mange pas’ (horses are not for eating), started by the Brigitte Bardot Foundation. In parallel, on 24 January 2010, several members of the French National Assembly tabled a bill seeking to confer the companion animal status to horses (Luca, Reference Luca2010). This would indirectly limit horsemeat consumption, seeing as France ratified the European Convention for the Protection of Pet Animals in 2003. It states, for instance, that ‘No pet animal shall be trained in a way that is detrimental to its health and welfare, especially by forcing it to exceed its natural capacities or strength or by employing artificial aids which cause injury or unnecessary pain, suffering or distress’. The proposed change of status is therefore strongly opposed by the breeding and racing industries, and by many other professionals who claim that such a measure would contribute to jeopardising both the horsemeat production industry and all the activities related to horseracing and sport. The bill was not passed and actually seems somewhat irrelevant in the sense that the ‘pet animal’ label is individual and could not be applied to the species as a whole. An animal becomes a pet by virtue of its purpose: to live with humans. Although numerous legal experts are reflecting upon this status issue, the primary aim is to find an alternative to existing legal categories that only distinguish between chattel and people (Antoine, Reference Antoine2005).
Slaughtering animals for meat
While animal slaughter regulations are designed to ensure that every precaution is taken to spare animals from any avoidable pain and suffering when slaughtered, it may also be an indirect means of limiting consumption, as seen in the American example described below. The first EU law on farm animal welfare, passed in 1974, concerned the stunning of animals before slaughter. Successive changes led to the 1993 Directive (Council of Europe, 1993), which is still in force, requiring inter alia that the animals be slaughtered in a slaughterhouse (Council of Europe, 2009).Footnote 33
This Directive, which has become obsolete given the development of new stunning and slaughtering technology, was very recently replaced by a new European regulation that came into effect on 1 January 2013 (Council of Europe, 2009). It makes it compulsory for the staff in charge of the animals and their slaughter to be certified, and provides a detailed definition of authorised stunning and slaughtering methods. It also addresses the construction, configuration and equipment of slaughterhouses by insisting on their coherence with the aim of animal welfare, and requires the appointment of an animal welfare manager within each slaughterhouse.
Beyond considerations pertaining to slaughtering conditions, not all horses can effectively serve for human consumption. This depends on drug treatments, some of which require a minimum waiting period after their administration, whereas others result in an irrevocable exclusion from human consumption. Owners can also, out of choice, definitively exclude their horses from horsemeat slaughter.Footnote 34
The 2006 to 2012 slaughter ban in the United States
The history of horse slaughter for human consumption in the United States is closely intertwined with that of horsemeat consumption in Europe. Before the Second World War, horses tended to be slaughtered and processed into feed for pet animals or for fertilisers. The promotion of horsemeat consumption in Europe after the war is what steered the United States towards the production of horsemeat for export (Lenz, Reference Lenz2011). Although horsemeat consumption was very limited in the United States, 100 000 horses were slaughtered in 2006 and 33 000 were sent to slaughterhouses abroad, mostly for export. However, following the second outbreak of BSE, media reports of the shift in European consumption from beef to horsemeat, mainly supplied from the United States, raised awareness in the United States of the existence of the local horsemeat industry for export. Various animal protection, breeder and veterinary organisations therefore petitioned the US government and obtained the ban of horse slaughter for human consumption through a law passed in 2006. The ban did not put an end to horse slaughter, but simply shifted it from the United States to Mexico and Canada. As a result, the price of horses (excluding upmarket horses) dropped between 8% and 21% from 2007, and cases of abandoned or neglected horses increased considerably, as did very long transport times (Shames, Reference Shames2011). The US administration also observed that this ban resulted in a loss of expertise in checks on horses to be used for meat. This highlighted the industry's weakening and ultimately led the law to be overturned. In November 2011, the US president signed a federal bill authorising the US Department of Agriculture to inspect the horsemeat intended for human consumption, thus paving the way for the return of horse slaughterhouses to the United States (Lenz, Reference Lenz2011). Contrary to all expectations, one of the fiercest opponents of horse slaughter, PETA (People for Ethical Treatment of Animals), approved the overturn of the ban, declaring that ‘the amount of suffering that [the ban] created exceeded the amount of suffering it was designed to stop’. The results of the measure banning horse slaughter are therefore fiercely debated, with lessons showing once again how complex the issue of the regulation of horsemeat consumption is. In North America, the term ‘slaughter’ is now used only for meat purposes; the term ‘euthanasia’ is used instead when animals are put down for other reasons (Lenz, Reference Lenz2011).
What regulatory framework for sport horse and racehorse welfare?
Regulating trials
Horseracing and equestrian sport are strongly implicated in concerns and regulations surrounding animal welfare, as they present certain dangers, the most significant of which relate to the coupling of speed and jumping, particularly over fixed obstacles. Speed exposes animals to risks of muscle, tendon and ligament lesions and in the most serious cases to lung lesions, or in extremely rare cases, to vascular ruptures resulting in death (Allen, Reference Allen2011). The dangers associated with jumping may be minor in cases of injuries related to limbs hitting obstacles, or far more serious for both the horse and the rider in the event of a fall. Eventing, which includes a cross-country trial with fixed obstacles, and steeplechases are consequently the competitions presenting the highest risk. As a result, changes were made to these disciplines in an effort to improve safety. From the 1980s, the growth of eventing at the club level brought about changes in track quality and safety. Although eventing has been present at the Olympics since 1912, in 2002 the International Olympic Committee considered excluding it on the grounds, among other things, of the danger it represents for both riders and horses. The Committee thus required a relaxing of cross-country rules, which came into effect at the Athens 2004 Olympic Games. Cross-country tracks are now much shorter and safer. In France, national federal regulation has also changed accordingly.
In the racing sector, the steeplechase, the most prestigious obstacle race, is one of the most strictly regulated events. It is also the most controversial type of race, particularly in the United Kingdom where the Liverpool Grand National represents a distance of over 7000 m comprising 30 obstacles. In 2011 and 2012, one fatal accident and three euthanised horses were considered sufficiently serious for animal protection organisations to once again call for the banning of the Grand National. Several factors were identified as reasons to discontinue the race (following a fall for instance), which led to specific changes being made (Proudman et al., Reference Proudman, Pinchbeck, Clegg and French2004). Use of the riding crop was identified as a factor contributing to falls (Pinchbeck et al., Reference Pinchbeck, Clegg, Proudman, Morgan and French2004), and its condemnation by animal protection organisations led to a complete review of the rules on crop use, limiting frequency and specifying use conditions (British Horseracing Authority, 2012). This remains a controversial subject both in the United Kingdom and France. There are also questions being raised around the issue of improving track safety. Reducing distances is a disputed means of improving safety as it may result in an increase of speed and therefore of danger. Racing authorities are nevertheless actively seeking to protect the prestige of the races and prevent their ban, as for instance in the Australian state of Victoria, where animal rights activists pressed charges following fatal horse accidents during steeplechases. Changes in regulations are being accompanied by research on the materials used to build obstacles, and specific research is also looking at ways to reduce rotational falls and cardiovascular accidents. Further risk prevention involves restricting races to healthy horses only, which implies drug screening and health checks.
‘Doping’ and ‘drug screening’
Doping is the use of any substance or process to artificially modify performances, and that may be detrimental to the sporting ethic or to animal welfare by increasing risks of accidents or exhaustion (Toutain, Reference Toutain2005). In the case of racing, anti-doping measures seek to ensure the lawfulness of the races and the health of the horse because a racing horse must be healthy to ensure its safety and that of the jockey. They are managed by the French National Racing Federation (FNCF), while regulatory and disciplinary authority is the remit of oversight agencies controlled by the Ministries of Agriculture and of the Interior. For equestrian sport, the anti-doping effort is primarily underpinned by concern for the fairness of competitions and for animal welfare.
The anti-doping efforts in equestrian sport: an approach derived from the world of human sport
Although doping in sport has existed for a very long time, the first anti-doping law in France was only passed in 1965. In 1989, anti-doping legislation was applied to animals taking part in all competitions organised by sport federations approved by the Ministry of Sport, particularly the FFE. The disciplinary rules of the FFE comply with French law and were incorporated into the French Sports Code, which covers laws relating to the practise of sport. The Code sets out the organisation and execution of monitoring procedures and the disciplinary sanctions incurred. International competitions come under the authority of the Fédération Equestre Internationale (FEI), the international federation for equestrian sport. The FEI has veterinary regulations that lay out a code of conduct for the welfare of horses and stipulate the rules concerning horse health and hygiene. It organises veterinary checks for international events and performs drug screening. It also sets the rules on horse treatment in competitions. All affiliated national federations must adhere to a further code of conduct on horse welfare, which particularly insists on the efforts that must be made for animals to be treated humanely once their career is over. Unlike the FFE, the FEI permits medication for horses in competitions provided the pathology and treatment do not jeopardise the animal's health, and that its welfare is ensured. International regulations are therefore more flexible than those of France (Lambolez, Reference Lambolez2011) or Switzerland which also has a zero tolerance policy, whereas the US Equestrian Federation's policy is more lax. In a few countries, including France, rider organisations are campaigning for the authorisation of therapeutic use exemptions (TUE), a system used with humans. In Switzerland, one of the benefits of TUE being highlighted is the ability to treat horses on-site, even at competitions themselves, in particular to allow them to recover more fully from transport, which is particularly trying. The president of the Swiss Equestrian Federation has voiced his opposition, however, arguing that rather than concealing the fatigue of horses, it is best to plan journeys appropriately and arrive at the competition site a day earlier so as to allow for relaxation work and massages (Conti, Reference Conti2009). The anti-doping effort is therefore very closely associated with animal welfare, especially through accident prevention, which also has consequences for rider safety. Anti-doping efforts and screening measures are becoming more sophisticated, allowing for the detection of ever smaller quantities of substances from an increasingly wide range of molecules. However, advances in the pharmaceutical industry and progress in gene therapy are leading to the development of new doping methods.
The anti-doping effort in horseracing: strict regulation to guarantee the regularity of races and prevent accidents
From 1903, the racing code of the Société d'encouragement pour l'amélioration des races de chevaux en France (Society Promoting the Improvement of Horse Breeds in France) stipulated that ‘it is prohibited to administer or have someone else administer any stimulant, whether in the form of pills, injections or other, to a horse on the day of the race or in the run up to the race’. The principle that ‘everything is prohibited in races’ still applies today and underpins the anti-doping effort known as ‘drug screening’. The French Racing Code prohibits certain substances during a horse's career, including during resting periods, whereas others are prohibited in competition but authorised in training, for medical reasons. Apart from pure antiparasitics,Footnote 35 vaccines and most antibiotics, everything is banned. Checks are performed to verify the absence of all prohibited substances from the horse's body, namely, in its urine and blood. Routine checks are now systematic; 99% of races are now controlled, against only 76% in 1999, and horses may be checked at any time during their life, even after being withdrawn from competitions. In 2011, of the 30 839 samples taken, only 0.23% showed positive results liable to sanctions, including disqualification, a banning from competing, and heavy fines or even withdrawal of the trainer's licence. The pressure from these regulations has had recognised positive effects and French regulations have been imitated in other countries. Doping is also very closely monitored among jockeys, who may be tempted to lose weight rapidly to meet stringent weight requirements by taking diuretics or by using cocaine for its appetite suppressing and stimulating effect.
The gradual convergence of regulation and codification
The trends presented here reveal that concern for horse welfare is now taken into serious consideration (see IV.2.1(2) ‘The human–horse relationship and animal welfare’). These concerns are closely linked to the prevention of accidents for horses and riders, and to positions on the use of animals for meat. There are two parallel systems concerning horse welfare: one is under the direction of the EU and is very general, making little distinction between horses and other livestock, whereas the other one is more specific to the horse industry and adapts to changes in the society in which the stakeholders live. Although both systems deal with animal welfare, they are not necessarily underpinned by the same values or representations of animal welfare. There are consequently many controversial horse riding issues that offer glimpses of the possibilities, or at least the motivations, for future change in the world of horse riding. This can already be seen in the commitment to animal welfare, as required by the FEI of its members, particularly at the end of an animal's career. The relationship is not so straightforward in the world of racing, although initiatives are being taken thanks to the industry's financial resources, by investing in retirement homes for horses. Unlike other animals, in the case of horses the management of their end-of-life or end-of-career is an important area of welfare concern. The use of horses for meat is a serious issue that raises questions of transport, slaughter, the animal's status and related codes of conduct. Changes in horse use will certainly justify extending the rules of use beyond sport and racing. Animal ownership, for example, is increasingly being regulated insofar as the courts are sentencing more and more people for animal abuse, whether the abuse was intentional or not, or was related to poor knowledge of the needs of horses or not. The regulation on medication, though already stringent in France, will likely also be reinforced, along with its means of control, particularly through veterinary checks. Beyond the topics discussed here, the field of regulation remains very broad and open: will France one day ban the use of animals in circuses? Will it be spared from the phenomenon of large numbers of abandoned animals seen in other countries such as Ireland (Leadon et al., Reference Leadon, O'Toole and Duggan2012), owing to its effective identification system?
Policy and regulation: synthesis and outlooks
To build the microscenarios of the ‘public policy and regulation’ section, the panel imagined a variety of outlooks for the driving forces described above, basing its choices on past and current trends, signs of possible change and potential shifts to 2030. It then selected the combinations of assumptions that it deemed most relevant for the foresight analysis – those that were plausible, coherent and interesting for envisaging the future. These combinations form the microscenarios of the ‘public policy and regulation’ section. Generally speaking, the panel considered the redefinition of the national government's involvement in the horse industry to be an irreversible process leading to a drop in subsidies, although with possible support for the industry from local authorities. That is not, however, to suggest a total disappearance of national involvement; all the various future projections see the State maintaining its role in the field of human and veterinary public health in connection with horses and their use. Whereas the first microscenario is based on currently observed trends, the following two envisage a shift away from the present situation. They are based on changes in society, characterised in one case by priority given to quality of life, and in another by a significant increase in animal welfare concerns. The former explores the development of support for the horse industry from local authorities, in connection with the local importance and role of horses; the latter stresses the possibilities of reinforcement of animal welfare regulation, by sometimes extrapolating to extreme cases.
Microscenario 1: the state disengaged from the horse industry
Under the weight of very heavy budgetary constraints, and concerned by more general social and economic priorities, the State no longer provides the industry with direct support. It is, however, still heavily involved in food-safety monitoring. To ensure the maintenance of the racing sector, which provides it with tax income, the government continues to manage and regulate horserace betting, granting the industry a return of the order of 5% on bets taken by the PMU. In France, as well as in the other countries of the EU, horse breeding, equestrian activities and their intermediaries may not benefit from a reduced VAT rate. Regulation in the fields of animal welfare, the environment and the protection of users evolves slowly and does not limit the development of activities. There are no changes in the regulation of animal transport.
Microscenario 2: decentralised government action supporting initiatives encouraging the use of horses
After directly assisting the industry to become autonomous, the national government shifts responsibility for the horse industry to local authorities and regions. Local government action considers horses to be a resource, in view of their positive impact with regard to the environment and more generally to well-being in society. Local authorities support initiatives encouraging horse use through contracts with suitable local economic stakeholder professionals. The development of educational, social, medical, cultural and environmental services in particular is encouraged.
At the national level, the government decides to resume its monopoly on gambling and sport betting in light of the public health concerns over gambling addiction. It uses part of its levies on betting stakes to improve public health, and transfers the rest to local authorities to fund social, educational, medical, cultural or environmental activities encouraging the use of horses. To be in line with its public health policy, the government further commits to limiting the growth of gambling and sport betting. In return, to support the racing industry whose development is curbed, it grants a high rate of return to the industry, corresponding to 8% of the stakes.
Microscenario 3: a financially withdrawn regulatory State
The State has gradually disengaged from the industry's economic development and has opted for total liberalisation of horserace betting, going so far as to privatise the PMU and end its monopoly on all offline betting. It focuses its attention on food-safety monitoring and the regulation of horse-related activities. In view of the societal pressure to promote respect for animal welfare, regulation concerning equestrian and horseracing activities is reinforced considerably. Steeplechases and other obstacle races are banned, the effort required of horses is limited and the entry of horses into competition is no longer possible before the age of 3, to allow them to be fully grown. Strong pressure against horse slaughtering has led to measures seeking to prohibit horsemeat consumption and, in any case, owners no longer consider the possibility of sending their horse to the meat sector. To avoid the ill-treatment of horses in general, whether intentional or not, people acquiring a horse must attend a short certification course and declare themselves to a veterinarian or an authorised referent professional. Reproduction is also regulated by issuing breeding permits to suitably qualified candidates.
Equestrianism and horseracing
A unique feature of the horse industry is its range of very diverse activities including competitive sport, leisure, racing, traction, education and rehabilitation. From riding lessons to races, and horse trekking to the organisation of sporting competitions, there is a wide range of horse-related activities offered by numerous outlets possibly involved between the production of a horse and its final use. The future of the industry will partly depend on the strategies and product innovations put in place to meet customer needs.
Among these outlets, equestrian centres play a particularly important role due to the popularity of horse riding. Riding has become more popular as equestrian centres have started offering more choices and have improved their facilities and teaching methods. Changes to pricing structures determine its accessibility. For the government and its involvement in equestrian centres, horse riding is intrinsically linked to competitive sporting events, and thus to its popularity and its media coverage. Beyond government initiatives, riders can also benefit from an equestrian activity marketplace that has grown and diversified. Horseracing, on the other hand, is structured completely differently. For many years, growth in the horseracing sector was inexorably tied to growth in betting. Limits to this growth have begun to appear, both in terms of finding suitable horses and in finding owners to buy them. Consequently, the panel considered the following as the most important influences on the future of the French horse industry:
-
• equestrian centre activities;
-
• the role of competitive sport and media coverage;
-
• activities available outside equestrian centres;
-
• horseracing activities.
Equestrian sports and horseracing: trends and future outlook
Equestrian centre activities.
Can the number of equestrian centres continue to increase indefinitely?
An ever-growing number of equestrian centres, medium in size and with stable membership figures: Since the advent of pony riding, equestrian centres have generally grown as a function of increased demand. Over the course of the last decade, both club and event organiser membership in the FFE has steadily progressed by about 5% per year, in line with the increase in horse-riding member numbers (Figure 4). Equestrian centre membership has been relatively stable over time, with an average base of just over 80 members. Increased growth over 2007 to 2010 was followed by a downturn in 2011, suggesting a relative decline in equestrian centre membership.
Growth in equestrian centres, members and membership per centre (FFE).

The findings from 2006 to 2008 studies by the Observatoires Économiques Régionaux (OER; excluding Île-de-France) corroborate this rate of growth and clearly demonstrate that membership numbers increase when an equestrian centre is more established (Bogaert and Heydemann, Reference Bogaert and Heydemann2010; Heydemann et al., Reference Heydemann, Boyer, Couzy, Dornier, Madeline, Morhain and Ragot2011). The relative stability in membership numbers per FFE club can therefore be explained by the regular establishment of small new riding clubs.
Consequently, it may not be sustainable to pursue the current growth rate. A decline, or even a sharp fall, in membership numbers cannot be discounted, should the economic climate continue to worsen. In such a case, the saturated market would become strongly competitive, a situation hitherto largely unheard of, despite some early signs of this trend in regions with more centres such as Île-de-France.
Peri-urban areas favoured: Growth did not, however, occur across France uniformly (Figure 5). From 2001 to 2011, the number of FFE member clubs and organisations increased less strongly in more densely populated areas, in particular in the Greater Paris Region where the number of equestrian centres in fact decreased.
Changes to FFE membership numbers by population density of French departments, only departments with significant change shown (FFE and SSP data – statistics and forecasting service of the ministry responsible for agriculture – numbers refer to French departmental code number – 92, 93, 94 and 75 being Ile-de-France departments).

Equestrian centres must be located at a reasonable distance from sufficiently large populations. A 2008 geomarketing study prepared for FFE showed that 58% of riders live within 13 km of their club (Idéactif, 2008). Equestrian centres also naturally require a certain amount of space. While the study revealed that ridership was inversely proportional to urbanisation rates, it also highlighted the fact that more than one quarter of riders – relatively young and affluent – lives in peri-urban towns with fewer than 10 000 people. This is in line with comprehensive studies on horses and horse-related leisure activities in France (Vial, Reference Vial2008).
There are, therefore, continued avenues for potential growth in burgeoning peri-urban areas. The potential for growth is more limited when population densities increase and, after a certain point, they may curb development altogether.
Rapid growth of the private sector: In the 1970s, 70% of equestrian centres were voluntary associations.Footnote 36 The situation has since been reversed; between 2001 and 2011, the percentage of private sector businesses rose from 55% to 65%. Equestrian clubs were more affected by this change; event and race organisers have continued in large part as voluntary associations. As riding has become increasingly market oriented, the quest for rider/customer satisfaction has brought positive changes (Tourre-Malen, Reference Tourre-Malen2009). When compared with the 1970s, centres are more customer focused, with new teaching methods, better safety and hygiene standards, improved facilities and finer horsemanship skills. OER studies revealed that voluntary association clubs tend to be larger than private clubs; smaller clubs must be more mindful of their profitability. When coupled with new teaching guidelines, the rise of small clubs has driven change in equestrianism by encouraging contact between riders and horses outside of riding, in activities such as grooming and saddling.
If equestrian centres are to return to more densely populated areas, a reversal, or at least a slowdown, of the ongoing trend towards smaller centres is necessary. Small businesses are unlikely able to bear the high structural costs of operating a riding centre in an urban setting. With the private sector stifled by land pressure, a resurgence of voluntary associations could, with external support and guidance, make riding more accessible in the context of a solidarity-based economy.
Riding services have grown and changed radically over past decades.
New breeds and teaching innovations
Growth in youth ridership is the result of a fundamental technical change to the French equestrian landscape: the arrival of ponies. Since the 1980s, pony clubs – for the most part small, one-person businesses – have been established in many cities and towns. FFE licensing gives an indication of the rise in pony riding; in 1990, there was 1 pony licence earmarked for every 4 horse licences, and by 2011 there were 7 for every 10 horse licences. The introduction of ponies was accompanied by significant changes in teaching methods. The changes were aimed at maintaining ridership levels, given the high attrition rates seen in the first year of lessons. A military-inherited equestrian culture has come to be replaced by a teaching style focused on fun and successful achievement centred on the learner, but also accompanied by a lessened knowledge of horses and their behaviour (Digard, Reference Digard1995).
With the ‘old-fashioned’ effort involved in learning to ride horses, it is unlikely that they will regain the ground lost to ponies unless regular riders once again aspire to high-level riding. This would run against the shift towards recreational riding, on ponies, by a young ridership in perpetual turnover.
An ever-expanding number of disciplines
Data from the FFE do not directly track the sporting disciplines offered by equestrian centres. Diversification can be seen, however, through club-organised competitions and through certifications, known as Galops, being issued. Between 2001 and 2011, the number of club-level competition disciplines increased sharply (Figure 6) as did the number of clubs involved in the various disciplines. The diversity on offer can thus be well attested; the proportion of non-Olympic disciplines has grown substantially. It should be noted that certain disciplines, endurance and TREC,Footnote 37 in particular, require large open spaces and cannot be offered by all clubs. The same is true of certain disciplines requiring specialised facilities such as working equitation.
Clubs, per discipline, involved in club-level competition 2001 to 2011(FFE). Note: Endurance underestimated in 2001.

Graduated national riding certifications in France are, for the most part, Galops de cavalier delivered to comprehensive riders, although Galops for specialised disciplines exist for events such as combined driving, trail riding and vaulting.Footnote 38 Between 2001 and 2011, the share of specialised Galops nearly doubled, rising from 3.3% to 5.6%. The number of specialised disciplines also rose, from 12 to 14. These figures indirectly attest to new training courses offered by equestrian centres. Of the newly introduced specialised Galops, the certification in natural horsemanship, introduced in 2005, quickly attracted considerable interest. In 2011, natural horsemanship represented 10% of all specialised certifications. Following a period of relative reticence, the FFE made a deliberate choice to recognise the growing discipline, leading to increased interest in natural horsemanship and the growth of dedicated equestrian centres (Digard et al., Reference Digard, Ould Ferhat, Tourre-Malen, Caporal and Vialles2004).
At present, the move is clearly towards increased diversity for an ever-expanding clientele, with growing interest in natural horsemanship. Should contact with horses become more important than their use, a kind of standing equestrianism may develop. Change is likely only if there is a return to performance culture and a renewed interest in major, mostly Olympic disciplines, in particular show jumping.
The average hourly price of riding has changed little when inflation is factored out, although there are significant disparities.
The hourly price of riding seems to have changed relatively little when examined in constant euro rates (Table 1). There are a number of factors involved, including cost savings generated from the switch from horses to ponies and the 2005 VAT reduction.
Available data on hourly riding rates, 1980s to 2000s
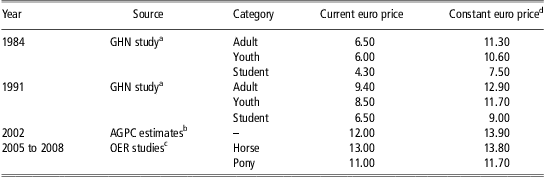
aAverage sample of 58 equestrian centres.
bBased on member revenues.
cExcluding Île de France.
dCalculated with a 2011 baseline using the French INSEE consumer price index including tobacco.
Cited figures are averages only, however. Widely varying prices seem to be the norm. OER studies across a large number of establishments highlight the importance of this disparity; 90% charged between 10 and 20 euros with an average cost of 12 euros (Bogaert and Heydemann, Reference Bogaert and Heydemann2010).
Although the figures and their relevance could be debated, there seems to have been, on average prices at least, neither upward nor downward pressure. It would appear that diversified price structures followed on from the diversification of courses offered. As the market matures, however, increased competition may affect this.
The future of equestrian centre offers
Recent decades have seen increases in the number of equestrian centres along with major qualitative changes, most notably the increase in youth ridership. The significant changes have led equestrian centres to introduce new breeds and facilities and adapt their teaching styles, but they have faced little competition, owing to a continuous client base increase (Marry, Reference Marry2009). Accordingly, equestrian programmes will continue to adapt to meet demand, which will itself be shaped by the economic environment and by social change.
To date, investments have for the most part gone towards horse stabling rather than towards rider facilities or comfort. Strong growth leading to increased competition, or even the return of full-rate VAT, may strongly reinforce this trend. Low-cost centres with limited facilities would be established to cater to a transient clientele more interested in contact with horses and the recreational aspect of riding than in a desire to improve their skills. Low-cost centres may exist alongside riding centres that are customer focused and offer a range of high-quality services to dedicated riders. Pushed to an extreme by persistent economic downturn, centres pursuing wealthy and demanding but scarce clients, offering an even more sophisticated range of services, may find themselves alone in the market.
In contrast to these changes based largely on economic drivers, social change may make equestrian centres more multipurpose. Change, for example in the role of horses in personal growth and in environmental protection, and increased concern for animal welfare, may see centres developing a broad client base that includes businesses, people with disabilities and others. Corresponding legislative change could give equestrian centres training and horse expertise functions beyond their traditional riding instruction role.
The role of competitive events and media coverage.
Competitive events and activities
Competition is organised almost exclusively at a national level in France and plays a significant role in structuring the horse industry. In the early 2000s, the number of certified riders also certified for competition progressively increased and levelled off at around 20% mid-decade.Footnote 39 Club-level competition in particular is increasingly popular. The number of riders certified for club-level competition increased by a factor of 2.6 over the same period, reaching 76% of the total in 2011.
Show jumping remains the keystone competitive event. In 2011, 66% of events organised at all levels were show jumping events (Réseau REFErences, 2011b), although this figure has been falling over the past 10 years because of growth in other disciplines, notably endurance (Figure 7).
Share of individual disciplines in competitive events at all levels, 2001–2011 (Réseau REFErences, 2011b). Note: Endurance underestimated in 2001.

Further attention must be given to distinctions among the various levels of competition: professional and amateur on one side and club-level competition on the other. Whereas club-level competition grew very strongly, professional and amateur competition grew only moderately, by factors of 5.72 and 1.7, respectively, over a 10-year period. The most significant increases were seen in non-Olympic events, which rose nearly 10-fold, for both club-level as well as professional and amateur competitions (Table 2). Growth in non-Olympic events was very strong, despite the underestimation of endurance events in 2001 and its adverse impact on these numbers.
Relative increase, by discipline, in competitions held, 2001 to 2011
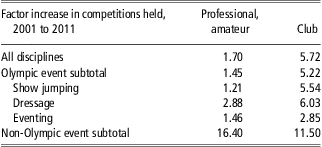
Note: Endurance underestimated in 2001.
At club level, which is far more widespread than professional and amateur competition, the most popular non-Olympic events in 2001 were mounted games, combined driving and hunter. In 2011, hunter, mounted games, TREC, horseball and endurance were most popular.
Media coverage of equestrian events
Equestrian events receive little media attention, even at international levels such as the recent London 2012 Olympic Games. There are a number of contributing factors, including a poorly suited format, often lengthy competitions and a dearth of publicly known sports figures. Equestrian events attract prestigious sponsors such as Hermès, Longines and Rolex, but their sponsorship goes to events rather than to riders, even the best of whom remain largely unknown. Equestrian enthusiasts tend to be well-off connoisseurs and are relatively few. There is a lack of dedicated equestrian facilities large enough to host sufficient spectators. Moreover, equestrianism is perceived as discreet and the aura of luxury that competitions convey is not likely to appeal to a wider audience. At present, media coverage remains geared to riders who can choose from a growing number of magazines, the oldest and most popular of which has been around for 40 years.
There are signs of change, however. The French television network, Equidia, has added a second channel focusing entirely on equestrian events, Equidia Life, to go alongside its horseracing channel, Equidia Live.
The future of competitive events and media coverage
With equestrianism interesting a wider and more diverse population, the development of two types of equestrian competition may be envisaged, high-level competition on one side, and more entertainment-based competitions with greater appeal on the other. If social change increases the priority given to personal development, environmental protection or animal welfare, competitions may move towards disciplines focused on action, teamwork, educational value and contact with horses.
The international growth of Olympic disciplines, notably show jumping, could reignite interest in high-performance competition. With countries as yet not largely involved in equestrianism piquing an international market for high-level equestrians, young riders dreaming of elite, footballer-style careers may find prospects opening. This change would seem more likely in a climate of economic uncertainty, leading to a renewal of traditional riding and of competitive spirit. In such a case, media coverage would be specialised and international. Equestrianism would remain largely out of the public eye, of interest to connoisseurs and occasional sponsors targeting a small, elite clientele.
Alternatively, should interest in equestrianism develop massively, media coverage would be geared to the general public. Professional riders could promote equestrian sport and competition formats could be adapted to attract wider interest.
Activities available outside equestrian centres.
Equestrian tourism and independent riding on the rise.
Popularity of equestrian tourism growing
The number of FFE tourism certifications issued is on the rise, highlighting the importance of equestrian tourism and the changes taking place within this sector, with some riders doing so independently and outside of any regulatory framework. Enthusiasm for equestrian tourism has influenced the practices of this brand of ecotourism. In the early 1960s, small groups of riders, who created the National Equestrian Tourism Association, would stake out on long treks with a minimum of comfort and a maximum of improvisation. This early foundation was gradually superseded by a new, more pleasure seeking type of rider (Digard et al., Reference Digard, Ould Ferhat, Tourre-Malen, Caporal and Vialles2004). ‘Travellers’ became tourists, in search of an organised adventure. They use marked trails and guest houses for relaxed and comfortable journeys. Trips are organised in short excursions rather than long circuits and they promote social interaction. Starting in the 1990s, studies begin noting the role of horses in rural tourism (Rossier, Reference Rossier2004). A 2010 socio-economic market analysis of the equestrian tourism industry revealed a market made up of over 2000 very small, mostly unspecialised, multifunction (riding instruction, tourist activities, even food and lodging) equestrian operators (Atout France, 2011). The most popular activities were riding lessons, offered by 53% of operators and 29% of horse-riding excursions, and trail rides and treks were offered only by some 17% and 12%, respectively. Most activities were geared towards experienced riders, with few activities designed for tourists or occasional riders. A second socio-economic study of equestrian tourism and recreation clientele prepared for the National Equestrian Tourism Committee (CNTE) found that equestrianism was practiced for varying reasons and with differentiated needs (Atout France, 2011). The study showed that the average person's involvement in equestrianism falls in the ‘equestrian tourism and recreation’ category. There is a strong connection between recreational activities practised and learned in clubs and equestrian tourism activities outside of clubs requiring assistance and advice. There is still a need for industry supervision. An ‘equestrian tourism centre’ certification was introduced some 20 years ago by FFE and CNTE to foster professionalism and encourage quality service among operators in France. The number of certified centres has been increasing constantly, yet by 2010, only 305 equestrian tourism operators had met certification requirements (Atout France, 2011). There has been considerable effort on the part of national agencies, decentralised CNTE agencies in particular, and local governments to improve equestrian tourism infrastructure (Boyer, Reference Boyer2012), with over 16 000 km of marked trails across France now. By way of example, horse riding circuits created by the Jura du grand huit association in 1987 have increased from 750 km to 1700 km in length and operate in partnership with 34 guest houses and 16 equestrian centres (Atout France, 2011). There is an even larger regional network available, known as the ‘Grand Traverse of the Jura’, bringing together trail networks of neighbouring departments as well. The move towards professionalisation has been boosted by the CNTE publication of guides on designing equestrian itineraries and lodgings and on trail marking, and the introduction of a training course for FFE-certified volunteers on trail marking in 2011 (Boyer, Reference Boyer2012). There are additional variations in equestrian tourism that have developed recently on a small scale, including horse-drawn caravans and hiking with packdonkeys. These activities are largely centred in south-eastern France where an association based in the Cévennes called Sur le chemin de R.L. Stevenson paved the way in 1994 (information from a 2009 study on the donkey industry (Atout France, 2011)).
Current data on independent horse-riding
A TNS Sofres–FIVAL study looking at the period 2002 to 2007 estimated that there were nearly 2.2 million regular or occasional riders in France (TNS Sofres and FIVAL, 2007). This is in contrast to the 0.7 million FFE-certified riders in 2011. Horse-owning uncertified riders are potential users of equestrian services, horse boarding in particular. In 2005 to 2008, the OER found that stabling represented a substantial part of equestrian centre revenues (Bogaert and Heydemann, Reference Bogaert and Heydemann2010). In large part, boarded horses belonged to owners who ride frequently, although not always, at the centre. Occasionally, horses are boarded in equestrian centres as a part of the owner's herd. An exhaustive study carried out in four small but contrasting areas confirmed the predicted high number of horses owned independently (Vial, Reference Vial2008; Vial et al., Reference Vial, Aubert and Perrier-Cornet2011). The studies also looked at the way independent owners used their horses, whether for personal riding or commercial gain. A wider distribution of equines is possible with the increased availability of agricultural land, as owners would be able to meet their forage and fodder needs autonomously. Conversely, equestrianism focused on wealthy riders would see horse boarding become more important. With independent riders already forming a substantial portion of the riding population, there are considerable implications for businesses offering equestrian services.
Other horse-related activities.
Renewed use of draught horses for traction slow to take root
Other horse-related activities are diverse and are widely disparate in terms of actual economic value. At present, the most economically important activity is valuable in a way unlike all other segments of the industry: horses add value to the grassland areas they maintain. Draught horses still play a significant role in this regard, and 30% of France's broodmare population. Draught horse populations in France are heavily concentrated in highland areas, making use of otherwise underproductive grasslands for meat production. In 2000 to 2010, draught horse populations declined 13%, whereas the overall national horse population remained stable (Réseau REFErences, 2011b). Draught horses are still strongly associated with meat production. Given that horsemeat consumption is decreasing, the value attributed to draught horses in on the wane following a period of growth in previous decades. National and regional stakeholders are therefore seeking new uses centred on animal traction, albeit with limited success (Conseil du cheval Midi-Pyrénées, 2011; Réseau des acteurs d'espaces naturels de Rhône-Alpes, 2010).
Having disappeared from cities and towns as mentioned in ‘The value of horses for territorial development’, horses have been reintroduced by municipalities looking to capitalise on their kindly and environment-friendly image. A recent study found ∼40 innovative municipal initiatives using horses, included using renewed use of horses in urban centres (Wanneroy, Reference Wanneroy2011). In October 2010, Cheval Magazine estimated between 130 and 200 municipalities in France made use of horses in some way, although not all municipalities continued to use them. The few case studies on the matter show that, when making horses a permanent part of the public sphere, there is a trial-and-error phase to address organisational and technical issues. Such initiatives, while not always cost-effective, do generate a real social and environmental impact. The reintroduction of horses into urban areas will remain limited by economic imperatives unless new social drivers can justify their cost.
Animal traction is also used for agricultural and forestry work. In the 1980s, animal traction was still used by some while others were rediscovering it (Rossier, Reference Rossier1984). A study undertaken at the time revealed that users of horse traction were generally older, working smaller landholdings and, for a slim majority, with horses as their only form of traction. The problem of training young people by those with experience was underscored. Given possible interest in animal power, a specialised certification for users of hitch horses was introduced.Footnote 40 In 2010, there were six centres offering this training.Footnote 41 New, updated and modernised horse-drawn equipment is also now available. Vineyards and market gardens are the biggest users of horse traction as they both require precision work.Footnote 42 , Footnote 43 Horses are also used, alongside conventional equipment, for forestry haulage in difficult terrain.Footnote 44 Although there are no data available to quantify these uses of horse traction, they remain limited. According to France Trait, only a small percentage of draught horses could find an animal traction use, be it in a rural or an urban area.
Underexplored avenues for horse mediation and therapy . Horses have a well-known beneficial role in education, personal development and rehabilitation (see the Recognising the educational value of horses section). Equine therapy, using a horse as an instrument for physical and psychological treatment of an individual, has become a discipline in its own right. Recognition of equine therapy has led to the development of training for practitioners and the introduction of dedicated facilities in equestrian centres for people with disabilities. There are a number of specialised institutions offering in-depth equine therapy training, including the French Equine Therapy Association, the National Para-Equestrian Federation and the preeminent National Federation of Horse Therapies, whose courses are reserved for health and social care diploma holders with a Galop 3 certification. According to organisations involved, the need for equine therapy far outstrips the available supply. In general, equine therapy is practised outside of the private sector. Consequently, increased development of the sector is not likely without a move towards a more solidarity-based economy. To meet the needs of people with disabilities wanting to ride, the FFE introduced a para-equestrianism certification in 2009 designed to familiarise riding instructors with sports for people with disabilities. There were 70 instructors in the first graduating class in 2010, a rather low figure in relation to the FFE's 7000 total instructors (Fondation Adrienne et Pierre Sommer, 2010).
Other horse uses, success stories and new trends . Over the years, there has been considerable expansion of horse-related events, including visits and performances in both national institutions (Cadre Noir, Chantilly, Haras national du Pin) and private institutions (Puy du Fou, Zingaro), shows (Paris Horse Show, Equita’ Lyon, Avignon Cheval Passion), gatherings (Equirando) and competitions (Generali France Open, Mondial du Lion, Franche Comté terre de traits). Available listings for horse-related events clearly demonstrate their growing popularity (Atout France, 2011; Cordilhac, Reference Cordilhac2012).
Also coming to light are the first signs of a trend towards a perception of horses more as pets than as livestock. There are now ‘retirement homes’ for horses, mostly rescued from horseracing or retired from service in the Republican Guard, and pensions for elderly horses owned by individuals (Digard, Reference Digard1995). A very recent development is the appearance of ‘equility’,Footnote 45 a new discipline related to natural horsemanship, representing the first evolution in this direction (Digard et al., Reference Digard, Ould Ferhat, Tourre-Malen, Caporal and Vialles2004). Trainers stand next to their horse and use voice prompts, similar to the techniques used for show dogs. The future of these practices will depend largely on the way in which people's attitudes towards them change.
The future of activities available outside equestrian centres
Over the last decade, more people have become interested in equestrianism and equestrian tourism has become more widespread. Equestrian shows and performances have also become more popular, although on a smaller scale. Use of other practices remains rather limited, although they often generate considerable goodwill. The value added by draught horses to grassland areas is a special case. It continues to have an important value, but is starting to decline. Such diverse trajectories do not permit any overall conclusions to be drawn as to the future of activities available outside equestrian centres. What is most likely is that changes to the economic or social landscape will reinforce some uses and weaken others, and have knock-on effects on the organisation of certain sectors of the industry.
Continued economic downturn would favour horse use by more affluent consumers. This would bolster growth in personalised services for independent horse owners, such as instruction, training, horse care and luxury equestrian tourism. Limited resources would make horses too expensive to use for traction in rural and urban areas and to maintain grasslands. In this case, the diminished role of riding and traction would make horse ownership a private affair, with horses seen as pets. As a result, a marked decline in the horse industry would be seen. With horses as occasional riding or travel companions, owners would only make use of horse-related services and businesses when necessary. Taken to its limits, this vision could see the creation of horse parks where animals range freely. At the other end of the spectrum, new horse-based activities for personal development and environmental protection could lead to growth in this area. Independent owners and riders could organise themselves under the aegis of a voluntary association that operates free of existing infrastructure. Under market-oriented conditions strongly concerned with cost-effectiveness, even cities and towns with a strong equestrian heritage would limit the municipal use of horses, and favour instead the development of equestrian performances. If, however, social change champions personal development and improved quality of life, the sociable dimension of equestrianism will be reinforced through, for example, outdoor activities or cultural heritage discovery. Equine therapy would assume its rightful place. Horses would become economic drivers, developing animal traction in urban areas and for agriculture, and would continue to be used to maintain grasslands, despite their declining use for meat.
Horseracing activities.
Racing and racecourse activities
Racing has progressively developed in line with growth in bet value. Between 2000 and 2010, the overall average annual growth rate was around 1% (Figure 8).
Number of competitions, races and horse starts, 1999 to 2010 (FNCF).

When the growth rate for PMU-organised races is considered separately, however, it is more than nine times higher, and by 2010 represented 63% of all races (Augereau, Reference Augereau2012). With a race held every 15 min between 1100 h and 2000 h, the number of races at regional racecourses has exploded. Bets are also taken on foreign races, which now represent more than 5% of betting races. The market is oversaturated, with PMU-organised races increasing at a greater rate than total bet value, which is starting to level off. This has adversely affected volunteerism rates and trainers, who find it difficult to organise appropriately, and has reduced per-competition profitability for race organisers. Difficulties are more sharply felt by flat race organisers because of the high cost of returfing courses. Turf courses can only support a certain number of races and requires costly, non-mechanised maintenance. The traditional balance between flat and harness racing has been upset by PMU races. Three-quarters of racecourse associations operate outside of the PMU profit-sharing scheme but nevertheless remain dependent on FNCF to support their programme to share debt across regional racecourses. Although the number of racecourse associations has remained quite high and relatively unchanged over the last decade, dipping slightly from 248 to 234 (Réseau REFErences, 2011b), it should be noted that bets made directly at racecourses have dropped sharply, declining one-third over the last decade, a sign that racecourses are emptying. Although some courses have organised other kinds of events and met with success, they have tended to be major courses within the PMU system.
The other factor limiting growth is the ability of organisers to find enough horses to start races. From 2000 to 2010, the number of starting horses went up by about 1% per year, that is, at about the same rate as the number of competitions. During this period, the number of starts per horse actually fell, from 8 to 7.5, whereas the number of horses having run a race increased by about 2%. The number of horse starts was able to increase over this period only because more horses were entered into races, which is problematic as breeders are facing difficulties in continuing their production.
Investment by owners in race horses
Races could not exist without the investment of passionate individuals who are often pursing the prestige attached to horseracing (Digard, Reference Digard2001). In France, it is estimated that only 55% of racehorse training costs are covered by a horse's prize winnings (Réseau REFErences, 2011b). This average masks important differences between harness and flat racing, however. For owners, the return on investment following deductions for trainers and jockeys was recently estimated at 65% for harness racehorses and 41% for flat-race horses (Digard, Reference Digard2001). The difference is largely due to boarding and training costs, which are much higher for flat-race horses, whereas prize winnings and stipends are about the same per horse. Harness race horses also participate in twice as many races as flat-race horses. Furthermore, the owner is frequently the trainer, and at times ever the driver, in harness racing – an integrated model within the racing world. It should also be noted that the horse purchase price is not factored into return on investment percentages. Given the current economic climate, the value of prize money and other payments is a significant incentive for attracting and retaining horse owners. Payments come in the form of prize money and grants, 80% of which go only to winning horses, stipends to owners and breeders, and a number of other payouts. From 2001 to 2010, the total value of payments increased substantially by about 5% per year, although the trend may have reached its ceiling. Harness races and flat races saw different rates of increase, 6% and 4.5%, respectively. Growth in payment value far exceeded growth in the number of horses that started and was an incentive favouring racehorse investment.
From 1999 to 2010, the number of owners who started at least one horse in the year increased overall, but with very strong disparities among race types. There was little change for harness-race horses and a 1.5% increase for flat-race horses. To meet the need for more starting horses, an essentially stable number of harness horse owners put forward additional horses, although a significantly higher number of flat-race horse owners were needed. Given the high cost associated with flat-race horses, signs of a slowdown in attracting new owners are already apparent (Digard, Reference Digard2001). Owner frustration was clearly in evidence when the Federation of Flat-Race Horse Owners launched a campaign stating ‘The PMU gets rich, the industry grows poor’.Footnote 46 Recent developments in this segment do not represent an ongoing trend, at least for flat-race horses, despite new possibilities for shared ownership, unless, perhaps, flat-race horse owners adopted the ‘integrated’ approach of harness racers.
The future of horseracing
The last decade has seen steady, significant growth in the number of races and of horses started. The number of racecourse associations also remained relatively stable and high. Substantive growth in payments was accompanied by moderate growth in the number of owners, both of which now show signs of levelling off. These trends are only likely to continue if the number of horses and races increases, if more people are attracted to horserace betting with marketing campaigns targeting young bettors, and with the PMU as European market leader. Other new events organised at racecourses would contribute to promoting and maintaining the facilities, and would attract the support of municipalities and encourage volunteerism. With increases in race payments, race horses would remain an investment driven by passion and personal interest, but would become affordable for more owners. On the other hand, under poor economic conditions with gambling and betting only popular for potential gain, the PMU would be forced to chase after young, fickle bettors. A large number of racecourses may install high-tech equipment to follow races remotely, particularly through the use of smartphones. Maintaining payments and prizemoney at current levels would lead to significant reductions in the number of independent owners as increasing costs render horses prohibitively expensive to keep. The integration seen in harness racing – where owner, trainer and at times rider are a single person – would be adopted in flat racing as well.
Limits placed on betting to counter gambling addiction would lead to fewer races and racecourses. Only the most important racecourses with the best technology would be able to survive. Reducing payments and prize money would limit potential owners to individuals able to afford this costly hobby. Facing social pressure, burdensome racing restrictions aimed at reducing strain on horses would alienate loyal racegoers and bettors would place their bets across the range of games offered, both on races and elsewhere. The result would be a general reduction in the number of races run, centred on a limited number of racecourses integrated into casinos. For fear of a total ban on racing, virtual races could appear alongside this reduced number of races. Independent owners would disappear completely with race organisers managing both the racecourses and the horses themselves.
Equestrianism and horseracing microscenarios
To construct equestrianism and horseracing microscenarios, the panel first formulated hypotheses about future developments for each element of the category. The panel did not initially seek out the most relevant combinations of these hypotheses in isolation from the changes envisaged for other elements. Equestrianism and horseracing are, with the exception of certain unprofitable activities financed by personal fortunes, above all wedded to user expectations. The microscenarios already prepared for the ‘user expectation’ category thus served as the locus for combining the possible trends in this segment.
Four equestrianism and horseracing microscenarios were prepared. In the first microscenario, horses are widely available, the market is competitive and diversified, and growth in the horseracing segment is driven by a general fondness for horses. In the second microscenario, the horse market strongly contracts and only luxury equestrianism, driven by competition, remains. Racing remains popular but, through technological innovation, is curtailed. In the third, horses play a prominent role in social mediation and sustainable development and are supported through a solidarity-based economy. Horseracing declines considerably. In the final microscenario, individual use drives the horse industry with horse riding no longer at its heart; simple contact with horses becomes preeminent. The racing industry collapses and exists only in a limited and privatised way.
Microscenario 1: a thriving, competitive and diversified equestrian and racing market
To meet the needs of all clients, there are two types of equestrian centres that coexist and complement each other. Riding schools offer a wide variety of courses with adaptive teaching methods and are focused on customer satisfaction and loyalty. Equestrian recreation centres teach basic riding to transient clients and focus on contact with horses and on the entertainment aspect of riding. Competition plays an important structural role for the industry as a whole, but professionals and enthusiasts develop in very different spheres. The industry grows constantly, driven by the diversification of disciplines offered across different levels of rider ability. High-level riders promote their activity by engaging the media. Competition format is adapted to appeal to wider audiences, thus attracting new sponsors. Outdoor riding is very popular, equestrian tourism in particular. It is practised by groups of riders who own their horses independently and who are members of associations contributing to developing and maintaining trails. The scale of these activities remains a function of profitability, or the expected impact to public image or tourist appeal for municipal horses and horse performances in particular. The PMU becomes the European market leader by targeting young bettors and by increasing the types of race offered. The racecourse network is bolstered through the organisation of other events that attract family audiences. Although still spurred by passion and personal interest, a wider range of owners can access racehorses, thanks to increased payments and prize money.
Microscenario 2: luxury equestrianism and racing, driven by competition
Equestrian clubs, now fewer in number, compete with each other to offer the best services and the best horses. Fresh and dynamic tailored riding programmes are available in sophisticated clubs designed to attract a regular clientele. High-level competition is the main driver for clubs and gives rise to new professions. Media coverage does not reach a wide audience; it remains the purview of enthusiasts but with an international viewership. More independent owners create a strong demand for à la carte equestrian services. Whether for riding instruction or trail riding, these services are offered by freelance instructors, who may work in collaboration with an equestrian centre to make use of their facilities. Specialised companies also offer luxury equestrian tourism services for discovering France's cultural heritage on horseback. Demand for animal traction services is weak, restricting growth in this area. Draught horse breeds are endangered. Horseracing is able to appeal to young people through real-time, remote race viewing. Betting has remained stable. Racecourses, still fairly numerous, embrace new technologies to broadcast races, allowing the PMU to continue developing and to grow internationally. Although payments and prize money have increased, the number of racehorse owners is greatly reduced owing to exorbitant training and upkeep costs. Harness racing's integrated model spreads to flat racing and steeplechase to mitigate costs and risks.
Microscenario 3: personal development and lifestyle become the focus of equestrianism and horseracing
Equestrian centres focus on training leading towards a variety of certifications. In tandem with equestrian activities, some even propose full foaling services for independently owned mares. Instruction and practice of traditional horse riding is no longer the core activity of most equestrian centres. Centres become places to learn and to share. They are also the site of equestrian events open to the public. Some equestrian centres specialise in riding for school groups, rehabilitation or equine therapy. Competition is largely entertainment based, centred on events that showcase action and teamwork. Even show jumping has evolved to become more entertaining. High-level riders promote riding and work to familiarise a wider audience to activities involving horses. Highly active independent horse riding associations organise a wide variety of friendly, outdoor events. New professions emerge. In addition to their role in education, rehabilitation and therapy, horses also contribute to communication, mediation and entertainment. Horse traction is used for municipal and social services and for niche farming. With horsemeat consumption on the wane, horses ultimately destined for the butcher now wholly find their purpose as herbivores maintaining the landscape. With limits placed on betting, horseracing is concentrated on the most important training centres and racecourses with the latest technology. Bettors are younger, but fewer in number, and follow remote races in real time. Caps on payments and prize money reduce the number of racehorse owners. Racehorses are affordable to only the most affluent, who have a passion and personal interest in owning and racing their horses in France.
Microscenario 4: horse-based activities replace equestrianism and horseracing
Equestrian centres are hubs for training and horse expertise focused on meeting the needs of independent owners. They provide tailored services and offer not only riding courses, but also courses in hippology, natural horsemanship, grooming and care. Some also offer short training programmes for horse ownership and breeding certification. New competition disciplines emerge that are particularly respectful of animal welfare. Work-in-hand competitions are very popular. Horses are widely present across all media. Riding is seen as an individual pursuit and there are relatively few activities available outside of clubs and centres. Horses are no longer mere occasional riding or travel companions. After receiving their basic training, independent owners are relatively autonomous of industry professionals other than farriers and veterinarians, although some may call on family-oriented equestrian centres or businesses for occasionally required services such as transport. Of the many activities involving horses, riding no longer has a central place. Simply being in the presence of horses is considered of value, and horses live freely in parks for the benefit of the public. Restrictions aimed at reducing strain on horses to improve welfare, have curtailed the interest of avid racegoers and betting on races is simply one of many games of chance available. A small number of high-tech racecourses, integrated into casinos, host the few remaining races. For fear of a total ban on racing, virtual races appear alongside this limited selection. The racing industry has become totally privatised with race organisers working in a closed circuit managing both the racecourses and the horses themselves. Independent racehorse owners no longer exist.
Horse producer: structure and strategy
The way horse producers are structured and the strategies they use are markedly different from other livestock producers. Most notable is that 85% of horse production is carried out by non-specialists. According to IFCE's equine information system (SIRE), a breeder is ‘any owner of at least one mare that has been bred over the course of the year’. Such a broad definition covers a range of producers whose operations and aims differ. This may substantially influence production methods and market orientation. This report estimated that, by 2030, technology in the field will have evolved, particularly in the field of genomics, making it possible to determine an animal's characteristics by analysing its genetic profile. Smooth progression in this direction would seem to make such advances a certainty and the panel did not consider any avenues where progress would be halted or reversed. The adoption of these new tools by breeders is not so certain, however. Indeed, industry professionals do not always evenly receive innovations in the form of reproductive and breeding techniques, genetics, nutrition, temperament assessment and health care. The recent adoption of artificial insemination techniques by draught horse and sport horse and pony breeders has allowed for more widespread genetic diversity and opened access to the international market. Artificial insemination remains prohibited by Thoroughbred breed registries, whereas French Trotters are barred from using transported semen. Technological development is progressing more rapidly than people's willingness to adopt new techniques. Due consideration must be given to this disconnection between research and those involved in horse production, as well as to the strategies pursued by professional organisations in the industry.
Another key development factor in the horse production market is the organisation of supply-side and demand-side actors. Important factors that could shape production in the coming years include producing the horses clients seek, organising communication networks for producers and clients to meet each other, preparing horses for their future use and applying a horse's abilities to its intended use.
These factors raise questions as to future changes in elements defining industry stakeholders, their strategies and their perspectives. Consequently, the panel considered the following as the most important influences on the future of the horse industry in France:
-
• producer profile and objectives;
-
• production techniques, innovations and their uptake;
-
• actors and channels: from breeding to retail;
-
• internationalisation of trade.
Horse producers: trends and outlook
Producer profile and objectives.
Horse breeding: between secondary activity and passionate hobby
Horses have been very closely linked to humans throughout ancient societies, in agriculture, in the military and in public life, and across all social classes. Horses have long been used for power and have also become a source of enjoyment for their users. Even in the most trying circumstances, such as in war or down mines, horses have been a comfort and an ally, in addition to being a working tool. Horses, ever close to humans, are part of a lifestyle at work, in hunts, parades, fairs, games, forests and races, or even in their stables, as a fount of happiness and prestige. Breeding goes back a very long way in human history with horses. In feudal times, breeding was the domain of lords who provided war horses to their vassals and constantly sought to improve their stock. In his book, Western Equestrian Culture from the Sixteenth to Nineteenth Century (Roche, Reference Roche2008), Daniel Roche explains that, since the sixteenth century, breeding has been a secondary activity. Horses are able to live in an almost wild state for the first few years of their lives and, for hardier breeds, require very little care.
Horse breeding and rearing have thus long been the purview of a wide variety of different groups and individuals who, in general, rarely specialise in this activity. Today, breeding and rearing for all categories of horse represent only 10% of total broodmare owner revenues on average. For 80% of owners, most income is derived from sources outside the horse industry (Figure 9). Over the past 20 years, the number of broodmares per owner has remained stable at less than two.
Breeder revenue sources (Heydemann et al., Reference Heydemann, Boyer, Couzy, Dornier, Madeline, Morhain and Ragot2011).

Studies investigating the profiles, non-economic motivators and practices of breeders revealed there to be four different types (Couzy, Reference Couzy2007) (Figure 10).
Diagram of horse breeder types (Couzy, Reference Couzy2007).

Hobbyists: not considered breeders or professionals, and their horse production is limited and irregular. Breeding is a pastime for hobbyists; they dedicate some of their free time to the activity and accept the possibility of financial loss. Horses produced are destined for personal use, which may be varied. Their production strategy is based on an attractive price–quality ratio for the stallion service fee, the distance to breeding centres, a haphazard nutritional programme and health care provided by a veterinarian mostly specialised in equine treatment.
Amateur breeders with twin aims: see themselves as breeders, but not as professionals. They have small operations but try to produce at least one foal per year. Breeding is done in their free time with the aim of breaking even. Production is destined for both personal use and for sale. They are passionate about a single breed and raise that breed to the exclusion of others. Their production strategy is to breed horses they are enthusiastic about and that could sell. Nutritional programmes are not always well-grounded and health care is provided by veterinarians not necessarily specialised in equines.
Realistic professionals: own more than three broodmares and produce annually with a view to generating profit. They strive towards uniform production rather than seeking excellence in certain individuals. Their production is centred on one breed suited to its intended use. They use diverse production strategies. Nutritional programmes are carefully planned and health care is provided by specialised veterinarians.
Perfectionist professionals: have large operations and produce regularly. Profitability is not the driving force; money invested is derived from other sources. They produce racehorses and horses for high-level competition and sport. They aim for added value through coat colour, breed or performance ability. They opt for a single breed that they are passionate about. Their production strategy is focused on excellence at all levels – genetics, nutrition, health care – to reach perfection with the help of specialised experts.
This analysis reveals the diversity existing among breeders. For 90%, breeding is a pastime more than a source of income. This is true even for racehorse breeders; although they are seen as professionals and specialists, only 15% have breeding as their sole livelihood. Horse breeders can thus be characterised by their desire to meet their own needs, which may often be removed from the needs of others users. Passionate about a breed, a type of horse or a discipline, their production is geared towards achieving their aims, namely, producing their vision of the perfect horse. Profitability is not the primary driver of activity. This may, as a consequence, limit production during times of economic uncertainty.
Producer profile: trends and future outlook
Horse breeding is strongly influenced by ‘horsemen’ traditions where knowledge is passed on through long years of hands-on experience. Experts interviewed for this report felt that changes in horse breeder profiles and their production aims would be difficult to envisage. Nevertheless, there are some developments that mirror change in the agricultural sector. For example, whereas a son would in the past unfailingly take up his father's tradition of horse breeding, nowadays, once a founder retires, there may be no interest in continuing the activity and the farm may close, with remaining horses sold at auction.
In the racehorse industry, the relationship between professional and amateur breeders is beginning to change. In the past, professional breeders had a monopoly on know-how and on the choicest stock. Their skill at pairing the best horses gave them an undisputed technical advantage. Professional breeders even developed a specific, derisory term for ‘non-specialised’ owners’ horses: the ‘pharmacist's mare’, a family horse ridden competitively by the children who, after moving out, leave the horse in the care of their pharmacist parents. To give the horse ‘something to do’ by producing offspring, the parents – who thus become breeders – breed the mare without concern for its actual genetic potential or athletic ability. Such offspring do not stand a chance competing against the production of professional breeders. Today, however, the availability of high-level sport horse and pony semen has made many more affluent amateurs able to produce quality horses at the same level as professionals. The dividing line between amateurs and professionals is becoming increasingly hard to distinguish in this regard.
With government support for breeders declining, individuals who sell their horses at very low prices without concern for profit contribute to increased competition among those breeders considering themselves to be professionals and other breeders. The relationship between these two categories is unbalanced. Amateurs are not decidedly the clients of professionals. There is a lack of clear and transparent services available to amateurs from professionals who have yet to put such measures in place.
In addition, the rise of international trade has made competition even stiffer. Other European countries, such as the Netherlands, Germany and Belgium, have seen growth of breeding farms focused on economic and technical performance in response to client demand. In France, it would seem that a passion for horses and the economic bottom line are more difficult to reconcile. There are, however, possible alternatives that come from other livestock production industries, namely, farms with low input costs that also seek lower production costs. Recent studies carried out by OER and the REFErences network show that there are major revenue disparities for the different practices adopted (Heydemann et al., Reference Heydemann, Boyer, Couzy, Dornier, Madeline, Morhain and Ragot2011). This suggests that it is possible to make breeding farms more profitable. The average revenue for a breeding farm is around 15 000 euros. However, the average is deceptive as half of all farms declare no revenue whatsoever, while racehorse farms with more than five broodmares may declare revenues as high as 250 000 euros. The gross operating surplus varies from negative values to nearly 40 000 euros for diversified farms that incorporate a riding centre or another agricultural activity.
Given the relative stability in this area, the panel was led to reflect on other outside forces that could have an impact on breeding or oblige change for breeders. If the growing pressure, now regularly felt, from international trade continues, traditional practices could be called into question and spur change. Whether for high-level competition, breeding, or simply recreational or amateur use, an increasing number of horses in France are imported, although many French-born horses have difficulty finding buyers. French producers may be forced to react to the growing number of imports by creating new technical and economic practices to attract or retain their clientele and regain their part of the market share.
Other possible influences include the poor economic climate. It reduces purchasing power and may lead hobbyists or amateur breeders to curtail their breeding. Early data from 2012 seem to suggest this, showing an estimated 30% reduction in the number of mares covered by stallions managed by France Haras.Footnote 47 Breeding can be put on hold or reduced without significant repercussions to hobbyists or amateur breeders. Should the economic climate continue to worsen, some breeders may be compelled to give up breeding or to reduce the size of their holdings to minimise losses. To earn sufficient money from their activity, other breeders may give serious consideration to the economics of the situation by reducing their production costs or adapting their product.
The panel did make note of an emerging trend towards the likelihood of growing regulatory pressure for the protection of animal welfare. There may be new restrictions imposed on animal ownership and on horse ownership, in particular. Breeding could become an activity practiced only by qualified professionals. Certification and licensing in this regard could serve as quality guarantees for services offered by professional breeders to clients, amateur breeders or mare owners seeking to breed their horses.
In the United Kingdom, there has been an effort to improve horse genetics, encouraging breeders to cover only those mares that meet specific criteria (British Horse Industry Confederation, 2005). Breeding associations encourage members to think before breeding and seek to dissuade owners of average mares from breeding unless for their own personal use. Could such measures also be implemented in France?
Production techniques, innovations and their uptake.
Available techniques are underused, innovation unevenly adopted
Reproduction and selection techniques used for horses are somewhat different from those used in other livestock industries. France's 51 associations for recognised breeds are involved in shaping genetic enhancement guidelines and assessing selection criteria for breed registries. Male racehorses are first selected on the basis of conformation and early aptitude towards the discipline. Their sporting success once mature, between the ages of 10 and 15, will determine their renown as a stallion in France and abroad and, consequently, the number of their descendants. Renown, however, will not ensure that a stallion covers only the best mares. There are no restrictive criteria for mares; a wealthy owner is free to choose the best stallion for mares that may be less well conformed. It is rare, or very infrequent, that there is demand to breed a specific mare. Often, the choice of mare is a sentimental one not motivated by production aims. For example, a mare is chosen to foal and produce offspring because an owner's children learned to ride on it. For racehorses both male and female, selection is driven by race success. For hardy local breeds, adaptability is the main selection criterion. Mérens horses, which range freely in mountainous areas, must be surefooted and are therefore selected on their ability to adapt to this environment. The introduction of some hardy races, such as Mérens and Camargue, to less difficult terrain may lead to weaker stock, however.
Technical innovations are generally introduced to give breeders tools to better select horses and to improve their performance. In some cases, innovation is rapidly accepted and its benefit recognised. Racehorse breeders have been using artificial insemination and semen freezing techniques since the 1980s to allow genetically valuable reproductive males to race and breed at the same time. Insemination techniques have meant that high-quality semen is available across a wider geographic area, but regulations in France limiting stallion covers to 100 per year have restricted the possibility of increasing stocks of high-quality offspring. For the female horses, the equivalent is embryo transfer. It is relatively uncommon because of its cost and the limited effectiveness of the multi-step technique. It is reserved for very high-value mares whose quality offspring may offset the high cost involved. Draught horse breeds have rapidly adopted artificial insemination, although the technique is prohibited for flat-race horse breeds, as is embryo transfer. Harness race horses may be artificially inseminated on site using non-transported semen. The technique prevents a stallion from covering a number of mares on the same day at the same site.
Figure 11 shows techniques used for horse breeding since 1975 and illustrates the rapid growth of artificial insemination using fresh semen on site, but also of frozen or transported semen (labelled as ‘Other’), particularly from 2000 onwards. Pasture breeding is also becoming more popular as draught horses, ponies and local breeds raised in a semi-feral state become more widespread.
Horse breeding techniques (IFCE SIRE database).

Other livestock breeders seek to improve the genetic stock of their herds as a whole. They are not attached to individual animals, as is the case for horse breeders who breed an individual horse because of its specific potential for sport or for racing, for its prized genes or simply for purely sentimental reasons. An owner may, for example, choose to breed a sub-fertile horse using the latest technology irrespective of the cost to ensure its offspring, rather than simply withdrawing the animal from reproduction.
There are performance indicators that allow breeders to predict the genetic potential of an animal for a given discipline using its genetic records, its past performances and the performance of its pedigree. Such tools are used for AQPS harness and flat-race horses as well as for sport horses for show jumping, dressage and endurance. They allow for comparison in a specific discipline over a specific time. By replacing pairings made ‘intuitively’ with a structured system, such tools aim to accelerate genetic advance, although results are not always verifiable.
Breeders have not universally adopted genetic indicator tools. However, many well-known breeders raise other kinds of livestock, where these techniques are widely used and they are aware of the potential benefits of such tools. Other breeders have training and experience that may make them more inclined to adopt such tools. The competition management arm of the FFE keeps performance records of French horses, as long as they remain in France. These records are publicly available and breeders often closely monitor the results of the horses they have bred. The difference between managing a herd and managing individual animals may be the root cause of the disinterest in genetic indicator tools. Breeders of other species tend to accept that a small proportion of individuals will not entirely meet their expectations as long as the majority of the population makes measurable genetic progress. Horse breeders, however, are not keen to use a tool that does not guarantee with certainty the exceptional horse they expect each time.
Some breeders cite the impact of environmental factors to explain why genetic indicator tools are ‘impossible’ to use for sport horses. Beyond usual variability seen across a species by factors such as nutrition and breeding techniques, additional variability comes from the ‘rider effect’, the interaction between horse and rider during competitions. The impact of various rearing, handling, and training methods and techniques can also be considered a source of variability. Performance heritability in show jumping is around 25%, that is, one-quarter of the variability is genetic and three-quarters of the variability is because of environmental factors. The moderate rate is equivalent to heritability factors in other animals, such as milk production in cows or daily growth rates in fattening pigs. Heritability for harness racing ability is about 25%, and for flat race ability around 35% (Jussiau et al., Reference Jussiau, Montméas and Papet2006). Racehorse breeders are not particularly receptive to this, believing that performance is essentially a question of training and handling. Moreover, racehorse auctions favour high prices for horses whose potential performance is only assessed on the basis of pedigree and buyer expertise. This does not foster the use of genetic indicator tools.
The nutritional needs of different horse types and the best ways to meet them were identified in the 1980s and 1990s (Martin-Rosset et al., Reference Martin-Rosset, Jarrige and Charlet1984). For example, different growth and nutritional models were prepared based on a young horse's intended use for recreation or competition. Breeding and nutrition models have also been created for reducing osteoarticular diseases and for reducing costs based on production goals (Martin-Rosset, Reference Martin-Rosset2012). Unlike other animal species, where nutritional modelling techniques are very widespread, models for horses are seldom used and remain unfamiliar to most. This is despite the fact that models are widely available and were completely updated in 2011.
Trends
There is limited industry interest in genetic indexes and BLUP, despite the opening of a new chapter in animal husbandry practices through the use of genomic profiling to assess animal potential. This reticence invites due consideration as to the perception of these new tools. The techniques would not only accelerate the development of ‘traditional’ characteristics such as sport performance but also open the way to improving other traits of genuine interest to breeding and to the human–horse relationship, such as temperament or the resistance to certain osteoarticular or respiratory pathologies common to competitive, sport and race horses. The techniques will be increasingly adopted by curious breeders and technophiles in other countries seeking to improve their cost-effectiveness. Breeders in France must choose whether or not to take part in this move towards innovation.
Despite demonstrated progress achieved with other livestock species, the limited use of innovative techniques can be partly explained by the non-specialist nature of most breeders. INRA and the Haras nationaux were once very closely linked and together drove the rapid adoption by breeders of artificial insemination and ultrasound techniques. The ties have since weakened. Government policy is also coming under review at present and the recent cessation of State stud farm activities has been definitively adopted. These changes have put an end to the systematic and almost organic feedback loop that existed between breeders in need of technical assistance and research laboratories. Direct contact between breeders and institutions has been lost. The need for this interaction nevertheless still exists and new communication channels must be forged. Similarly, information on nutrition must be made more accessible. Opportunities for frequent dialogue on the matter do not exist. For other livestock species, there are trained technicians crisscrossing the country, offering assistance when necessary to industry professionals. Such assistance does not exist for horse breeders and users. The REFErences network, a clearinghouse for technical and economic information on the horse industry, has shown that knowledge of nutrition is key to creating diets better suited to different animals’ specific needs. This is true both on breeding farms and at equestrian centres. Knowledge of nutrition could also reduce costs, making the industry more competitive and more professionally oriented. Applying INRA recommendations could therefore facilitate considerable progress in the industry.
There are a number of new techniques that may be considerably effective for orienting horses towards their aptitudes or for adapting training methods to suit individuals. Among them is an early temperament analysis developed by IFCE and INRA that considers the horse's tendency to show fear, social motivation, reactivity towards humans, attentiveness over distraction and physical reaction to dangerous situations (Lansade and Bouissou, Reference Lansade and Bouissou2003). It allows the temperament of foals to be assessed from the age of 8 months.
A complete overhaul of the way innovation is disseminated in the horse industry would be necessary to improve knowledge-transfer practices and to facilitate the adoption of new techniques. It could, however, lead to higher levels of technical ability for stakeholders across the industry.
Actors and channels: from breeding to retail
Lucien Karpik explains that horses are a unique product, similar to fine wines, works of art and great literature (Karpik, Reference Karpik2007). The quality of a horse is more important than its price, and quality is difficult to define, compare, buy or produce. Quality is also an unknown factor; a buyer can only really determine it after purchasing and extensively using a horse. For horses, however, long periods of use by an inexperienced or overambitious rider can erode skills learnt in training or affect its performance ability. In other industries, quality is guaranteed through brand names, certifications, guidelines or recognised spokespeople. Good judgement when buying a horse is a difficult and time-consuming skill to acquire. Lack of transparency, both in terms of price and actual product quality, is a traditional aspect of the industry. Chrystel Couzy describes the horse market as fragmented, disorganised and unregulated with poor price transparency and a supply side that is, partly, disconnected from demand (Couzy and Godet, Reference Couzy and Godet2010). The racehorse market presents a further challenge as it is not governed by traditional economic pressures. Strong emotions and passions come into play in racing and these often take precedence over economic logic. Racehorse breeders sometimes behave like artists. The products they sell are not only the fruit of their labour but also extensions of themselves. In selling their creation, they forgo their strong attachment thereto. Between breeders and their clients, however, a number of people are involved, such as instructors and merchants, who are considerably more pragmatic.
It is difficult to jointly formulate an effective production strategy that can meet user needs when industry actors are manifold and their goals differ. There are, however, signs of small-scale change among certain local breeds used in emerging disciplines such as endurance and recreation that are already producing in relation to demand. The production of racehorse breeders is also specialised and is overseen by two agencies, SECF for harness racing and France Galop for flat racing. Specialisation in harness racing is further reinforced through its vertical integration; breeders train their horses and are at times even their drivers. Horsemeat production is also well-organised through its inter-professional association, Interbev Équins, although it is primarily focused on the Italian export market, which is highly competitive and also shrinking (FranceAgriMer, 2010a).
Riding horse breeding is different. The market is driven solely by breeders and is not particularly customer focused. There is little structure in this segment and although its production can be considered specialised, the actual output itself is not. There is a major imbalance between production goals and the needs of the riding public. Production is 80% focused on high-level sport, although only 5% of horses are used for this purpose. Trail riding, riding instruction, and amateur and club-level competition represent 85% of the demand for riding horses (Figure 12). The types of horse produced and the intended target market do not really respond to extant demand but rather to breeders’ personal interests and objectives. As a result, the changes in production or sales strategies observed over the past 20 years have been negligible in relation to considerable structural changes, such as the cessation of State stud farm activities and the opening of European borders, and technological changes, such as artificial insemination, pregnancy testing, embryo transfer, traceability, training support, animal selection and performance profiling.
Use of sport, recreational and draught horses (Heydemann et al., Reference Heydemann, Boyer, Couzy, Dornier, Madeline, Morhain and Ragot2011).

Future outlook
Through the French Equine Association, the supervising agency for sport horses and ponies, the supply side, that is, breeders and stud owners, now dominates industry governance. The current system of breed associations does not effectively meet user demand. In restructuring and developing production activities, producers could become service providers to amateur riders. Although breeder passion operates independently of market conditions, breeders cannot ignore the mounting pressure that international competitors, responsive to user needs, will create. There is a marked increase in horse imports, both in number and in value. Over 10 000 of the 60 000 horses bought in France in 2010 came from other countries. In comparison, in 2000, fewer than 4000 horses were imported. The growth rate over 10 years was +176% (Réseau REFErences, 2011b).
Breeders may want to produce a champion and this dream may continue to drive them, but breeding horses requires sufficient land. A poor economy and real estate pressure may adversely affect production and lead more people to buy horses from abroad. A shift in perception, whereby horses are considered products responding to consumer needs, requires changes in horse production systems and better adoption by breeders of technological advances. Techniques such as traceability, training and rearing support, genetic enhancement and performance profiling would provide better guarantees for buyers and for users. There are a number of reasons why a customer may be inclined to purchase a horse from a foreign vendor. Frequently cited is the lack of transparency in the French horse market. Making the industry more professionally oriented could boost confidence between buyers and breeders and enhance the reputation of French breed farms both at home and abroad.
There are a number people potentially involved in horse production and sale, including breeders, trainers, merchants and riding instructors. A system could be developed where consumers, increasingly removed from the rural world, and equestrian centres, which do not always have the necessary time to train their horses, are able to rely on industry professionals. Breeders feel that the best possible future course would be one where horses are seen as living creatures rather than consumer goods and where this fact is recognised in business dealings and in customer expectations. Taken to extremes, requiring a licence to purchase or to use a horse could guarantee that owners possess the necessary fundamentals of animal well-being to care for their horse.
Horse industry clients could join together to form consumer associations and call for a vertical production system driven by demand. Production would no longer focus on breed associations but instead be guided by intended use. This would better ensure steady demand, although perhaps stifle breeders’ sense of independence.
The sale of horses could become formalised, much like elite racehorses auctions. They could be held on a regular basis throughout the country with horses that meet consumer demand. The internet can also facilitate the relationship between consumers and producers.
There are local initiatives that underscore the desire of many equestrian centres to be involved in the training of their horses. As a part of the process to make young horses ready for the market, and to share the costs involved, breeders place a horse in an equestrian centre and the centre's apprentices gain experience by training and using it.Footnote 48 It is a win-win situation. The trained horse is purchased at an equestrian centre by a rider who has been able to take the time to ensure the horse is well suited to his or her needs. Another sample initiative brings together specific types of horse for the purpose of their sale. The focus is communication with equestrian centres and the riding public.Footnote 49 Such initiatives are signs of change that may make the process more customer oriented in the long term.
Draught horse breeding farms face uncertain market conditions and are at risk. It is possible that draught horse breeders may discontinue their activities in the years to come. This raises the question as to whether personal interest will be sufficient to support the breeding of draught horses. At current levels, government aid in favour of biodiversity is not enough to shoulder the costs of draught horse breeding. Better representation of the draught horse industry in the EU's CAP would be beneficial to preserving draught horse populations.
Internationalisation of trade
Increasingly open borders across the EU have boosted trade over the past 20 years. As a result, horses born to foreign sires are progressively more common in France. The number of horses imported grew fivefold for sport horses and by a factor of 1.4 for racehorses (Réseau REFErences, 2011a). Whereas the Netherlands, for example, exports 47% of its horse production, France barely exports 15%. Thoroughbred imports to France come largely from Ireland, the United Kingdom, the United States of America and Australia, whereas sport horse imports come from the Netherlands, Germany, Spain and Belgium. Imports represent 10% of horses in competition in France, a sixfold increase over 10 years. France exports horses worldwide, and to North Africa and the Middle East in particular, although the United Kingdom is the top trading partner in terms of value. At present, wealthy riders are increasingly successful in high-level competition and new countries are stepping into international competition. Some riders from these countries may spend millions of dollars to buy their way into international competition. They purchase ‘turnkey’ horses a few weeks before major races and enlist the services of the best trainers. Saudi Arabian Abdullah Al Sharbatly won second place at the 2010 FEI World Equestrian Games in Lexington, on a mare he had been riding for only 6 weeks, in this way. The recent bronze medal in jumping won by his team in at the London 2012 Summer Olympic Games serves to reinforce this trend. Taken to the extreme, Ukraine, trying to break onto the international stage, fielded a team to the Beijing 2008 Summer Olympic Games composed entirely of riders who were naturalised Ukrainian citizens. They were all highly accomplished European riders who had been paid to change their citizenship and received new mounts bought at extravagant prices. The team won fourth place at the 2006 FEI World Equestrian Games in Aachen.
Industry professionals in Europe are well placed to profit from the substantial revenues these practices can provide, although they may lament the fact that sport ability plays second fiddle to the financial ability to invest. Nevertheless, breeding and riding savoir-faire remains firmly in Europe and in North America, which is where foreign riders are all based. Breeding, and by extension the level of sport horses, is the key factor and, for the moment, remains concentrated in Europe. In France, former military officers created the first equestrian centres in the 1960s and became riding instructors (Heydemann et al., Reference Heydemann, Boyer, Couzy, Dornier, Madeline, Morhain and Ragot2011). Naturally, they transmitted the values and techniques they had learned over the course of their own training. As a result, equestrian culture is a descendent of military culture. This legacy may be difficult to assimilate for certain countries newly interested in equestrianism. Accordingly, it may possibly be difficult for equestrianism to become truly universal. The inscription of ‘Equitation in the French tradition’ on the UNESCO Representative List of the Intangible Cultural Heritage of Humanity represents an opportunity to give currency to equestrianism around the world.
Growth in international trade, with more horses and genetic material purchased abroad, has affected competition horse and high-level racehorse breeding as well. Buyers are, for the most part, amateur riders looking for a horse that meets their needs. Marketing promoting local breed farms and encouraging local trade would allow breeders to adapt to the needs of these clients. Otherwise, it is likely that they will continue losing market share in France.
The stud book for flat-race horses is already international and international trade in this segment dates back to the end of the eighteenth century. Nowadays, breeders operate wholly at the international level. This may at times lead to price speculation for some stallions, whose semen may fetch prices as high as 300 000 euros. The stud book for harness race horses remains national, although controlled crossing with foreign bloodlines has been allowed for about 30 years (Augereau, Reference Augereau2012). As a result, the market for harness race horses remains largely domestic.
In addition to increased trade, the horse industry is being affected by growth in international trade in a number of other ways, including foreign investment in French stables. This is the case for both the sport horse industry and the race industry, flat racing in particular.
Horse producers: outlook and analysis
The panel's decisions were used to create the microscenarios presented here. In general, the microscenarios focus more on sport and recreational horse breeding than racehorse breeding because they are less structured and more volatile owing to the considerable range in breeder profiles. The first microscenario is the baseline; the present system continues as it is. When creating the other microscenarios, a deliberate choice was made to explore future courses where external factors drove change, but did not cause the industry to collapse or disappear completely because of massive imports of foreign horses. In the second microscenario, international competition and economic pressures push breeders to produce more rationally. In the third microscenario, change is brought about by strongly increased regulatory requirements. In the fourth microscenario, user needs drive change.
Microscenario 1: the dream of a prizewinning horse, recreational horses an afterthought
Leisure, recreation and the dream of a prizewinning horse continue to dominate the horse breeding industry. The highly disparate aims of various industry players continue to limit organisation into collective associations. The number of very small breeders, with two mares or fewer, remains stable and production remains focused on luck of the draw to breed prizewinning horses ‘by accident’. Hopes and dreams are stoked by the many inspiring stories of horses that became celebrated winners, despite lacking the genes and the conformation to make it big. Breeding remains driven by boundless passion; the question of profitability is moot. Breeders play the numbers and are confident in their abilities because they do not seek to improve their technical or economic performance. Many stud books continue to manage breeds that are cross-bred, lack sufficient numbers and are not substantively distinct.
At the same time, 10% of breeders are still involved in a highly specialised activity. They have distanced themselves from non-specialists to focus wholly on sport performance. There are not enough horses to support a closed stud book and there are not enough breeders to have an impact on the elite market. As a result, production becomes international, as has been the case with Thoroughbreds for the past 150 years and French Trotters crossed with American Standardbreds for the past 20 years.
People in the market for a recreational horse must – with the exception of a few niche producers of coloured horses, Iberian horses and Lusitanos – either content themselves with the castoffs of breeders dreaming of a prizewinner, or look to foreign breeders who offer better and more clearly established products.
Microscenario 2: small producers more professionally oriented, judiciously passionate
The economic environment encourages breeders to become more professionally oriented. Breeding remains focused on sport and race horses. Recreational horses are by-products but are selected sufficiently early in their life to be trained specifically for recreational riding. Microscenario 2 could actually be considered a baseline scenario as it assumes economic conditions similar to today's weak economy.
There are three possible responses:
-
• Some breeders discontinue their activity after a series of setbacks, disappointments or, particularly, economic difficulties.
-
• Other breeders may experience setbacks and disappointments and decide to have more market- and profit-driven production. They identify a market, assess client needs and organise their production to those ends. They are particularly attentive to the needs of occasional, recreational riders and of equestrian centres. Horse prices converge on a median price roughly equivalent to the animal's cost price, with sufficient profits to keep breeders in business. The production of mid-range horses on larger breed farms could result, which would be encouraged to use horses for protecting and maintaining environmentally sensitive areas. Cost efficiencies are sought at all levels: genetics, nutrition and staffing.
-
• Remaining breeders continue pursuing their dream of producing exceptional sport horses while remaining very aware of production costs. Knackery costs limit the production and availability of horses. Consequently, it is very important to improve product quality and avoid the need to produce in quantity to produce quality. This requires strongly improved efficiencies in business, organisation and structure.
International trade grows considerably because of the sport horse markets in emerging countries, in particular Brazil, India and China. French producers increasingly export for luxury markets. They are able to regain a domestic market share because underperforming sport horses are quickly shifted towards recreational use.
Microscenario 3: professionalism enforced, passion bound by breeding permits
Amateur breeders have difficulty finding sufficient land, securing breeding permits, transporting their mares for cover, monitoring foaling and selling their foals. As a result, breeding centres begin to offer the necessary services to mare owners, as is already the case with racehorses. The range of services offered by equestrian centres and owner's stables varies.
The market is divided in two: luxury horses, as is the case today with Thoroughbreds, French Trotters and some sport horses; and low-end horses such as, for example, recreational mares with no pedigree kept as a part of a herd in pasture all year round and requiring little care. Local brands and breeds dominate the market and are a sign of distinction, much like quality assurance guarantees for food products. Equestrian centres do not only breed horses for others; they play an important sales role by vouching for their horses, thereby adding value. The centres are a response to previous haphazard production systems and are focused on delivering consistency. Proximity is now a factor when buying a horse, making the purchase easier and after-sales services more available. Customers most frequently buy from equestrian centres that in turn establish purchase or rental agreements with breeders for horses with specific characteristics. Breeders work to safeguard their brand image. Young animals are given to equestrian centres at a very early age, if they were not born at one to begin with. The future owner can thus participate in the horse's training.
There is an increased availability of products that were previously imported, such as American Quarter Horses and Iberian breeds. As a result, French breeders regain a domestic market share.
Microscenario 4: specialisation and segmentation, production channels markedly different
Recreational riders are increasingly demanding. They will no longer ride horses unsuited to their intensive riding needs. New breeders have established themselves to meet this demand. The sport horse industry has also specialised by focusing on quality and produces fewer castoffs. Underperforming horses are recognised as valuable, however; through brand recognition they may find markets abroad. Racehorse breeding continues to be performed by enthusiasts who are otherwise employed in another field.
Horse type is more important than breed for regular recreational riding. Local breeds, however, are strongly valued for their equestrian tourism role. Sport horse breeders specialise to produce horses of both high- and mid-level athletic ability for professional and skilled amateur riders, respectively. Major market players, financial backers and high-level riders operate as businesses. The market is driven by the consumer.
Breeders use all available technologies to produce and train a consistent product at a low cost. Services are available across the spectrum at all levels including contracted services between breeders and equestrian centres, the actor-user and actor-professional of the horse production chain. Competition may come from Central Europe, which has significant horse populations, infrastructure, State stud farms and trained personnel. The sport horse industry is already well versed in technological innovation and does not shy away from using genetic indicators, genomics and new discoveries about nutrition. Marketing and sales support for sport horses is very important to counterbalance fierce competition from elsewhere in Europe. On the one hand, the international availability of high-level sport horse semen has created a global sport breed, whereas on the other the choice of breed depends on emotion, beauty and its social value. For the latter animal, buyers are mostly amateurs who buy locally or from a pony club or equestrian centre. Sales are carried out online or through local breeder associations.
Value is added to horses either in equestrian centres or in centres specialising in breaking and training horses. These centres also train professional riders in the way professional racehorse riders are trained today. After many years of favouring heavily conformed horses without due consideration to their work abilities, draught horse producers are focusing their production towards animal traction, following the continued decline of the horsemeat market.