The protection of groundwater and related surface water quality is a key aspect of the European Union Water Framework Directive (WFD) (CEC 1998), and an important driver in current UK environmental legislation. Groundwater protection under the WFD has moved away from a focus purely on monitoring pollution in abstracted resources, to assessing the overall health of the aquatic environment. Groundwater's status as a resource actively used by humans – for example, for water supply – is still important, but is no longer the sole driver for groundwater protection. These legislative changes have led to a need to develop methods to determine threats to groundwater quality, not only for water resource management, but for the wider issue of protecting the aquatic environment, for use by regulatory authorities, local authorities, planners, developers and environmental scientists.
In recent years, national groundwater vulnerability maps have been produced for the UK (Palmer & Lewis Reference Palmer, Lewis and Robins1998; Ó Dochartaigh et al. Reference Ó Dochartaigh, Ball, MacDonald, Lilly, Fitzsimons, Del Rio and Auton2005; Robins et al. Reference Robins, MacDonald, Allen, Witkowski and Vrba2007). These are based on an assessment of the pathway between the land surface, where pollutants may be present (the source) and groundwater in aquifers (the receptor). The vulnerability assessments are determined by the geological and hydrogeological characteristics of the pathway, based on the nature of overlying materials, including soil and Quaternary (or superficial) deposits (e.g., Boorman et al. Reference Boorman, Hollis and Lilly1995).
Historically, soil property information has been lacking for UK urban areas as national soil survey programmes focussed on the rural environment (McGrath & Loveland Reference McGrath and Loveland1992; Paterson Reference Paterson2011). In addition, the highly heterogeneous nature of urban ground – for example, disturbed, removed, replaced or covered – means that it is difficult to make broad-scale assessments of ground characteristics. Therefore, in urban areas, where groundwater resources are often most in need of protection from pollution, the threats to groundwater quality are often less well understood. There is a growing demand for effective methods to support the management of urban groundwater. This is true both in the UK and internationally, and the protection of metropolitan groundwater resources is of increasing concern as global urbanisation rises (Lerner Reference Lerner2003; Howard Reference Howard2008).
Some of the main sources of groundwater pollution in the urban environment include industry, run-off from hard surfaces and leakage from the sewerage system (Lerner Reference Lerner2003). Polluted soil and/or artificial ground are also a well-known problem in many urban areas (Fordyce et al. Reference Fordyce, Brown, Ander, Rawlins, O'Donnell, Lister, Breward and Johnson2005; Johnson et al. Reference Johnson, Demetriades, Locutura and Ottesen2011; Luo et al. Reference Luo, Yu, Zhu and Li2012) and can act as a pollutant source. Substances can migrate from soil/artificial ground to shallow groundwater via direct contact, infiltration, weathering and leaching mechanisms. The protection of water bodies from soil pollutants is one of the main concerns under current UK land contamination legislation (Environmental Protection Act, Part IIa 1990) as well as the WFD (CEC 1998).
The migration of metal pollutants in soil and natural or artificial superficial deposits is controlled by a number of factors, including climate, especially rainfall and evaporation rates; the type and physico-chemical properties of the pollutant, microbial and plant activity; and the physico-chemical nature of the soil and subsurface materials (McBride Reference McBride1994). In general terms, the greater the rainfall, the more potential for pollutant leaching and mechanical transport. Migration through soil and superficial deposits is also enhanced by the presence of fractures and other physical features that promote water movement. More permeable sandy and gravelly soils, and superficial deposits in general, permit greater migration of pollutants than lower permeability clays and silts. Of fundamental importance to the migration of metals in soil is its attenuation capacity, or the ability of the soil to trap pollutants in the surface zone via the process of sorption onto soil particles. Key factors controlling attenuation capacity are the clay, organic carbon and iron–manganese (Fe–Mn) oxide (sesquioxide) content of the soil, as each of these components has the ability to bind metals to their surfaces. The extent to which metals are sorbed onto soil is also controlled by the nature and concentration of the pollutant and by the soil texture, pH and redox conditions (Sposito Reference Sposito1989; McBride Reference McBride, Richards, Steenhuis and Spiers1994). Therefore, the ability of surface metal pollution to impact on shallow groundwater is limited by the strong binding capacity of many metal cations in soil (Blume & Brummer Reference Blume and Brummer1991). However, evidence suggests that anthropogenic sources of metals are more mobile than natural ones (Wilcke et al. Reference Wilcke, Müller, Kanchanakool and Zech1998; Wuana & Okieimen Reference Wuana and Okieimen2011) and many instances of pollution leaching from soil and/or superficial deposits and impacting on shallow groundwater have been reported, over timescales of tens of years (Evanko & Dzombak Reference Evanko and Dzombak1997; Wilcke et al. Reference Wilcke, Müller, Kanchanakool and Zech1998; McBride et al. Reference McBride, Richards, Steenhuis and Spiers1999; Farmer et al. Reference Farmer, Thomas, Graham, Geelhoed, Lumsdon and Paterson2002; McLaren et al. Reference McLaren, Clucas and Taylor2005; Wuana & Okieimen Reference Wuana and Okieimen2011).
In the UK, the increased installation of sustainable drainage systems (SuDS) is also driving interest in urban groundwater quality (Butler & Parkinson Reference Butler and Parkinson1997; SEPA 2005; Woods-Ballard et al. Reference Woods-Ballard, Kellagher, Martin, Jeffries, Bray and Shaffer2007; Dearden & Price Reference Dearden and Price2012; Dearden et al. Reference Dearden, Marchant and Royse2013). SuDS mimic natural processes to slow and retain surface water, such as storm water run-off, in order to reduce or prevent flooding and allow pollutants to break down, before discharge to receiving water bodies. SuDS installations include permeable surfaces, infiltration trenches, shallow drainage channels and detention ponds. SuDS are being used increasingly in new developments in Glasgow to mitigate flooding and overflows within the sewerage network system (MacDonald & Jones Reference MacDonald and Jones2006). However, to date, SuDS schemes that discharge to a lined pond or underground storage tank, and then the sewerage/drainage network, rather than direct infiltration to the subsurface, have been applied because of a lack of information about the degradation of shallow groundwater quality from the enhanced leaching of soil pollution. A better understanding of the nature of the subsurface and likely migration of contaminants so as not to increase pollution transport to shallow groundwater would aid the design and siting of SuDS schemes in the future.
The GRoundwater And Soil Pollutants (GRASP) screening tool aims to provide a first-pass assessment of areas of a city that may be more susceptible to metal pollutants leaching from the soil/shallow subsurface to shallow groundwater. GRASP can assist urban development by focussing attention on areas where pollution problems in shallow groundwater are most likely to occur, because of the presence of elevated metal contents in near-surface materials, and of shallow groundwater tables. These areas may be most sensitive to any developments that enhance infiltration pathways or to pollution events, which might cause the binding capacity of a soil that already has high metal concentrations to be exceeded. This is particularly important where on-site disposal of storm water via infiltration SuDS is required.
GRASP has been piloted in Glasgow, Scotland's largest city, which, like many UK and other European cities, has a long industrial history and a corresponding legacy of pollution. Groundwater from Carboniferous bedrock aquifers within the Glasgow urban area was widely used for industrial processes in the 19th and 20th centuries, but today there is little groundwater abstraction within the city. Despite the limited direct use of groundwater resources, the protection of groundwater and surface water is a key concern for local authorities and the regulatory body, the Scottish Environment Protection Agency (SEPA), as it impacts on their ability to meet the requirements of the WFD (CEC 1998) and promote ‘green' infrastructure such as the use of infiltration SuDS. In Glasgow, the majority of soil is underlain by often thick (more than 30m) Quaternary deposits that are largely of glacial and estuarine origin, and, particularly in the central Clyde valley, contain significant proportions of permeable sand and gravel (Hall et al. Reference Hall, Browne and Forsyth1998). These thick, permeable Quaternary deposits contain extensive shallow groundwater, to depths of up to at least 30m (Ó Dochartaigh et al. Reference Ó Dochartaigh, Bonsor and Bricker2018).
Soil and superficial deposits in Glasgow also contain significant quantities of artificial ground, which often comprises building rubble and industrial waste (Hall et al. Reference Hall, Browne and Forsyth1998). This has been shown to impact on soil quality, such that metal contents are elevated in soil associated with artificial ground (Fordyce et al. Reference Fordyce, Nice, Lister, Ó Dochartaigh, Cooper, Allen, Ingham, Gowing, Vickers and Scheib2012). Furthermore, Farmer et al. (Reference Farmer, Thomas, Graham, Geelhoed, Lumsdon and Paterson2002) demonstrated the pollution of shallow groundwater from industrial waste in soil/artificial ground in Glasgow and Whalley et al. (Reference Whalley, Hursthouse, Rowlatt, Iqbal-Zahid, Vaughan and Durant1999) showed that shallow groundwater discharge may, in turn, have contributed to the pollution of surface water courses. However, most previous studies of soil and groundwater pollution, although detailed, have been site-specific. GRASP provides a means of city-scale assessment, linking information on soil quality, physical soil and Quaternary deposit characteristics and shallow groundwater properties to identify areas where shallow groundwater may be at greater risk from pollutants in near-surface materials.
Most of the tools that have been developed to assess threats to groundwater quality from pollutant migration incorporate the key factors that control metal mobility in the surface zone. Many of these tools are based on geographic information systems (GIS), which have proven to be an effective and easily implemented way of representing risks to groundwater from surface pollutants, used in a wide range of studies worldwide. One of the commonly used methodologies is DRASTIC, so called because it considers the following factors: depth to water table, net recharge, aquifer media, soil media, topography, impact of the vadose zone and hydraulic conductivity of the aquifer (Aller et al. Reference Aller, Bennett, Lehr and Petty1985). The DRASTIC method can be particularly useful where there are limited site-specific data. However, abundant data on pH, organic carbon content and metal concentrations are available for soil in the Glasgow area and these factors are not accounted for by DRASTIC. A number of other GIS-based models allow easily implemented estimates of groundwater vulnerability to be made, but do not explicitly deal with important factors such as soil pH and organic matter content (Eaton & Zaporozec Reference Eaton, Zaporozec, Chilton, Hiscock, Younger, Morris, Puri, Nash, Aldous, Tellam, Kimblin and Hennings1997; Tait et al. Reference Tait, Davison, Whittaker, Leharne and Lerner2004; Thomas & Tellam Reference Thomas and Tellam2006). ConSim (Environment Agency & Golders Associates 1999) is now widely used by environmental consultants to assess the risks to groundwater and other subsurface receptors from pollutant sources. It allows users to specify a wide range of soil and aquifer properties (e.g., thickness, fraction of organic carbon, density, porosity and hydraulic conductivity), as well as a number of pollutant-specific parameters (e.g., partition coefficient, solubility and initial concentration). However, the application is designed to deal with detailed data for a single site, and is not suitable for large numbers of sites distributed across a wide area, as is the case in this study. The number and nature of input parameters required by ConSim would incur major costs to collect on a city-wide basis and are unlikely to be available for entire urban areas.
The GRASP tool is based on a proven British Standard – International Standards Organisation (BS-ISO) methodology for qualitatively assessing the leaching threat of metals and metalloids (hereafter referred to as ‘metals') from unsaturated soil (BS-ISO 2004). Transport processes are approximated with data from the literature, and it takes into account key parameters that control the filter functions in soil. These include the soil-metal-binding force (b M), the climatic water balance (the effects of rainfall and water percolation on leaching potential) and the length of the filtration path through the unsaturated zone (based on depth to the uppermost water table). This information is combined as a series of scores to define an overall qualitative leaching potential ranking for each location under investigation for each metal. The BS-ISO method is primarily designed for site-specific assessments, but its application is also recommended for first-step overview land-use management purposes (such as the definition of groundwater protection zones, environmental impact studies and the evaluation of potential and actual contamination of soil to the groundwater) before detailed ground investigation. This last application in particular makes it an appropriate basis for the development of GRASP.
Determining the metal-binding capacity of soil is expensive and varies from metal to metal based on their ionic state, the solubility of the complexes that they form in soil, and the soil redox, pH, texture, sesquioxide and organic matter content. In general, the metals arsenic (As), lead (Pb) and copper (Cu) are less mobile than cadmium (Cd), chromium (Cr) and zinc (Zn) (Merrington & Alloway Reference Merrington and Alloway1994; Evanko & Dzombak Reference Evanko and Dzombak1997). Blume & Brummer (Reference Blume and Brummer1991) devised a method to estimate the b M using basic soil parameters (pH, clay, organic matter and sesquioxide content) from the results of field trials validated against laboratory tests for soil in Northern Europe. This forms the basis of the BS-ISO (2004) method, which categorises each individual metal b M using a scoring system from 1 (weak) to 5 (very strong), based on the relationship between individual metal-binding strength and soil pH, in a series of lookup tables. This value is adjusted by incorporating further scores that account for the influence of greater soil clay, organic matter and sesquioxide content. These scores are summed to produce the final b M value, which is then combined with scores for climatic water balance and depth to water table to produce the final leaching potential ranking (BS-ISO 2004).
The BS-ISO (2004) method has been validated for 11 metals: aluminium (Al), Fe, Cd, cobalt (Co), Cr, Cu, mercury (Hg), nickel (Ni), Mn, Pb and Zn. However, the geochemical dataset used in the present study contains no information for Hg, and it is not included in the GRASP methodology. Fe and Mn oxides exert a significant control on the mobility of other trace metals, and they are considered primarily as binding factors in the BS-ISO (2004) leaching potential method; hence, as binding factors rather than pollutant metals in the GRASP methodology. Therefore, the GRASP screening tool assesses the potential threat of leaching of eight metals (Al, Cd, Co, Cr, Cu, Ni, Pb and Zn) from soil/superficial deposits to shallow groundwater in Glasgow.
1. Methodology
1.1. Method overview
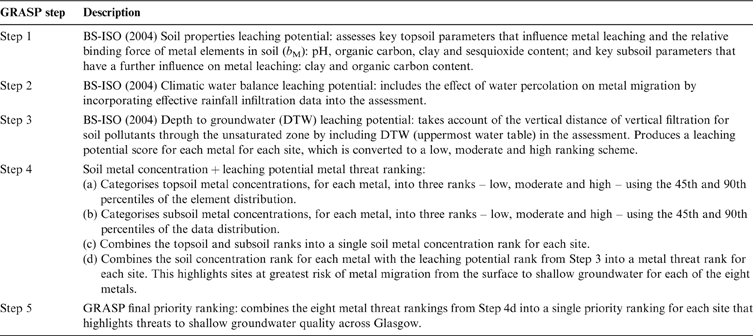
The British Geological Survey (BGS) has carried out several projects in and around Glasgow in recent years to characterise the geological and hydrogeological framework, surface geochemistry and land quality as part of the geoenvironmental Clyde and Glasgow Urban Super Project (CUSP; Ó Dochartaigh et al. Reference Ó Dochartaigh, Graham and MacDonald2007; Campbell et al. Reference Campbell, Merritt, Ó Dochartaigh, Mansour, Hughes, Fordyce, Entwisle, Monaghan and Loughlin2010; Fordyce et al. Reference Fordyce, Nice, Lister, Ó Dochartaigh, Cooper, Allen, Ingham, Gowing, Vickers and Scheib2012). In the process, a number of new, large, high-quality environmental datasets have been generated, which are integral to the GRASP methodology. GRASP is primarily based on a BGS geochemical and soil property dataset (see Section 1.2.1). The hazard associated with the potential leaching of metals from soil is calculated at each soil sample location and the outputs presented as a series of maps showing the relative threats to shallow groundwater quality. There are five steps to the GRASP tool (Table 1). The first three steps are based upon the existing BS-ISO (2004) methodology to determine soil metal leaching potential, taking into account key soil and hydrogeological parameters. Each of these factors is assigned a relative b M value and then a leaching potential hazard score from 1 to 5 on the basis of a series of validated lookup tables. Steps 1–3 are combined to give an overall qualitative leaching potential score for each location for each metal (BS-ISO 2004). GRASP is innovative in that it combines this information with actual data on soil metal concentrations at each sample location (Step 4). Step 5 produces the final output by combining the information for the individual eight metals into a single map, identifying areas of Glasgow where shallow groundwater quality is at greatest threat from the current or future leaching of metals in the soil/superficial deposits.
The five steps in the GRASP methodology.

1.2. Input datasets
1.2.1. Soil properties
Information on soil properties for GRASP is taken from the BGS Geochemical Baseline Survey of the Environment (G-BASE) soil geochemistry dataset for Glasgow (Fordyce et al. Reference Fordyce, Nice, Lister, Ó Dochartaigh, Cooper, Allen, Ingham, Gowing, Vickers and Scheib2012, Reference Fordyce, Everett, Bearcock and Lister2018). This dataset comprises 1381 urban soil samples collected at a density of 1 per 0.25km2 (on a 500-m grid) and 241 peri-urban samples at a density of 1 per 2km2 across the Glasgow conurbation (Fig. 1). Soil samples were collected at two depths from each sample location: a topsoil (5–20cm) and a subsoil (35–50cm) using a hand-held Dutch auger. Soil samples were air- and oven-dried at <30°C, sieved to <2mm and underwent X-ray Fluorescence Spectrometry (XRFS) analysis for the total concentration of approximately 50 inorganic chemical elements. Soil pH was determined using a CaCl2 slurry method and loss on ignition (LOI) assessed as a measure of soil organic carbon content (Fordyce et al. Reference Fordyce, Nice, Lister, Ó Dochartaigh, Cooper, Allen, Ingham, Gowing, Vickers and Scheib2012, Reference Fordyce, Everett, Bearcock and Lister2018). This is the fundamental dataset on which the GRASP tool is based.
Locations of the G-BASE Glasgow soil samples on which the GRASP tool is based.

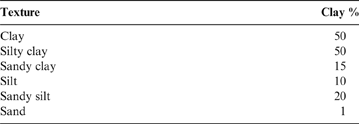
Not all of the soil properties required for the BS-ISO (2004) scheme were measured directly in the G-BASE survey; LOI was determined rather than organic carbon content. Therefore, a standard calculation is applied to convert the LOI data to organic carbon concentration (G-BASE LOI×0.58). This gives a broad indication of soil organic matter content, but can be affected by the loss of structural water in clay soil (Rowell Reference Rowell1994). Clay content was not determined, but is estimated on the basis of G-BASE soil-texture observations (Table 2). This method has been used successfully in previous studies (Fordyce & Ander Reference Fordyce and Ander2003). The BS-ISO (2004) method uses soil colour as a measure of the sesquioxide content. Soil sesquioxide content for this study is estimated from G-BASE observations of soil colour, whereby if a shade of yellow or red was recorded, this is taken to indicate high (hue ≤7.5; chroma >1) sesquioxide content (Graham et al. Reference Graham, Ó Dochartaigh, Fordyce and Ander2008).
G-BASE soil-texture observations conversion to percentage soil clay content (from Fordyce & Ander Reference Fordyce and Ander2003).

Topsoil is defined as the top 30cm of the soil profile in the BS-ISO (2004) method. For the purposes of GRASP, this equates to the 5–20cm G-BASE topsoil dataset. The BS-ISO (2004) method defines subsoil as 30cm to the depth of the uppermost water table and requires adjustments to the b M values where the subsoil is rich in organic carbon or clay. For the purposes of GRASP, these parameters in subsoil are taken from a combination of the G-BASE subsoil (35–50cm) dataset and, below this in the soil profile, information on the properties of Quaternary deposits. GRASP applies additional b M scores if either the G-BASE subsoil or the underlying Quaternary deposits are particularly rich in organic carbon or clay.
Estimates of the clay and organic matter content of Quaternary deposits are based on the interpretation of 1:50,000 scale geological maps (BGS DiGMapGB-50) and information in BGS engineering property databases. The BS-ISO (2004) method defines high organic carbon content in the subsoil as more than 1%, and high clay content as greater than 25%. The only Quaternary deposits in the Glasgow area that are considered to meet these criteria are peat (for high organic carbon) and lacustrine and glaciolacustrine deposits (for high clay content; Ó Dochartaigh et al. Reference Ó Dochartaigh, Fordyce and Bonsor2009).
1.2.2. Climatic water balance
Climatic water balance – or effective rainfall – is defined as the difference between the annual precipitation and evaporation (BS-ISO 2004). It is calculated for each soil sample location from Meteorological Office average rainfall data for the period 1961–1990 at a resolution of 1×1km2, and potential evaporation data from four Meteorological Office Rainfall and Evaporation Calculation System squares, each measuring 40×40km2 (Meteorological Office 2013).
1.2.3. Depth to groundwater (DTW)
Few accurate groundwater level measurements were available in Glasgow at the time of the development of the GRASP method. DTW level (the uppermost water table) is taken from a Scotland-wide model of the likely maximum DTW in unconfined Quaternary deposits, developed by BGS and based on river and ground surface elevation (Ball et al. Reference Ball, MacDonald, Ó Dochartaigh, Del Rio, Fitzsimons, Auton and Lilly2004; Ó Dochartaigh et al. Reference Ó Dochartaigh, Ball, MacDonald, Lilly, Fitzsimons, Del Rio and Auton2005). Validation of this map against the few available groundwater level measurements in Glasgow indicated it was accurate to within approximately 3m of the observed data (Graham et al. Reference Graham, Ó Dochartaigh, Fordyce and Ander2008; Fordyce et al. Reference Fordyce, Bonsor and Ó Dochartaigh2013). This had implications for Step 3 of the GRASP method (see Section 1.3.3).
1.2.4. Soil metal concentration
Soil metal concentration data are taken from the G-BASE Glasgow dataset (Fordyce et al. Reference Fordyce, Nice, Lister, Ó Dochartaigh, Cooper, Allen, Ingham, Gowing, Vickers and Scheib2012, Reference Fordyce, Everett, Bearcock and Lister2018).
1.3. The GRASP method
Estimates of soil metal leaching potential and threats to groundwater quality are made by applying each step of the GRASP method for each G-BASE soil sample.
1.3.1. Step 1: soil properties leaching potential
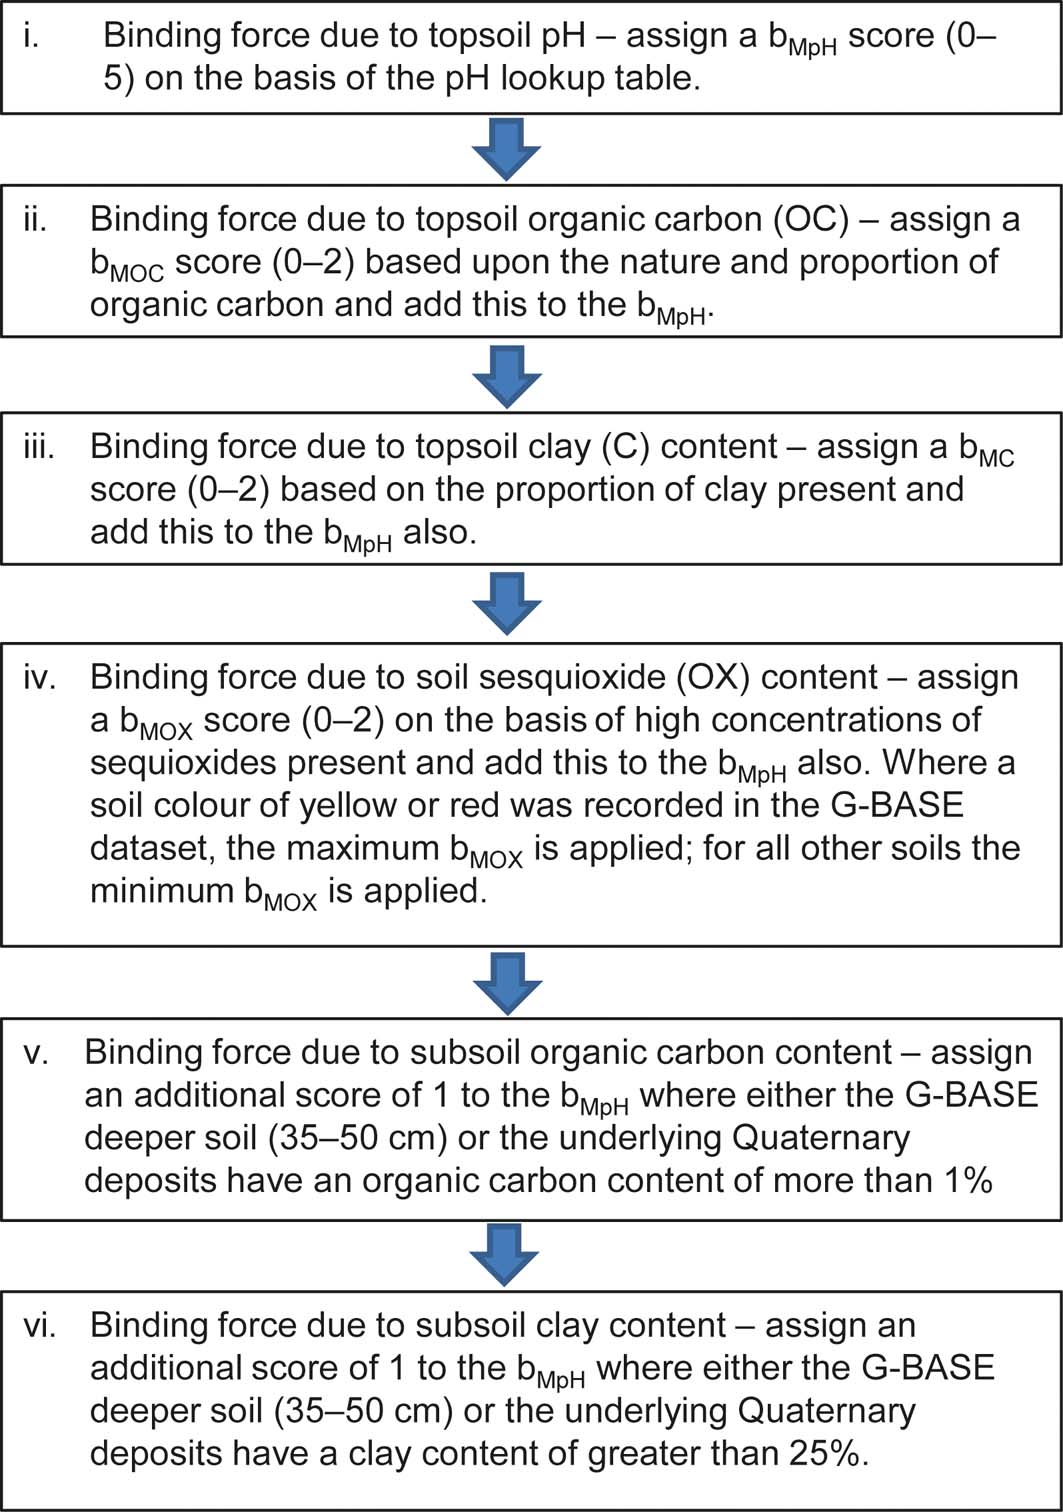
The soil properties leaching potential assessment is carried out in six stages (Fig. 2) using the validated BS-ISO (2004) lookup tables for topsoil pH, organic carbon, clay, sesquioxides and subsoil organic carbon and clay content, to assign b M values to each soil sample location for each of the eight metals. The output at the end of Step 1 is a set of b M scores from 0 (low) to 5 (high) for each soil sample location for each metal. A b M score of 5 is the maximum in the BS-ISO (2004) scheme and any b M scores calculated as greater than 5 are rounded to 5. These b M values are a measure of how well the soil is likely to bind metals in place and prevent them from leaching.
Stages used to calculate soil property leaching potential in GRASP Step 1.

1.3.2. Step 2: climatic water balance leaching potential
The b M values from Step 1 are fed into a climatic water balance lookup table (BS-ISO 2004) and a metal movement score is assigned on the basis of how mobile the metals are likely to be, depending on ranges in effective rainfall. The greater the effective rainfall, the higher the metal movement value. The output at the end of Step 2 is a set of metal movement scores from 0 (low) to 5 (high) for each soil sample location for each metal.
1.3.3. Step 3: DTW leaching potential
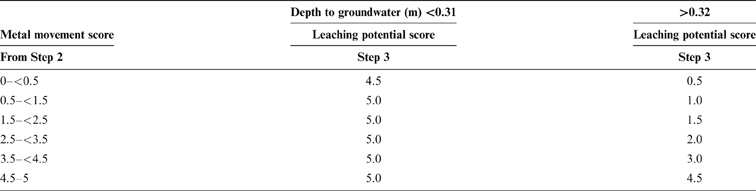
The metal movement scores from Step 2 are fed into a DTW lookup table and a leaching potential score is assigned on the basis of the length of the migration path from the soil to the groundwater. The shallower the groundwater, the higher the value, as metals have less far to travel before reaching the water table. The DTW lookup table in the BS-ISO (2004) method is categorised into detailed classes of 0.2m down to a depth of 3.5m, below which there is no further reduction in leaching potential score. However, as outlined in Section 1.2.3, the Scotland-wide modelled DTW dataset used for Glasgow is only accurate to within approximately 3m of observed data. Sub-dividing the depths according to the BS-ISO (2004) detailed classes would have misrepresented the precision of the data. Therefore, for the purposes of GRASP, two categories for DTW level are defined: (i) <3m and (ii) >3m (Table 3). When applying the BS-ISO (2004) leaching potential scores to these categories, a precautionary approach is taken. Where the modelled groundwater depth is <3m, the BS-ISO (2004) 0.4 to <0.8m low groundwater depth values are applied. This is the second highest set of scores out of the six possible depth categories that are less than 3.5m. For the >3m category, the >3.5m BS-ISO (2004) scores are used as the DTW model indicates that groundwater levels are commonly 5–10m below ground level in Glasgow (Graham et al. Reference Graham, Ó Dochartaigh, Fordyce and Ander2008). The output at the end of Step 3 is a set of leaching potential hazard scores from 1 (low) to 5 (high) for each metal for each soil sample location. In order to combine these scores with the soil metal concentration data in the further steps of the GRASP tool, these leaching potential hazard scores are converted to the relative rankings low, moderate and high according to the scheme in Table 4.
Depth-to-groundwater control on leaching potential: lookup table used in Step 3 (modified from BS-ISO 2004).

1 Leaching potential score equivalent to BS-ISO low depth to groundwater 0.4–<0.8m class.
2 Leaching potential score equivalent to BS-ISO low depth to groundwater ≥3.5m class.
Soil metal leaching potential rank at the end of Steps 1–3. BS-ISO (2004) leaching hazard scores (1–5) are grouped into low, moderate and high GRASP leaching potential ranks.

1.3.4. Step 4: combining leaching potential class and soil metal concentration
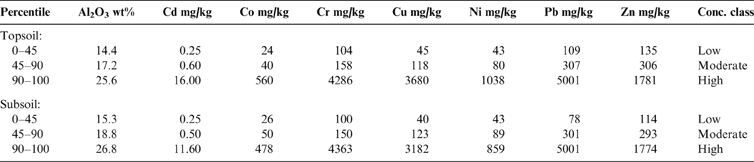
In Step 4, the soil metal concentration data are combined with the leaching potential ranks determined in Step 3 to produce a threat rank for each metal. This is done in four sub-steps, the first two of which are to consider the soil metal content (Table 1). In terms of the hazard associated with soil metal concentration, most soil types have the capacity to attenuate and strongly bind metals, but at very high metal concentrations this capacity can be exceeded. The assumption that sorption is a linear process breaks down at high metal concentrations, and the threat of leaching increases rapidly. The soil can effectively reach a ‘saturation point' whereby all the exchange sites to trap metals have been filled and the soil loses the capacity to retain further metal loadings, although, in general, the situation is reversible. The degree to which this happens depends on the physiochemical properties of the soil, the climate and the concentration and combination of the metals present (Sposito Reference Sposito1989; McBride Reference McBride1994). In the GRASP method, the binding capacity and likely mobility of each soil metal are taken into account in Steps 1–3. When including soil metal concentration in the tool, the aim is to identify areas where soil metal loadings are already high; hence, the retention capacity of the soil/superficial deposits is more likely to be exceeded by current contaminant loadings or by future pollution events. As a starting point, it is assumed that soil types with higher metal concentrations pose an inherently greater threat of leaching to groundwater than soil with low metal contents. To reflect this, the metal concentrations are categorised into relative, low, moderate and high hazard ranks based on percentiles of the data distributions. The upper cut-off is set at the 90th percentile as these soil metal concentrations are, for the most part, of a similar order to generic Soil Screening Levels for groundwater protection recommended in the US (US-EPA 1996). The lower cut-off value is set at the 45th percentile (Table 5).
Soil metal concentration ranks based on percentiles of the data distribution used in Steps 4a and 4b. Conc.=total concentration by X-ray Fluorescence Spectrometry.

The soil metal concentrations and leaching potential classes are combined in Steps 4a–d, outlined in Table 1 according to the following scheme:
Step 4a: assign a set of low, moderate and high topsoil (5–20cm) metal concentration ranks for each metal for each soil sample location based on the percentile cut-offs (Table 5).
Step 4b: assign a set of low, moderate and high subsoil (35–50cm) metal concentration ranks for each metal for each soil sample location based on the percentile cut-offs (Table 5).
Step 4c: combine the topsoil and subsoil concentration ranks into one soil concentration rank using a precautionary approach, whereby the highest rank from either soil depth is taken (Table 6).
Table 6Matrix defining how topsoil and subsoil metal concentration ranks are combined in Step 4c to give one soil concentration rank for each metal for each soil site. Abbreviations: L=low; M=moderate; H=high.

Step 4d: combine the soil metal concentration ranks with the leaching potential ranks from Step 3 to define a GRASP metal threat rank (low, moderate, high or very high) for each metal at each soil sample location (Table 7).
Table 7Matrix defining how leaching potential rank from Step 3 and soil metal concentration rank from Step 4c are combined in Step 4d to give a metal threat rank for each metal for each soil site. Abbreviations: L=low; M=moderate; H=high; VH=very high.


Where both the soil leaching potential and the soil metal ranks are ‘high', a metal threat rank of ‘very high' is assigned to reflect the greater likelihood of metals impacting on shallow groundwater quality at these locations.
The output at the end of Step 4 is a set of GRASP metal threat ranks (low, moderate, high and very high) for each metal for each soil sample location.
1.3.5. Step 5: GRASP final priority ranking
In Step 5, the eight individual metal threat rankings from Step 4d are combined into one overall prioritisation ranking. The highest ranking for any metal at a soil site determines the final ranking; thus adopting a precautionary principle (Table 8). Locations with a ‘very high' ranking are of greatest priority for further investigation or care in future developments and management actions.
Criteria for combining the eight individual metal threat rankings from Step 4d into a single priority ranking in Step 5.

1.4. Data presentation and analysis
Steps 1–5 of the GRASP methodology were developed to run as a batch process within a Microsoft Excel® worksheet environment, using Visual Basic programming language to facilitate the rapid handling of eight metals for 1622 soil sample locations. The results were imported into a GIS (ArcGIS, Environmental Systems Research Institute, ESRI®) to enable rapid spatial analysis and visualisation of the results. For validation studies, statistical analyses were carried out in Microsoft Excel®, with the exception of analysis of variance (ANOVA)–Tukey tests, which were undertaken in Minitab®.
2. Results and discussion
The outputs at the end of Steps 3–5 of the GRASP method are a series of metal leaching potential hazard ranks for each soil sample location. These can be plotted as maps showing relative potential threats to shallow groundwater quality from soil pollution across Glasgow. The map outputs from each step are discussed in the following sections.
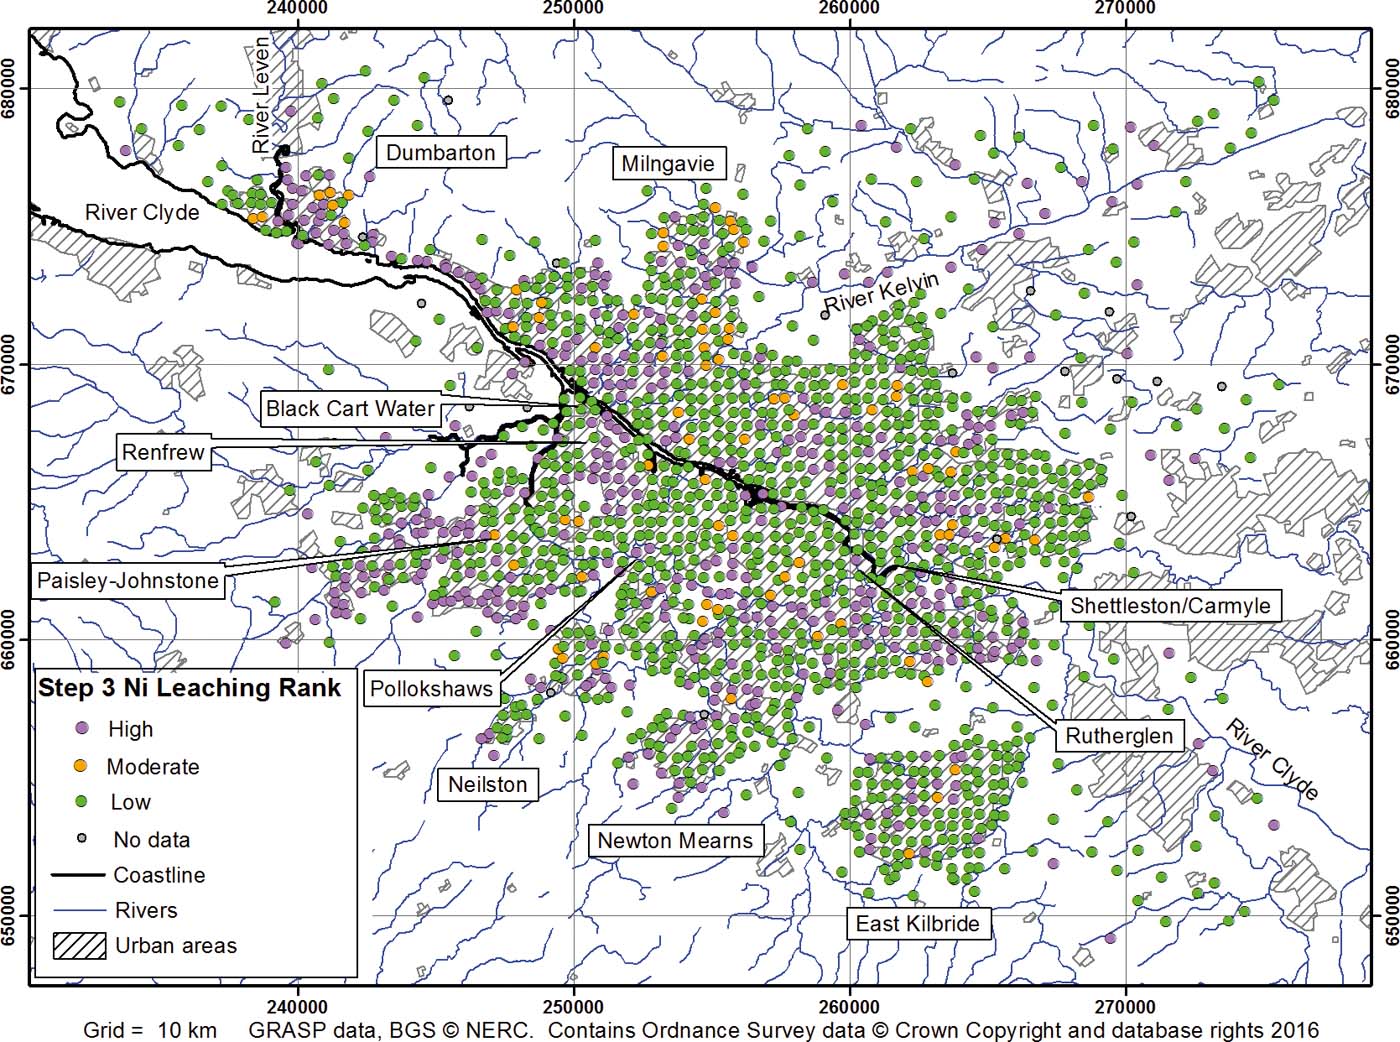
2.1. Step 3: soil metal leaching potential rank
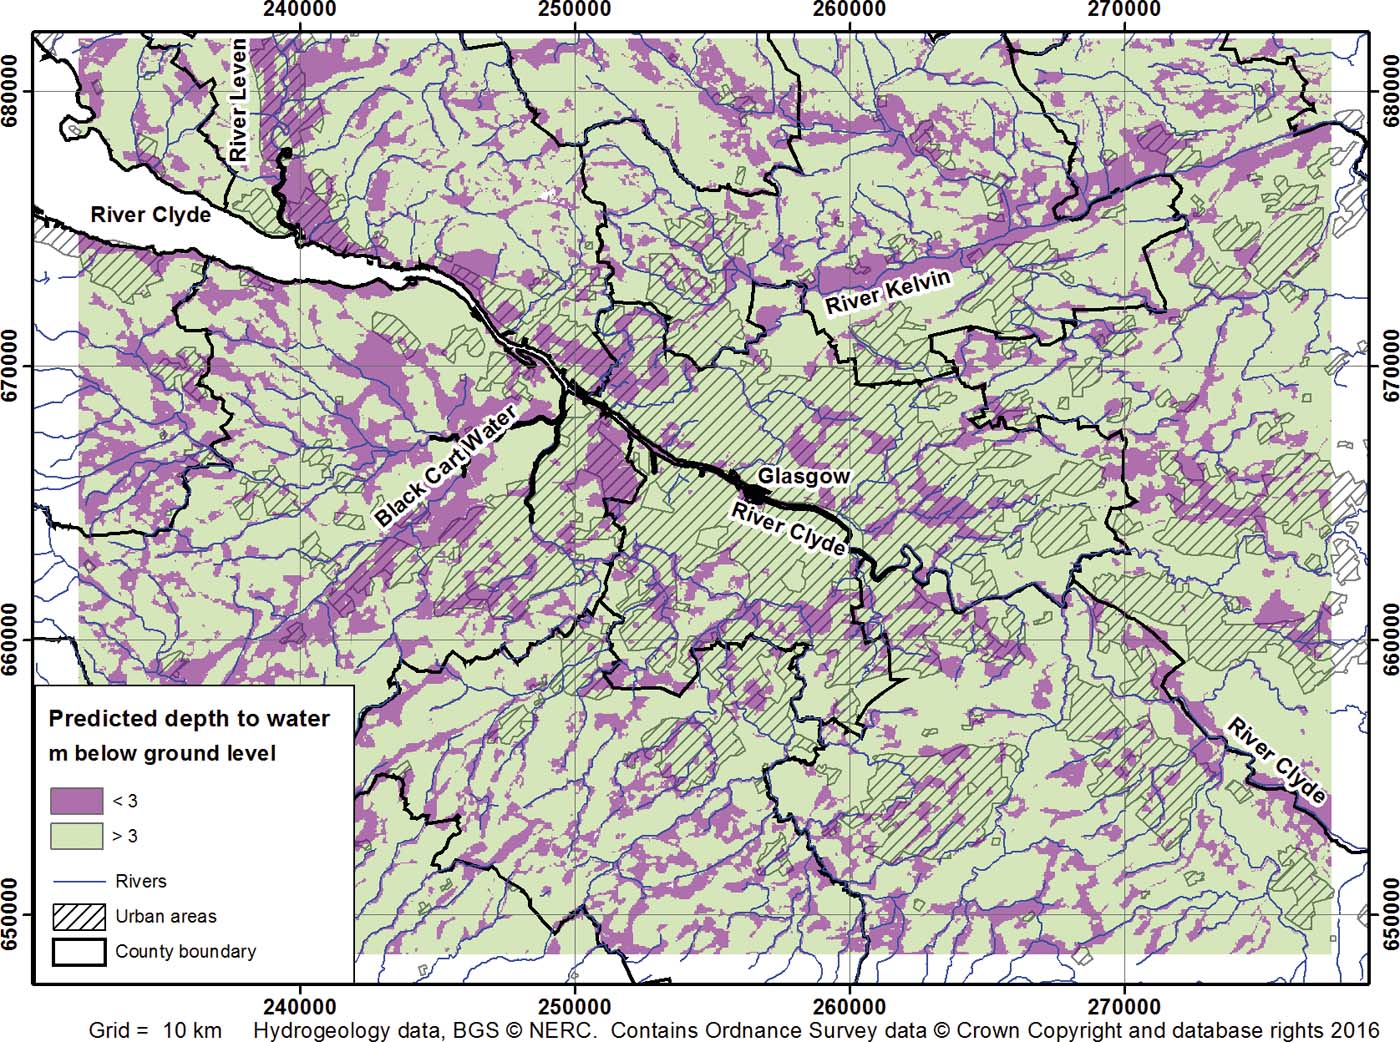
An example of a map output from Step 3 is shown in Figure 3 for Ni. The main control on the distribution of sites with low, moderate and high leaching potential for all the individual metals is DTW as the BS-ISO (2004) methodology is highly sensitive to this input parameter (see Section 2.5; Graham et al. Reference Graham, Ó Dochartaigh, Fordyce and Ander2008; Lovatt Reference Lovatt2008; Ó Dochartaigh et al. Reference Ó Dochartaigh, Fordyce and Bonsor2009). This reflects the fact that depth to water is a strong control on groundwater vulnerability (Ó Dochartaigh et al. Reference Ó Dochartaigh, Ball, MacDonald, Lilly, Fitzsimons, Del Rio and Auton2005; Carey & Thursten Reference Carey and Thursten2014). In particular, shallow DTW in the valleys of the Rivers Clyde, Kelvin, Leven and Black Cart Water has a significant control on the distribution of soil sites classed as having high leaching potential for each metal (Figs 3, 4). Although there is uncertainty in the accuracy of the DTW input dataset, groundwater levels are typically shallower in river valleys than in upland areas, so this distribution is expected. The sensitivity of the GRASP method to the DTW input is discussed further in Section 2.5.2.
Map of GRASP Step 3 soil metal leaching potential rank for Ni across Glasgow.

Map of predicted depth to groundwater in the Glasgow area (based on BGS data; Ball et al. Reference Ball, MacDonald, Ó Dochartaigh, Del Rio, Fitzsimons, Auton and Lilly2004; Ó Dochartaigh et al. Reference Ó Dochartaigh, Ball, MacDonald, Lilly, Fitzsimons, Del Rio and Auton2005).

2.2. Step 4c: soil metal concentration rank
The topsoil and subsoil metal concentration ranks are combined into a single soil metal concentration rank for each site in Step 4c. For most metals, approximately 30 % of the sites are classed as having low soil metal concentrations, 50 % of sites are classed as moderate and 15 % as high. However, for Cd, approximately 80 % of the sites fall into the low soil metal rank, because of the high proportion of values below the analytical detection limit.
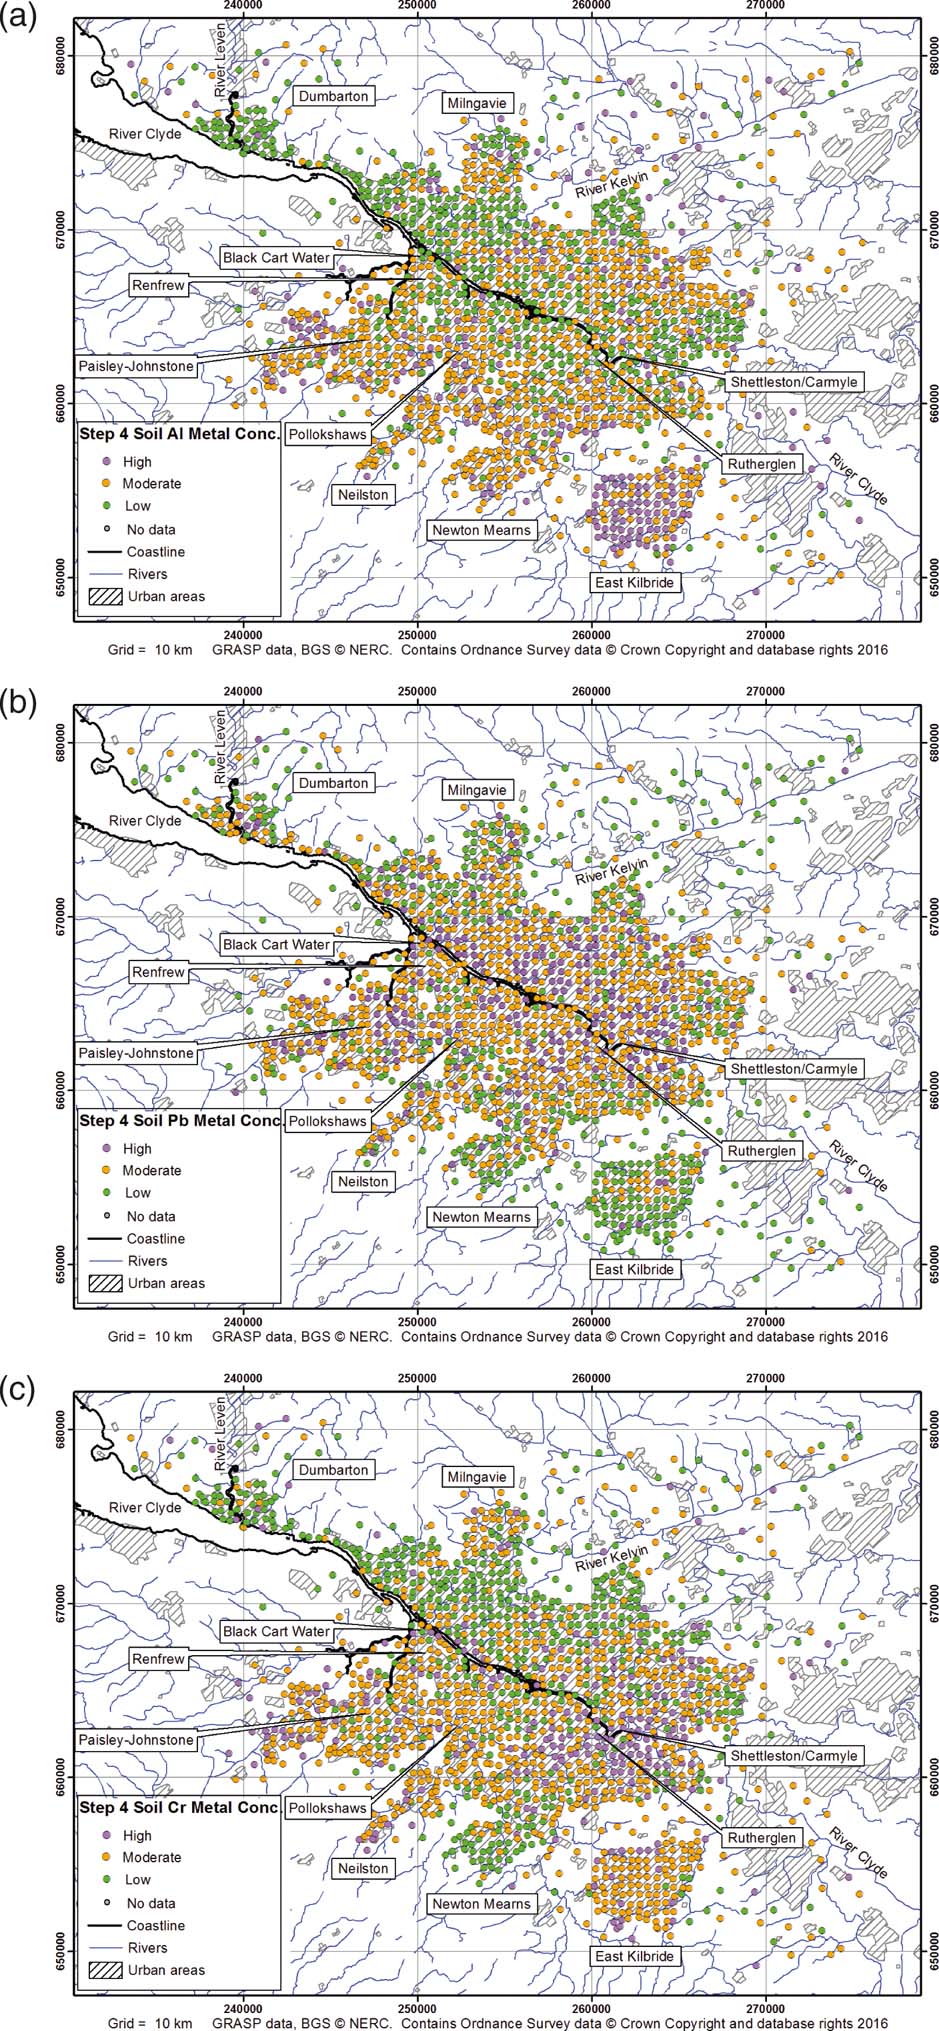
The distribution of these soil concentration ranks in Step 4c can be explained by dividing the metals into three groups. Example maps of these rankings for Al, Pb and Cr representing each of the groups are shown in Figure 5. The differences between the groups are described as follows.
Maps of GRASP Step 4c soil metal concentration ranks for (a) Al, (b) Pb and (c) Cr across Glasgow.

2.2.1. Al – bedrock geology control
The map for Al shows a prevalence of sites ranked as low concentration across N and NW Glasgow (Fig. 5a). High-ranked sites predominate on the southern periphery of the urban area, in the vicinity of Johnstone, Newton Mearns and East Kilbride. The distribution of Al in soil is heavily influenced by bedrock geology. Areas with higher Al soil concentrations around Johnstone, Newton Mearns and East Kilbride are all underlain by lavas of the Clyde Plateau Volcanic Formation, which are naturally high in Al (Fordyce et al. Reference Fordyce, Nice, Lister, Ó Dochartaigh, Cooper, Allen, Ingham, Gowing, Vickers and Scheib2012).
2.2.2. Cd, Cu, Pb and Zn – urban control
The distribution of Cd, Cu, Pb and Zn in soil is largely controlled by pollution from industrial and urban processes (Fordyce et al. Reference Fordyce, Nice, Lister, Ó Dochartaigh, Cooper, Allen, Ingham, Gowing, Vickers and Scheib2012, Reference Fordyce, Everett, Bearcock and Lister2018). Shipyards, heavy engineering, steel manufacturers, railway yards, gas works and other heavy industries, which are all sources of these metals in the environment, were present across large areas of central and eastern Glasgow, the River Clyde corridor, Paisley and Johnstone during much of the 19th and 20th centuries, and are likely to be a key control on the clusters of high soil metal concentrations in these areas (Fig. 5b). The distributions of these metals are also influenced by the traffic network, with higher concentrations in central Glasgow and in the centre of East Kilbride. By contrast, low concentrations are located in the rural environment around Glasgow, in the suburban periphery of East Kilbride, Newton Mearns, N Glasgow and Milngavie.
2.2.3. Co, Cr and Ni – mixed bedrock geology and urban control
The distribution of sites with high soil metal concentration for the third group of metals, comprising Co, Cr and Ni, shows features from both of the first two groups (Fig. 5c). This reflects a mixed control on soil metal concentrations by both the local geology and the presence of former industrial sites. On the one hand, soil concentrations are naturally high in areas underlain by the Clyde Plateau Volcanic Formation in Johnstone, Neilston and NW East Kilbride. On the other hand, Cr and Ni concentrations in Johnstone are also influenced by the presence of artificial ground and urban pollution. Similarly, a marked cluster of high metal rankings is evident in the Rutherglen area, associated with the former metalworking heartland of the East End, including the world's largest chrome-producing works, which was active during the 19th Century (Fordyce et al. Reference Fordyce, Nice, Lister, Ó Dochartaigh, Cooper, Allen, Ingham, Gowing, Vickers and Scheib2012, Reference Fordyce, Everett, Bearcock and Lister2018). High soil concentrations of these metals are also associated with the ship building corridor along the River Clyde.
2.3. Step 4d: combined soil metal concentration/leaching potential ranking
In Step 4d, the soil metal concentration ranks are combined with the soil leaching potential ranks from Step 3 to produce a metal threat rank for each metal at each soil site. Where both the leaching potential and soil metal concentration are high, a very high metal threat ranking is assigned. With the exception of Cd, approximately 25 % of the sites for each metal have a low metal threat ranking. The majority of sites for each metal have a moderate (approximately 40 %) or high (approximately 33 %) metal threat ranking. This is a consequence of the precautionary approach taken, whereby the highest ranking from either the soil metal concentration classification or the Step 3 leaching potential classification determines the metal threat rank. For Cd, 59 % of the sites have a low metal threat ranking because of the large number of soil Cd concentrations below the analytical detection limit. Only 5 % of the sites have a moderate metal threat ranking, and approximately 5 % of sites a very high metal threat rank for Cd.
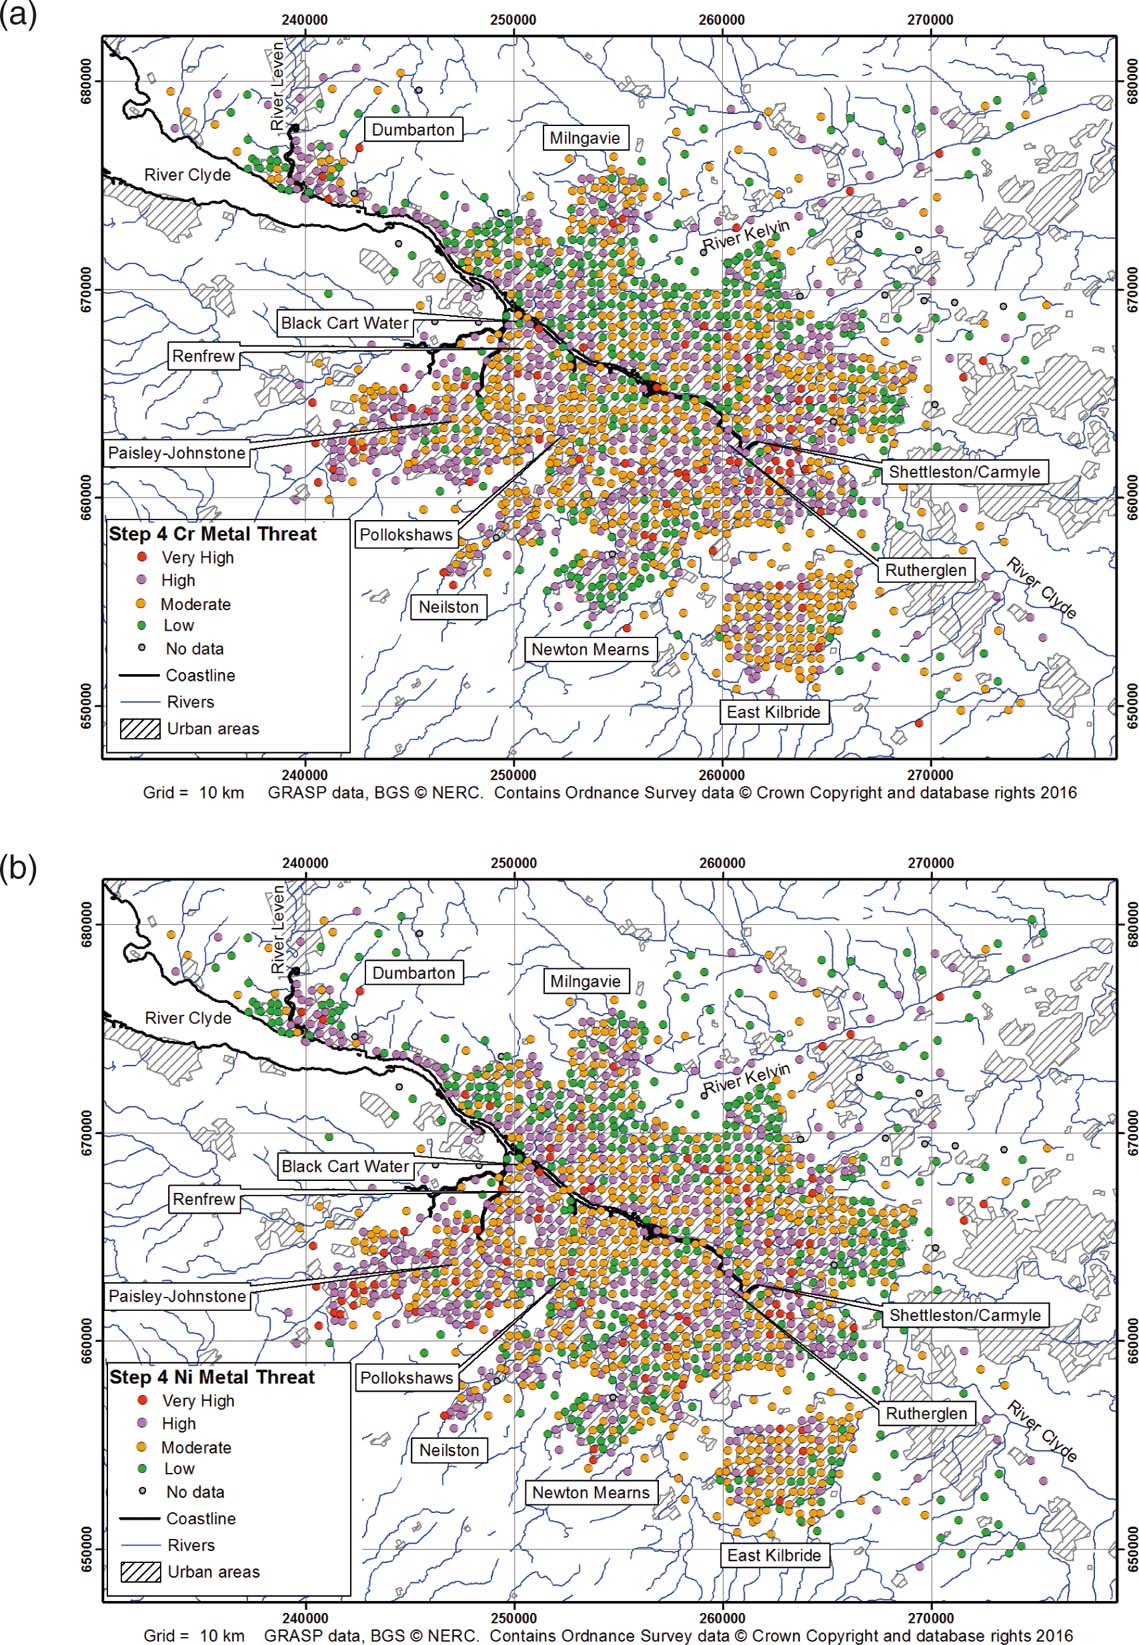
The output at the end of Step 4d is a series of maps showing the metal threat rankings at each soil site for each metal across Glasgow. A number of patterns stand out and these are exemplified by the results for Cr and Ni presented in Figure 6. Areas dominated by soil sites with very high metal threat rankings are focussed in the valleys of the rivers Kelvin, Leven, Black Cart Water and Clyde, reflecting the strong control of shallow DTW on the soil leaching potential. Small clusters of very high metal threat rankings on the southern fringes of Glasgow, in an area to the N of the city centre and in an E–W band across southern Glasgow, are also associated with shallow groundwater levels.
Maps of GRASP Step 4d metal threat ranks for (a) Cr and (b) Ni across Glasgow.

However, the very high rankings also reflect high soil metal concentrations. These include naturally higher concentrations of soil Al and, to a lesser extent, Cd, Co, Cr and Ni in the Kelvin valley, and in the S of Glasgow of Al, Co, Cr and Ni around Johnstone, Neilston, Newton Mearns and East Kilbride, the latter associated with the Clyde Plateau Volcanic Formation.
The very high metal threat rankings from Step 4d are also influenced by higher soil Cd, Co, Cr, Cu, Ni, Pb and Zn associated with artificial ground and areas of former ship building, heavy industry and urban pollution along the Clyde corridor, in the East End of Glasgow, the Johnstone area, small clusters to the N of the city centre and in an E–W band across southern Glasgow in the Carmyle–Pollokshaws area (Fordyce et al. Reference Fordyce, Nice, Lister, Ó Dochartaigh, Cooper, Allen, Ingham, Gowing, Vickers and Scheib2012, Reference Fordyce, Everett, Bearcock and Lister2018).
2.4. Step 5: GRASP final priority rank
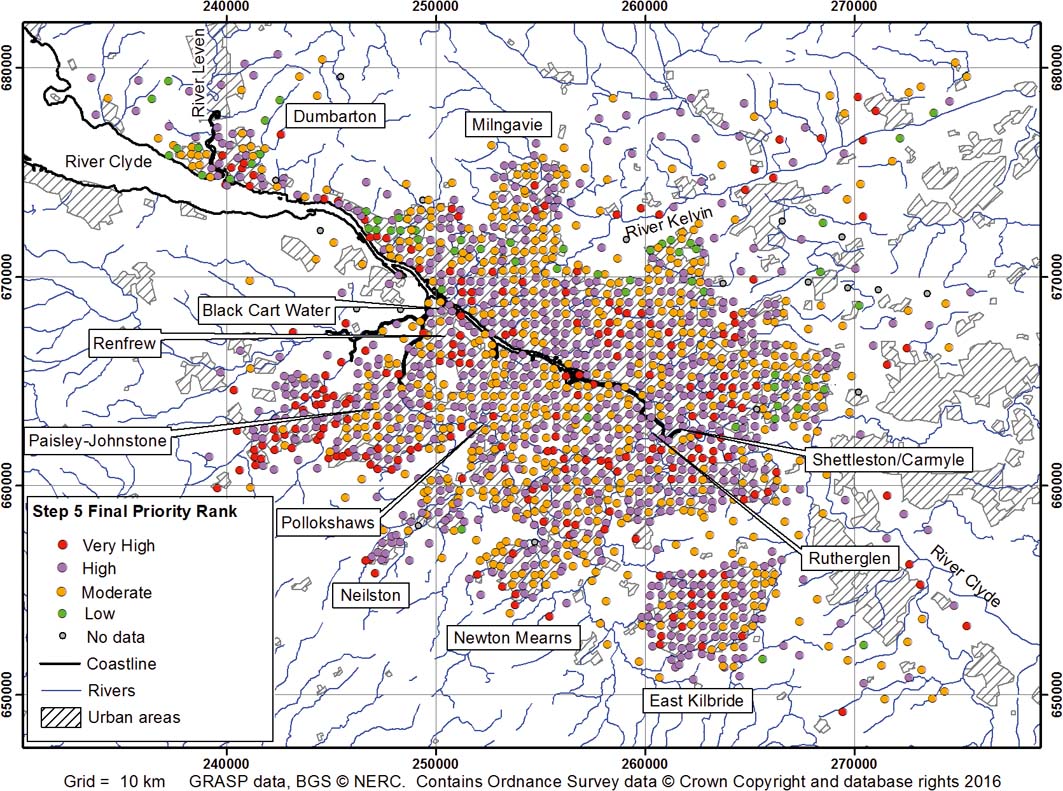
In the final step of the GRASP tool, the eight metal threat rankings from Step 4d for each metal are compiled into one overall priority ranking for all the metals for each site. Four percent of the sites have a low final priority ranking, 37 % have a moderate ranking, 46 % have a high final priority ranking and 13 % a very high priority ranking. Again, this is a consequence of the precautionary approach taken, whereby the highest metal threat rank of any individual metal determines the overall ranking.
A map of the GRASP final priority rankings of soil leaching threat to shallow groundwater quality is presented in Figure 7. The very high rank focuses attention on sites where metals in soil are most likely to migrate to shallow groundwater, reflecting both locations where soil metal concentrations are known to be high – hence, where soil-binding force is most likely to be superseded – and where leaching potential is also high. These areas are likely to be most vulnerable to current and future pollution and should be prioritised for attention in terms of groundwater protection.
Map of GRASP Step 5 priority ranking of soil leaching threat to shallow groundwater quality across Glasgow.

As in Step 4, a major control on the distribution of sites with very high overall ranking is shallow groundwater levels, which occur in a band across the S of the city (Carmyle–Pollokshaws) and in the valleys of the River Clyde, the River Kelvin, the River Leven at Dumbarton and the Black Cart Water in the Paisley–Johnstone–Renfrew areas. Shallow groundwater levels also influence the sites with very high rankings to the N of the city centre, on the city's southern fringes, in the East End and in East Kilbride.
The distribution of very high priority sites also reflects high soil metal concentrations at these locations. As discussed in Section 2.2, these high metal concentrations may be natural (e.g., related to bedrock geology in East Kilbride and the southern edge of the city) or associated with pollution in former industrial areas (e.g., Paisley–Renfrew, East End–Rutherglen and the River Clyde corridor) or with pollution related to artificial ground, such as in Dumbarton and sporadic locations to the N and S of the city centre.
2.5. Validation of the GRASP predictions
2.5.1. Groundwater chemistry
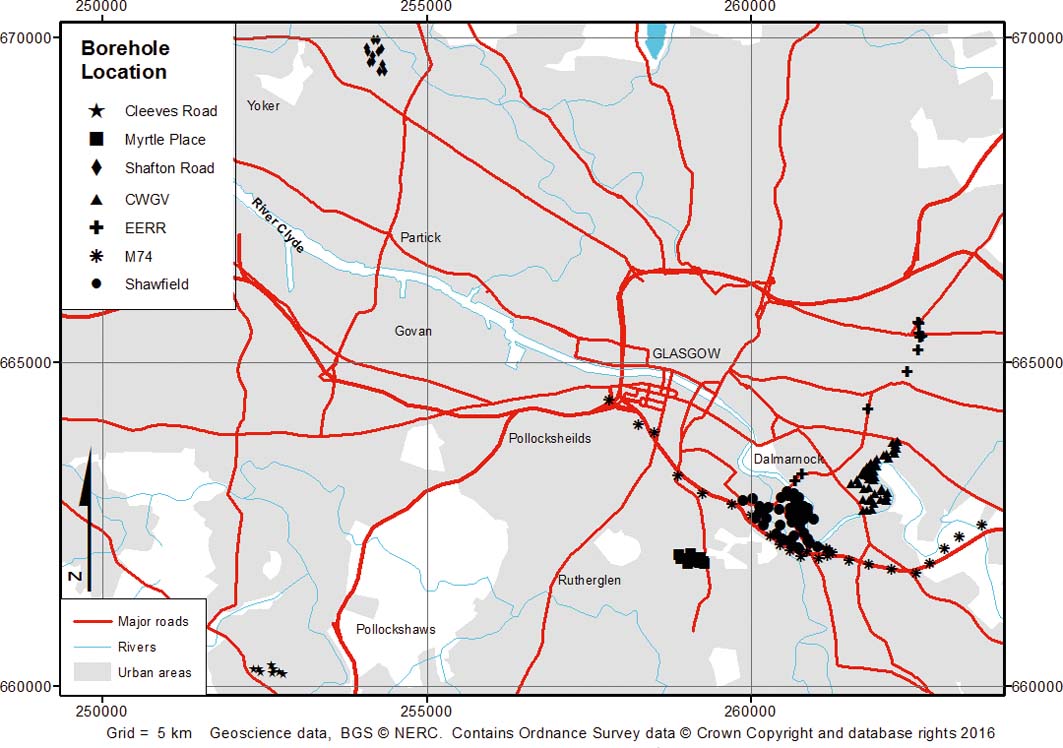
To test whether shallow groundwater quality is impacted by metal pollution in the areas highlighted by the GRASP tool as being at greatest risk of soil metal leaching, a validation exercise was performed using existing groundwater chemistry data. Available groundwater chemistry data for Glasgow are clustered in areas of the city where recent redevelopment work has taken place in former industrial areas. Therefore, preliminary validation efforts focussed on a small area in the East End of Glasgow (Shawfield and M74 corridor; see Fig. 8 for locations) where most groundwater data were available, including information on Cr concentrations in shallow groundwater in site investigation boreholes. The aim was to assess whether shallow groundwater high Cr concentrations were spatially coincident with GRASP soil sites with very high metal threat and priority ranks. Spatial comparisons revealed a partial match of high Cr concentrations in groundwater and the GRASP very high priority rank locations. Groundwater Cr concentrations were highly variable over short distances (<100m), with low to very high concentrations associated with GRASP Step 4d Cr very high metal threat rankings and with the Step 5 GRASP final prioritisation very high ranking (Fordyce & Ó Dochartaigh Reference Fordyce and Ó Dochartaigh2011).
Boreholes where groundwater chemistry data were available for GRASP validation (modified from McCuaig Reference McCuaig2011). Abbreviations: CWGV=Commonwealth Games Village; EERR=East End Regeneration Route.

Since the processes governing metals leaching from soil/superficial materials to shallow groundwater are likely to take place over tens to hundreds of years and may have considerable lag times, ideally, soil pore-water chemistry would be a useful indicator of the mobility of metals from soil into solution against which to validate the GRASP method, as these have been used in similar groundwater validation exercises (Spijker et al. Reference Spijker, Groenenberg and Comans2014). However, there are no soil pore-water chemistry data available for Glasgow, but a more comprehensive validation exercise based on groundwater chemistry data was carried out by McCuaig (Reference McCuaig2011).
Shallow groundwater chemistry data were obtained from site investigation borehole records collated by Glasgow City Council (GCC) and BGS. Groundwater concentration data were available for Cd, Co, Cr, Ni, Pb and Zn in seven areas, mainly in the East End of Glasgow (Fig. 8). The groundwater chemistry data were categorised according to depth and likely Quaternary deposit unit. They were compared, spatially and statistically, to the GRASP outputs and to the G-BASE soil chemistry dataset in order to test whether high soil metal concentrations and/or very high GRASP priority ranks corresponded to areas of high groundwater metal concentration. Comparisons between borehole groundwater chemistry and soil chemistry were carried out using the ‘spatial join' function in ArcGIS to link each borehole location to interpolated surface maps of the soil geochemistry data to estimate the soil metal concentration at each borehole site. The interpolated geochemical maps are described in Fordyce et al. (Reference Fordyce, Everett, Bearcock and Lister2018). The distributions of metal concentration in groundwater and soil were positively skewed; hence, the data were log transformed prior to statistical analysis. Soil and groundwater metal concentrations from the same location were compared using Pearson correlation coefficients. The results revealed positive correlations for Cr and Cu (r 2>0.152; P<0.05). In the case of Cr, this was likely due to the presence of Cr waste from a former Cr-ore processing plant in the study area.
In the second stage of the validation exercise, the GRASP rankings in Steps 3–5 were converted from a point format to a continuous grid within ArcGIS. A 500-m grid was adopted across Glasgow to match the resolution of the soil data. Each grid cell was assigned the GRASP ranking from the soil sample site it contained. Boreholes, for which groundwater chemistry data were available, were categorised according to whether they fell within grid cells classed as low, medium, high or very high GRASP Step 3–5 rankings.
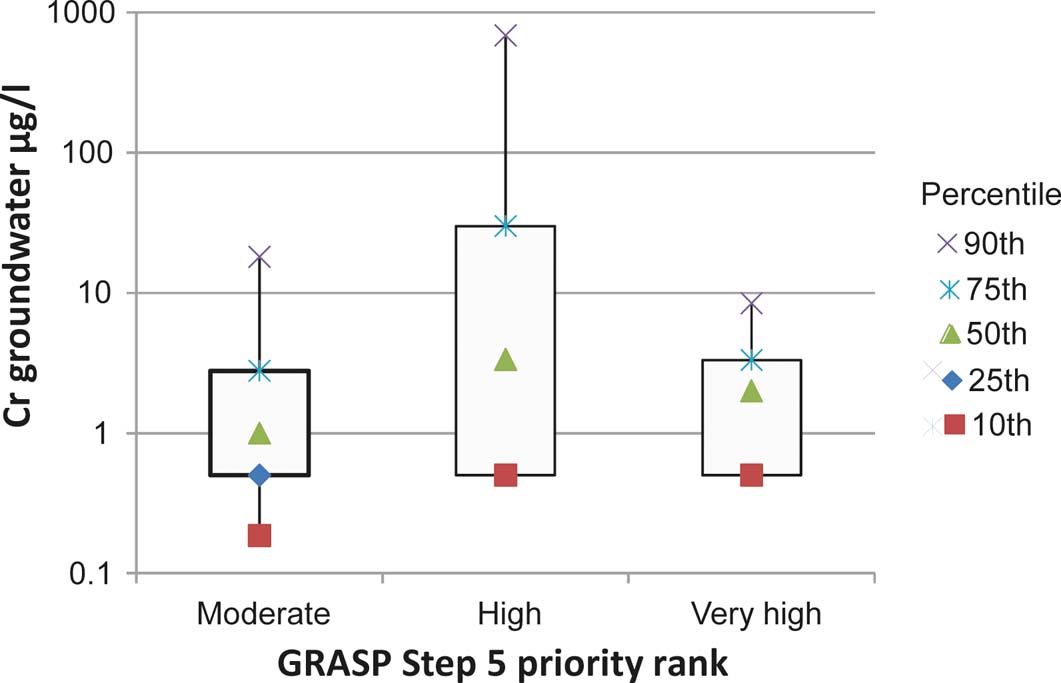
For the Step 5 final priority rankings, all the boreholes were categorised as medium to very high GRASP ranks. Groundwater metal concentrations from boreholes in each of the GRASP ranks were then assessed. For example, the range of Cr groundwater concentrations in boreholes from each of the Step 5 rankings is shown in Figure 9.
Box and whisker plots of the 10th, 25th, 50th, 75th and 90th percentiles of Cr groundwater concentrations in boreholes, categorised by GRASP Step 5 priority ranks. Number of boreholes: moderate=32; high=122; very high=15.

Tukey tests with one-way ANOVA were used to determine any notable distinctions in groundwater metal concentration between the GRASP rankings in Steps 3–5. The results only showed a statistically significant difference (P=0.05) in mean groundwater concentration for Cr (Step 4d: low and high metal threat ranks; low and medium metal threat ranks; Step 5 medium and high priority ranks) and Cu (Step 4d: low and medium metal threat ranks).
These results demonstrate that there is some association between soil and shallow groundwater concentrations for the metals Cr and Cu. However, the controls on shallow groundwater chemistry, particularly in east-central Glasgow, are multifaceted. The complex hydrogeology of the natural Quaternary deposits and of artificial ground, with highly variable lithologies and permeabilities and the presence of urban water flows leaking from mains water or sewerage networks, results in complicated groundwater flow paths and behaviour (Ó Dochartaigh et al. Reference Ó Dochartaigh, Bonsor and Bricker2018). This is exemplified by the wide variability in shallow groundwater chemistry observed over small areas in the post-industrial East End of Glasgow. Although previous site investigations have demonstrated a link between soil and groundwater chemistry in the East End (Bewley Reference Bewley2007), the G-BASE soil survey, on which GRASP is based, at 500m spacing may not be at a high enough spatial resolution to predict the observed degree of variability in shallow groundwater chemistry here. The groundwater chemistry data used to validate GRASP are predominantly available for Glasgow's East End only, where most large-scale recent developments (i.e., site investigations and borehole drilling) in the city have taken place. It is not known whether other parts of the city, such as residential zones that have remained relatively undisturbed for decades or areas with naturally elevated soil metal concentrations, show similar variability in Quaternary groundwater chemistry, as no groundwater chemistry data are available in these areas.
However, the variability in groundwater chemistry was partially impacted by the differing sampling and analytical procedures adopted by the various organisations generating the site investigation data. These included the collection of groundwater samples from boreholes of varying depths penetrating different Quaternary lithologies and of mixed samples that average groundwater quality over the length of a borehole. The latter may mask the influence of any discrete groundwater inflows at different depths, which may have very different chemistry. A variety of analytical techniques with different detection limits and possible reporting errors such as in chemical units were also noted in the site investigation datasets. These factors highlight the difficulty in trying to use existing site investigation information for scientific studies. The validation studies (Fordyce & Ó Dochartaigh Reference Fordyce and Ó Dochartaigh2011; McCuaig Reference McCuaig2011) demonstrated the need for a systematic approach to the collection of subsurface physical and chemical data during site investigations if such data are to be effectively reused in wider groundwater assessments and urban management. A standardised approach to site investigation data collation is currently being trialled in Glasgow within the Assessing Subsurface Knowledge (ASK) network (BGS 2012). This network promotes the use of existing systematic standards and formats for digital data collection, transfer and management. The approach is now a framework requirement for any ground investigation work commissioned by GCC. It is hoped that these standardised procedures will improve the quality of, access to and comparability between subsurface datasets, enhancing their relevance and application to sustainable urban development. Glasgow provides an exemplar of the ASK network, which is beginning to be endorsed by other national stakeholders and regions in the UK, as well as in Europe. The latter, through the European Cooperation in Science and Technology (COST) SUB-URBAN network to improve data quality and reduce uncertainty in urban planning and development (COST 2016). In the case of the GRASP screening tool, once more groundwater chemistry data become available from these networks, it should be possible to validate the method further.
2.5.2. Depth to water
The BS-ISO leaching potential method on which the GRASP tool is based is highly sensitive to the DTW input parameter (BS-ISO 2004). The sensitivity of the GRASP method to the DTW input parameter was assessed by Lovatt (Reference Lovatt2008). Starting with the initial DTW dataset, a 5% increase in depth to water was applied, and raised by progressively larger percentages, up to a maximum of 150%. The GRASP tool was rerun with each increase, to determine the maximum difference in the GRASP outputs. Similarly, decreases of between −2 and −75% were then applied to the DTW data and the GRASP tool rerun each time. Analysis showed that GRASP was sensitive to decreases, but not to increases in DTW values. This is because the GRASP DTW parameter is categorised into two classes only (0–3m and >3m). The DTW dataset used for GRASP shows most groundwater levels in Glasgow to be deeper than 3m; hence, increasing the DTW had little or no effect on the final GRASP priority rankings. By contrast, decreasing DTW by 75% from its original figure meant that most values were <3m. As a result, almost all of the GRASP Step 5 priority rankings were high or very high. As discussed in Section 1.3.3, the DTW dataset used in the GRASP tool is derived from a Scotland-wide model and is only accurate to within approximately 3m of observed data. Given the sensitivity of the GRASP method to the DTW parameter, attempts were made to collate a DTW dataset, based on observed data collected from site investigation borehole records held by GCC and BGS, for a test area in central Glasgow (Lovatt Reference Lovatt2008). This revealed that there was very little available, reliable, measured DTW data for Glasgow. Reliable data were limited to areas of recent large-scale regeneration or infrastructure developments such as the M74 extension (see Fig. 8 for location). This made the generation of a robust DTW map based on observed data across the city difficult and highlighted the need for a systematic DTW dataset for Glasgow. A dedicated pilot groundwater level monitoring network in a small area of E Glasgow has been established by the BGS in collaboration with GCC (Bonsor et al. Reference Bonsor, Bricker, Ó Dochartaigh and Lawrie2010; Ó Dochartaigh et al. Reference Ó Dochartaigh, Bonsor and Bricker2012). The improved groundwater level data that this network will generate will help to validate the DTW model in this area of Glasgow. However, this is only a small part of the city. There remains a need to standardise and increase the availability of reliable groundwater level data to better inform urban environmental assessment in the future. The ASK Network should help in this regard (BGS 2012), as should new cooperation between GCC and SEPA, to identify and equip new groundwater monitoring boreholes in targeted areas.
2.5.3. Other factors
Based on the results and experience of this trial study, several further possible explanations as to why the GRASP tool shows only partial spatial concurrence between soil and shallow groundwater chemistry were evident. These include the following factors, which are recommended to form the basis of further development of such threats to shallow groundwater chemistry tools in the future.
The BS-ISO (2004) leaching potential methodology, on which the tool is based, has been validated on typical Northern European rural soil, rather than on urban soil (Blume & Brummer Reference Blume and Brummer1991). Urban soil commonly has a very different structure to that of rural soil and contains extraneous non-soil materials (e.g., building rubble, coal residues, metal, ceramic, glass and plastic fragments; Fordyce et al. Reference Fordyce, Nice, Lister, Ó Dochartaigh, Cooper, Allen, Ingham, Gowing, Vickers and Scheib2012), which are likely to alter the leaching behaviour of metals. Further validation studies based on urban soil may be helpful to improve pollutant leaching potential estimates generated by methods such as BS-ISO (2004).
Climatic water balance in the BS-ISO (2004) method is defined as the difference between annual precipitation and evaporation. However, in terms of the future development of tools such as GRASP, the meaning of the climatic water balance parameter is important to clarify. In reality, precipitation minus evaporation is not equal to the volume of water available for infiltration and groundwater recharge (i.e., groundwater renewal). Even in rural areas, a proportion of rainfall is diverted to surface run-off. In urban areas, where there is extensive surface sealing, this proportion is likely to be significantly higher. The BS-ISO methodology is reported to have medium sensitivity to the climatic water balance parameter (BS-ISO 2004); hence, the discrepancy between calculated and actual infiltration may be significant. It should also be noted that the climatic water balance parameter does not take account of leakage from underground utilities, which is more extensive in urban than rural environments. Evaluations of climatic water balance may be improved in the future by incorporating a more detailed recharge estimate, accounting for run-off, natural indirect recharge and urban recharge flows.
There is growing evidence in the field of environmental geochemistry that adopting compositional data analysis (CODA) can be very helpful to elucidate relationships between elements in environmental media. This approach converts concentration data (mg/kg) to a log-ratio to take into account the inherent interactions between elements in a ‘closed system', whereby the sum of all chemical elements must add to 100 % of the total composition in any given sample. For such closed data, the concentration obtained for one part (element) does not vary independently from the others; thus, the information is not absolute, but only relative (e.g., Grunsky Reference Grunsky2010; McKinley et al. Reference McKinley, Hron, Grunsky, Reimann, de Caritat, Filzmoser and Tolosana-Delgado2016). It is recommended that such an approach be tested for the GRASP method in the future, to examine in more detail (a) spatial associations between soil and groundwater chemistry; and (b) the likely influence of soil Fe and Mn sesquioxide content on the concentration and mobility of other metal elements. At present, Fe and Mn sesquioxide content is taken into account using an assessment of soil colour only, in Step 1 of the BS-ISO (2004) methodology, on which GRASP is based.
3. Conclusions
(1) GRASP is a GIS-based screening tool that uses a methodology described by BS-ISO (2004) to assess the potential for metals (Al, Cd, Co, Cr, Cu, Ni, Pb and Zn) leaching from unsaturated soil/superficial material to threaten shallow groundwater quality across Glasgow. GRASP is novel in that it combines a soil leaching potential assessment with measured soil metal concentrations to highlight areas where threats to shallow groundwater quality are most likely. It is not a deterministic tool for measuring absolute levels of groundwater pollution from metals in soil/superficial deposits. Rather, GRASP is a tool to help urban management and planning, including issues such as the siting of SuDS schemes, by prioritising areas of the city where shallow groundwater is likely to be most vulnerable to pollution from contaminants in soil and superficial materials.
(2) The main controls on sites ranked by GRASP as posing the greatest threat of soil metal leaching to shallow groundwater are (i) shallow depths to groundwater, which result in short travel time and attenuation pathways for infiltrating water; and (ii) high soil metal concentration, such that the soil-metal-binding capacity is more likely to be exceeded by current/future pollution.
(3) The output from Step 4d of GRASP is a set of maps, which show the relative threat to shallow groundwater quality from soil leaching for each of the eight metals assessed. For each of the metals, 5 % of soil sample sites are given a very high ranking.
(4) In the final step of GRASP, individual metal ranks are combined into a single priority ranking, representing the overall threat to shallow groundwater quality from soil/superficial material metal leaching. Thirteen percent of the soil sample sites are given a very high ranking, highlighting areas that are likely to be most vulnerable to current and future pollution, and should be prioritised for attention in terms of groundwater protection.
(5) To date, validation of the GRASP method has focussed on development areas in the East End of Glasgow where groundwater chemistry data from existing site investigation reports are available. Results indicate a spatial association between soil sites with high priority rankings and areas of elevated Cr and Cu concentration in groundwater, but not with other metals. This may be, in part, because the BS-ISO (2004) leaching potential method, on which the GRASP tool is based, is derived from observations of Northern European rural soil rather than urban soil. The latter is likely to be very different in structure and composition than typical rural soil. It is recommended that validation tests based on urban soil are applied to aid the development of methods such as the BS-ISO (2004) scheme in the future. Similarly, the BS-ISO (2004) method uses a basic climatic water balance parameter as an indicator of recharge, and this could be improved in the future by more detailed recharge estimations accounting for run-off and direct and indirect urban flows. Furthermore, it is recommended that a CODA approach to element concentration data be tested in the future to help elucidate interactions between the metals in the soil and groundwater and the role of Fe and Mn sesquioxides in metal mobility in particular.
(6) Groundwater chemistry varies considerably over very short distances in this complex Quaternary hydrogeological system and heavily urbanised study area of Glasgow. It may be that the G-BASE soil data, collected on a 500-m sampling grid, on which GRASP is based, are not of a high enough spatial resolution to predict the degree of variability in shallow groundwater chemistry in this post-industrial environment. No groundwater chemistry data for validation are available for other parts of the city to test the method further.
(7) However, this study has highlighted that the different methods of sampling and analysis used in site investigations contributes to the variability in the groundwater chemistry and DTW data for Glasgow. As a result, there can be inconsistencies and bias in information between different boreholes and sites, making it difficult to reuse these data for scientific studies and urban management. A system to standardise the digital collection, transfer and management of subsurface site investigation data is being trialled in Glasgow and expanded to other European cities. In the future, this is likely to improve data availability, quality and comparability to provide better support for understanding groundwater systems, vulnerability assessments such as GRASP and urban management in general.
4. Acknowledgements
Work to develop the GRASP method was supported by the British Geological Survey (BGS) Engineering Geology Science area through the Clyde and Glasgow Urban Super Project (CUSP). The validation studies were carried out jointly with BGS as MSc projects by Martha Lovatt (Strathclyde University) and Rebecca McCuaig (Birmingham University), who are grateful for the MSc project sponsorship provided by the BGS University Funding Initiative. Simon Watson, David Hay and Donald Linn of Glasgow City Council are thanked for their support of the BGS Geochemical Baseline Survey of the Environment (G-BASE) project on which the GRASP method is based, and for the provision of borehole record information for the GRASP study. Thanks also go to the team of BGS G-BASE staff and student volunteers who generated the Glasgow soil dataset, including Sarah Nice, Bob Lister, Cathy and Andreas Scheib, Mark Allen, Mark Ingham and Charlie Gowing. Dr Joanna Wragg and Simon Price, BGS, are thanked for their comments on the paper. This paper is published with the permission of the Executive Director of the BGS, Natural Environment Research Council (NERC). BGS/NERC reference: PRP18/031.