1. INTRODUCTION
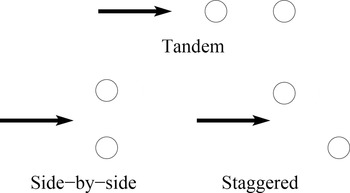
The design of elastic structures in presence of aerodynamic loadings is a complex engineering task of great interest. The highly nonlinear coupling between the structural deformation and the fluid flow makes the dynamical analysis of the system difficult to treat using either theory or computational tools. A key phenomenon relevant to the interaction of elastic structures and fluid flow is called vortex-induced vibrations (VIV). Vortex shedding and vortex-excited oscillations may occur in marine structures such as risers and conductor tubes employed in oil drilling and production, deep-water pipelines, or civil engineering structures such as bridges and chimney stacks. VIV has received considerable attention, and the fluid flow over a single elastically mounted cylinder is considered as the prototype for this kind of configurations and still subject of intense research (Williamson & Govarghan, Reference Williamson and Govarghan2004). In a realistic situation, multiple elastic structures are arranged in proximity that can further alter and enhance the interaction between the more complex fluid pattern and the structural elements. It is common to analyze two elastic structures under the hypothesis of two-dimensional flow and assume a circular shape for both the structural elements. Examples of experimental and numerical studies of this problem exist (see, e.g., Griffin & Ramberg, Reference Griffin and Ramberg1982; Borazjani & Sotiropoulos, Reference Borazjani and Sotiropoulos2009). However, a very limited number of studies consider the design and the analysis of these structures under uncertain conditions (Xiu et al., Reference Xiu, Lucor, Su and Karniadakis2002; Lucor & Triantafyllou, Reference Lucor and Triantafyllou2008). Uncertainty quantification (UQ) is crucial when the effect of geometrical tolerances on the dynamics of the structural elements needs to be taken into account for safety and fatigue considerations. It is well known that a single elastically mounted cylinder, placed in a free stream, undergoes large amplitude oscillations when the shedding frequency synchronizes with the natural oscillation frequency (Williamson & Roshko, Reference Williamson and Roshko1988). Unlike the forced vibration behavior of a linear oscillator, here the vortex shedding synchronization occurs over a range of frequencies, called the lock-in region. The flow regime is more complex than the von Karman vortex street, which appears for fixed bluff bodies, and even more complexity arises when a second cylinder is placed in the wake. Depending on the arrangement, which can be in tandem, staggered, or side by side (see Fig. 1), fixing the relative position of the cylinders it is possible to identify regimes characterized by distinct mechanisms of interaction between the structure and the flow field.
Tandem, side-by-side, and staggered cylinder configurations.

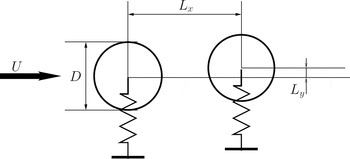
In particular, in this work we are interested in the case of a pair of cylinders, with the same diameter D, placed in tandem (see Fig. 2). For this configuration, in the following, we present the main regimes that have been identified in the literature (e.g., see Zdravkovich & Pridden, Reference Zdravkovich and Pridden1977). A critical regime corresponds to the ratio L x /D > 4. In this situation, only the rear cylinder is affected by the presence of the front wake, whereas if L x /D < 4, the front wake itself is sensible to the presence of the rear cylinder. This latter configuration is the so-called proximity-wake interference region. In the present work, we are interested in this regime, and in particular, our goal is to study the nominal configuration with L x /D = 1.5. Borazjani and Sotiropoulos (Reference Borazjani and Sotiropoulos2009) carried out an extensive numerical analysis for L x /D = 1.5 at Reynolds number = 200, which the authors identified as the upper bound for which the flow remains essentially two dimensional. The authors identify larger amplitudes of motion and a lock-in region for the configuration in tandem with respect to the isolated cylinder and also the existence of a threshold in the reduced velocity that delimits the behavior of the system. More precisely, for reduced velocities below the threshold, the amplitude of the front cylinder's oscillations exceeds that of the rear cylinder's oscillations, whereas above the threshold, the rear cylinder exhibits larger amplitudes of oscillation compared to the front one. Numerical studies, such as the one performed in Borazjani and Sotiropoulos (Reference Borazjani and Sotiropoulos2009), are limited by the assumption that the relative position of the two cylinder is known exactly. In practice, during the designing stage, when a particular configuration for the structure is defined and tolerances must be assigned, it is important to quantify the effect of any uncertainty in the configuration and operative conditions. For instance, even when a particular configuration is chosen to perform safely according to the nominal design requirements, the manufacturing process can introduce uncertainty in the relative positioning of the structural elements. In this work, our goal is to demonstrate how UQ analysis is able to provide useful information to the designer in such a situation. The uncertainty in this kind of problems comes usually from different sources. We selected the case studied in Borazjani and Sotiropoulos, and we consider two sources of uncertainty describing the relative position of the two cylinder (L x and L y as reported in Fig. 2). The work presented in the following is an extended and revised version of Geraci et al. (Reference Geraci, de Tullio and Iaccarino2015) and is organized as follows: in Section 2 the physical problem and the relevant governing equations are introduced. The numerical setting is described in Section 3, where we discuss both the deterministic solver (Section 3.1) and the stochastic approach (Section 3.2). Numerical results follow in Section 4, and conclusions and perspectives close the paper in Section 5.
Schematic representation of the cylinders tandem arrangement and notation used.

2. PROBLEM DESCRIPTION
We consider the system constituted by two cylinders in tandem exposed to a uniform flow, as depicted in Figure 2. The two-dimensional incompressible flow of a viscous Newtonian fluid is considered; two identical rigid cylinders are mounted elastically in the domain such that they are free to vibrate perpendicularly to the flow direction (1 DOF). The flow is governed by the Navier–Stokes equations
 $$\eqalign{\nabla \cdot {\bi u} & = 0 \comma \cr \displaystyle{\partial {\bi u} \over \partial t} + \lpar {\bi u} \cdot \; \nabla \rpar {\bi u} &= - \displaystyle{1 \over {\rm \rho}} \nabla p + \displaystyle{1 \over Re} \nabla^2 {\bi u}\comma} $$
where u = (u, v) T is the velocity field, p is the pressure, ρ is the fluid density, and t is the time. The Reynolds number (Re) is defined as
 $$Re = \displaystyle{{{\rm \rho} U D} \over {\rm \mu}}\comma $$
where D is the cylinder diameter, U is the undisturbed upstream velocity, and μ is the dynamic viscosity of the fluid. The no-slip condition is imposed on the cylinders’ surfaces Γ i as
 $${\bi u}\lpar {{\bi x}\comma \,t} \rpar = \displaystyle{{d\; {\bi X}_{\bi i}^{{\bf cg}}} \over {dt}}\comma \quad \hbox{for}\; {\bi x\;} \in \; {\bf \Gamma} _{\bi i} \lpar {\bi t} \rpar {\rm\comma } $$
where x = (x, y) T denotes the spatial coordinate, and X i cg is the location of the center of gravity of the ith cylinder. The motion of the generic ith cylinder is described by Newton's second law
 $$m\displaystyle{{d^2 {\bi X}_{\bi i}^{{\bf cg}}} \over {dt^2}} + k\lpar {{\bi X}_{\bi i}^{{\bf cg}} - {\bi X}_{\bi i}^0} \rpar = F_i \lpar t \rpar \comma $$
where m is the mass, which is equal for both cylinders, X i 0 is the spring neutral position, k is the spring stiffness (identical for the two cylinders), and F i is the force exerted by the fluid. This contribution comes from the integration of the viscous and pressure distributions over Γ i , as a function of time. A more realistic model should also include the structural damping, but because we are interested in the most critical condition, that is, the one that exhibits the most intense vibrations, neglecting the damping is considered to be a reasonable idealization. By introducing the natural frequency f as
 $$f = \displaystyle{1 \over {2{\rm \pi}}} \sqrt {\displaystyle{k \over m}\;}\comma $$
we are able to define a nondimensional parameter, namely, the reduced velocity:
 $$U_{{\rm red}} = \displaystyle{U \over {\,f\hskip-1ptD}}.$$
In this work we consider the two cylinders to be identical, that is, same constitutive material and same diameter D. Therefore, one single reduced velocity U red is enough to represent the operating conditions of the system. The goal of the present study is to analyze the response of the system for a set of reduced velocities ranging from 4 to 8 (this range is the same as the one used in Borazjani and Sotiropoulos, Reference Borazjani and Sotiropoulos2009). For the entire envelope of reduced velocities, we are interested in quantifying the effect of a nonexact knowledge of the relative locations of the two neutral positions. More precisely, we consider as a nominal condition the one studied in Borazjani and Sotiropoulos (Reference Borazjani and Sotiropoulos2009), in which the horizontal distance L x between the centers of the cylinder is L x /D = 1.5, and we model it as a uniformly distributed random variable. We use a variation of ±4% around the nominal value, which leads to L x /D ~ U(1.44, 1.56). The vertical distance between the two resting cylinders’ centers is also modeled as a uniform random variable, and it is set to L y /D ~ U(−0.05053, +0.05053), where L y /D = 0 corresponds to the configuration with perfect alignment between the cylinders. These uncertainties are representative of geometrical tolerances in the assessment of riser interference (Det Norske Veritas, 2009).
3. NUMERICAL SETTING
The overall numerical procedure consists of a set of deterministic computational fluid dynamics (CFD) simulations followed by a UQ step that enables the determination of the variability due to the geometrical tolerances considered.
3.1. Deterministic CFD simulations
The governing equations are discretized in space using second-order-accurate central differences on a Cartesian staggered grid. The time discretization uses an explicit Adams–Bashforth scheme for the nonlinear terms and an implicit Crank–Nicolson scheme for the viscous ones,
 $$\eqalign{\displaystyle{{{\bi \overline {u}} - {\bi u}^{\bi n}} \over {{\bf \Delta} t}} &= - {\rm \alpha} \nabla p^n + {\rm \gamma} H^n \cr &\quad + {\rm \rho} H^{n-1} +\displaystyle{{\rm \alpha} \over {2\,Re}}\nabla ^2 \lpar {{\bi \overline {u}} + {\bi u}^{\bi n} } \rpar \comma} $$
where un denotes the velocity at the old time n; ū is the intermediate solution; Δt is the time step; H contains the nonlinear terms; and α, γ, and ρ are the constants of the Adams–Bashforth/Crank–Nicolson scheme (Verzicco & Orlandi, Reference Verzicco and Orlandi1996). The resulting system is solved using a fractional-step method to obtain the intermediate nonsolenoidal velocity field ū. To get a divergence-free velocity field, a scalar quantity φ is introduced such that
 $$u^{n + 1} = \overline{u} - {\rm \alpha} \; {\rm \Delta} t\; \nabla {\rm \varphi} {\rm.} $$
By applying the discrete divergence operator to the equation above, an elliptic equation for φ is obtained and the large-banded matrix, associated with the elliptic equation, is reduced to a pentadiagonal matrix using trigonometric expansions in the spanwise direction. The resulting Helmholtz equations are inverted using the FISHPACK package (Swartzrauber, Reference Swartzrauber1974). Finally, the pressure field is computed as
 $$p^{n + 1} = p^n + {\rm \varphi} - \displaystyle{{{\rm \alpha} \; {\rm \Delta} t} \over {2 Re}}\; \nabla ^2 {\rm \varphi} . $$
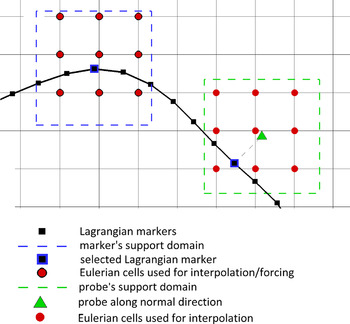
To account for the presence of the moving bodies inside the domain, a direct forcing immersed boundary (IB) technique (Mittal & Iaccarino, Reference Mittal and Iaccarino2005) is employed, based on a versatile moving least squares (MLS) reconstruction (Vanella & Balaras, Reference Vanella and Balaras2009). On the basis of the alternative direct-forcing scheme suggested by Uhlmann (Reference Uhlmann2005), the forcing is computed on the Lagrangian markers laying on the immersed surface, in order to satisfy the boundary condition, and then transferred to the Eulerian grid points. The MLS approximation is the key ingredient for building a transfer function between the Eulerian and Lagrangian grids that can also provide a smooth solution in the presence of arbitrarily moving/deforming bodies. The procedure consists of the following steps (see also Fig. 3):
-
1. Compute the intermediate velocity ū from Eq. (7) in all the ne Eulerian grid points surrounding a marker in its support domain. Here, the support domain is centered on the marker and extends over ±1.6Δx i , where Δx i is the local grid size in the ith direction. In this way, nine points are considered in two dimensions.
-
2. Compute the velocity at each marker point, l, corresponding to the nonsolenoidal velocity field according to
(10)where ψ is the transfer operator containing the shape functions and obtained minimizing with respect to a(x) the weighted L 2-norm defined as $$\overline{U}_l \lpar x \rpar = \sum_{k = 1}^{ne} \ {\rm \psi}_k^l \lpar x \rpar \overline{{u}_k}\comma $$
(11)In the above equation, pT (x) = [1, x, y, z] is the basis function vector, a(x) is a vector of coefficients, x is the marker position, and W(x − x k ) is a given weight function. In this work, the exponential function (Liu & Gu, Reference Liu and Gu2005) is used, written as W(x − x k ) = e −(r k /α)2 for r k ≤ 1, or 0 for r k > 1. Here α = 0.3 and r k is given by
$$\; J = \mathop \sum \limits_{k = 1}^{ne} \ W\lpar {x - x^k} \rpar [\; p^T \lpar {x^k} \rpar a\lpar x \rpar - \overline {u_k} \; ]^2. \; $$
(12)with r w the size of the support domain previously defined.
$$r_k = \displaystyle{{\vert {\; x - x_k \;} \vert } \over {r_w}} \comma $$
-
3. Calculate the volume force F at all markers, in order to get the desired velocity
$U_l^{\rm b} $
at the boundary as
(13)
$$F_l = \displaystyle{{U_l^{\rm b} - \overline {U_l}} \over {{\rm \Delta} t}}.$$
-
4. Transfer back F l to the k Eulerian grid points associated with each marker, using the same shape functions used in the interpolation procedure, properly scaled by a factor c l , which is determined by imposing that the total force acting on the fluid is not changed by the transfer
(14)where nl indicates the number of markers associated with the Eulerian point k. One can also verify that the above scheme guarantees the equivalence of total torque between the Eulerian and Lagrangian computational grids (Vanella & Balaras, Reference Vanella and Balaras2009).
$$f^{k} = \mathop \sum \limits_{l = 1}^{nl} \; c_l {\rm \psi} _k^l F_l\comma $$
-
5. Correct the intermediate velocity by means of the forcing, so as to satisfy the boundary conditions at the immersed body
(15)This velocity field is not divergence free and is projected into a divergence-free space by applying the pressure correction that satisfies the Poisson equation.
$$u^{\ast} = \overline{u} + {\rm \Delta} tf.$$


Sketch of the Lagrangian markers identification for the moving least squares technique.

The hydrodynamic forces and moments acting on the immersed body are calculated in time by integrating the pressure and viscous stresses over the immersed body surface. In two dimensions, given the surface discretization by nl linear elements, one has
 $$F\lpar t \rpar = \mathop \sum \limits_{l = 1}^{nl} \ \lpar {{\rm \tau}_l \cdot n_l - p_l n_l} \rpar S_l \; \; $$
and
 $$M\lpar t \rpar = \mathop \sum \limits_{l = 1}^{nl} \; \lsqb {r_l \times \lpar {{\rm \tau}_{\rm l} \cdot n_l - p_l n_l} \rpar } \rsqb S_l\comma $$
where nl is the number of markers; τ l and pl are viscous stress tensor and pressure, evaluated at the centroid of each element (location of the Lagrangian marker, l); r l is the distance of the marker from the centroid of the body; and n l and S l are the normal unit vector and length of each element.
To evaluate the pressure p l and the velocity derivatives needed for the viscous stress tensor, for each marker a probe is created along its normal direction, at a distance h l , equal to the averaged local grid size. Using the same MLS formulation described above, the pressure and velocity are evaluated on the probe location. Then, the pressure on the markers is calculated as
 $$p_l = p_{l}^{\ast}+ \displaystyle{{Du_l} \over {Dt}} \cdot n_l\comma $$
where
 $p_{l}^{\ast} $
is the pressure on the probe and the second term of the right hand side, involving the acceleration of the marker, Du
l
/Dt = dU
l
/dt, comes from the evaluation of the pressure gradient in the normal direction by the momentum equation (Yang & Balaras, Reference Yang and Balaras2006). Concerning the velocity derivative on the body surface, these are considered equal to the velocity derivatives evaluated at the probes, that is, equivalent to assume a linear variation of the velocity near the body. This is consistent with the second-order accuracy of the space discretization scheme and turns out to be a good approximation provided that the grid is sufficiently refined near the body.
Because the prediction of the flow field and of the hydrodynamic loads requires the knowledge of the motion of the bodies and vice versa, a fluid–structure interaction (FSI) approach is employed. The evaluation of the flow and particle motion is carried out by a strongly coupled FSI scheme, in order to avoid instabilities related to strong accelerations of the bodies. An iterative fourth order predictor–corrector method is adopted, based on Hamming's (Reference Hammings1959) method with mop-up correction, as reported in (deTullio et al., Reference de Tullio, Cristallo, Balaras and Verzicco2009): for each time step, the convergence of the iterative procedure is verified by the condition
 $\vert {U_p^j - U_p^{\,j - 1}} \vert \lt {\rm \varepsilon} $
, where
 $U_p^j $
indicates the body velocity at iteration j. In all our computations, a tolerance of ε < 10−6 was used, and the number of iterations required for convergence at each time step varied from 1 to 6, depending on the flow configuration. To avoid numerical instabilities in the FSI algorithm induced by the added mass effect, an underrelaxation of the forces (and moments) is employed, according to F = γF
j
+ (1 − γ)F
j−1 with γ = 0.9.
The computational domain considered is [−8D, 24D] × [−8D, 8D], and the flow comes in the horizontal direction from left to right. The tandem arrangement considered has L x /D = 1.5, so that the front cylinder's center is placed in (0, 0) and the rear one in (1.5, 0). A nonuniform grid of 379 × 454 nodes is used, with a uniform grid spacing of 0.02D in the vicinity of the cylinder. The Lagrangian markers are distributed uniformly on the surface of the cylinder, with a spacing of 0.014D, that is equal to 0.7 for the local Eulerian grid size in that area. A constant time step used is Δt = 0.002D/U, with CFL = 0.4. Inlet and outlet boundary conditions are imposed on the vertical boundaries, whereas free-shear wall conditions are imposed for the horizontal boundaries. An extensive verification of the IBM code is reported in de Tullio et al. (Reference de Tullio, Pascazio and Napolitano2012) and de Tullio and Pascazio (Reference de Tullio and Pascazio2016).
3.2. Uncertainty propagation strategy
The UQ phase is performed by means of a nonintrusive polynomial chaos (PC) propagation (see, e.g., Creastaux et al., Reference Creastaux, Le Maître and Martinez2009). We present here the treatment of a generic quantity of interest (QoI) f = f(ξ) ∈ R, where ξ indicates the vector of random parameter. In the present case, two uncertainties are considered, and therefore
 ${\rm \xi} \in {\rm \Xi} \subset R^2 $
. For a physical QoI, the variance is expected to be finite; hence, we assume
 $f \in L^2 \lpar {\rm \Xi} \rpar $
, which enables us to write a truncated series of polynomial following the seminal work of Wiener (Reference Wiener1938):
 $$f\lpar {\rm \xi} \rpar \approx \sum_{k = 0}^P \; {\rm \beta}_k {\rm \psi}_k \lpar {\rm \xi} \rpar .$$
Stochastic spectral expansion as Eq. (19) can be seen as a particular form of response surface methods where the mapping f(ξ) is sought in terms of a basis of orthogonal random functionals {Ψ k (ξ)}. Following the approach described in Xiu and Karniadakis (Reference Xiu and Karniadakis2002), a generalized PC expansion is obtained selecting an orthogonal basis with respect to the probability measure p(ξ) defined as the joint probability density function of the (independent) random parameters ξ i ∈ ξ
 $$p\lpar {\rm \xi} \rpar = \mathop \prod \limits_{i = 1}^2 \; p\lpar {{\rm \xi}_i} \rpar .$$
In this work, without any loss of generality, we assume p(ξ i ) to be the uniform distribution such that the multidimensional generalized (orthogonal) polynomial basis is obtained by tensorization of one-dimensional Legendre polynomials. The model approximation f(ξ), as described in Eq. (19), requires the P + 1 coefficients {β k }. The number of terms P in Eq. (19) is a function of the polynomial degree n chosen for the approximation and the dimension of the stochastic space Ξ, which in the present application is
 $$P + 1 = \displaystyle{{\lpar {n + 2} \rpar !} \over {2n!}} = \displaystyle{{\lpar {n + 2} \rpar \lpar {n + 1} \rpar } \over 2}.$$
It is possible, by means of a Galerkin projection, to exploit the orthogonality of the basis in the computation of the coefficients
 $$\eqalign{{\rm \beta}_k &= \displaystyle{{\int \nolimits_{\rm \Xi} f\lpar {\rm \xi}\rpar\; {\rm \psi }_k\left({\rm \xi}\right)\; p\left( {\rm \xi } \right)\; d{\rm \xi }} \over {\int\nolimits_{\rm \Xi}{\rm \psi}_k^2 \left( {\rm \xi } \right) p\left( {\rm \xi } \right)\; d\xi}} \cr & = \displaystyle {{\langle f\left( {\rm \xi } \right),\; {\rm \psi }_k\left( {\rm \xi } \right)\rangle} \over {\langle {\rm \psi }_k\left( {\rm \xi } \right),\; {\rm \psi }_k\left( {\rm \xi } \right)\rangle}}\comma} $$
where the operator 〈·〉 denotes the inner product for the Hilbert space L
2(Ξ). The problem of the determination of the P + 1 coefficients β
k
, in the form of Eq. (22), requires to evaluate numerically integrals of the kind
 $\int_\Xi \; f\lpar {\rm \xi} \rpar \; {\rm \psi} _k \lpar {\rm \xi} \rpar \; p\lpar {\rm \xi} \rpar \; d{\rm \xi}$
, whereas the internal product between the basis’ elements is known analytically. When dealing with polynomial functions, the use of Gauss quadrature rules, thanks to their high order of accuracy, is the preferable choice. For instance, a Gauss Legendre quadrature with N
quad points of quadrature is exact for polynomial order n < 2N
quad. In our case, there is no guarantee that the QoI sought are polynomial, and therefore, we decided to employ a Clenashaw–Curtis (CC) quadrature rule, which despite its lower exactness (n < N
quad) when compared to Gauss type of quadrature, has the very interesting feature to be nested; that is, the set of quadrature points can be augmented reusing all the previous functional evaluations. Because, in our UQ step, each quadrature point corresponds to a single realization of the FSI, we are able to increment the accuracy of our polynomial expansion always reusing the previous realizations. We performed a convergence study, although not entirely reported here for brevity. After the convergence study, we found that 9 CC points (N = 81) in each stochastic direction were enough to guarantee a satisfactory accuracy, as shown in the next section. Because the problem is symmetric with respect to the neutral transversal distance L
y
between the two cylinders, we performed only N
sim = (n
1D + 1) × n
1D numerical simulations, where n
1D is the number of one-dimensional CC points. All the integrals are evaluated using the CC rule, such that
 $$\langle f\lpar {\rm \xi} \rpar \comma\ {\rm \psi} _k \lpar {\rm \xi} \rpar \rangle \approx \mathop \sum \limits_{i = 1}^{N_{{\rm sim}}} \; f\lpar {{\rm \xi}^{\lpar i \rpar }} \rpar {\rm \psi} _k \lpar {{\rm \xi}^{\lpar i \rpar }} \rpar p\lpar {{\rm \xi}^{\lpar i \rpar }} \rpar w_i\comma $$
where w i is the quadrature weights obtained by tensorization of the one-dimensional CC quadrature weights. We consider in this study three distinct QoIs, namely, the maximum displacement of the front (y Fr/D)max and rear (y Rear /D)max cylinder and the maximum vertical separation (Δ/D)max that occurs during the entire time history between the two cylinders. One of the goals of the UQ analysis is to compute relevant statistics for the QoI. In common practice, the expected value E[f(ξ)] or the variance Var(f(ξ)) of the QoI contain enough information to characterize a QoI from a probabilistic point of view. Either E[f(ξ)] and Var(f(ξ)) can be easily evaluated once the coefficients β k are available
 $$\eqalign{E\left[ {\,f\left( {\rm \xi } \right)} \right] &= \mathop \int \limits_{\rm \Xi }^{\rm \; } {\rm \; }f\left( {\rm \xi } \right) p\left( {\rm \xi } \right)\; d{\rm \xi }\; \approx {\rm \beta }_0\comma \cr Var\left( {\,f\left( {\rm \xi } \right)} \right)&= \mathop \int \limits_{\rm \Xi }^{\rm \; } {\rm \; }(\,f\left( {\rm \xi } \right) - E\left[ {\,f\left( {\rm \xi } \right)} \right])^2 p\left( {\rm \xi } \right)\; d{\rm \xi }\comma \cr & \approx \sum \limits_{k = 1}^P \; {\rm \beta }_k^2 \langle{\rm \psi}_k^2 \left({\rm \xi } \right)\rangle.} $$
One of the goals of this study is the comparison of the nominal condition with the stochastic solution obtained when one source of uncertainty is in the cylinders’ position. The quantification of the exceedance probability, that is, evaluating the probability that a certain QoI may assume a value higher than a prescribed threshold, requires the knowledge of the probability density function (PDF). Building the PDF is in general a much more complicated task than evaluating the moments because it cannot be expressed in closed form. We use the PC expansion as a surrogate model to compute the PDF. First, we generate a lattice, constituted by equally distributed points in the two stochastic directions, over the space Ξ; we found 1500 points per direction to be a reasonably high number of model evaluations. Second, as all the functional evaluations are obtained through the PC expansion, the PDF is built by dividing the range of the PC expansion f(ξ) in a number of equally spaced intervals and by counting their occurrence.
Another goal of this work is to show how UQ can provide guidance to a practitioner while designing an elastic structure subject to fluid forcing where multiple parameters are random variables. Insights can be obtained analyzing the influence of each specific random parameter over the QoI. These families of techniques are commonly referred to as global sensitivity analysis techniques. One prominent class among them is analysis of variance (ANOVA; Sobol, Reference Sobol2001). Obtaining the ANOVA decomposition is possible, raising to the second power the PC expansion, Eq. (19), and identifying all the contributions belonging to a specific set of variables. For the case considered in the present work, three different contributions are possible, namely, the conditional variance with respect to the first random parameter ξ1, the second one ξ2, and the mixed contribution
 $$f\lpar {\rm \xi} \rpar = f_1 \lpar {{\rm \xi}_1} \rpar + f_2 \lpar {{\rm \xi}_2} \rpar + f_{12} \lpar {{\rm \xi}_1\comma \,{\rm \xi}_2} \rpar .$$
The evaluation of these terms is possible once the PC expansion, that is, the set of coefficients {β k }, is obtained
 $$\eqalign{\,f_1 \lpar {{\rm \xi}_1} \rpar &= \mathop \sum \limits_{k = 1}^P \; {\rm \beta} _k^2 {\rm \psi} _k^2 \lpar {\rm \xi} \rpar \; {\rm \delta} _k \lpar {{\rm \xi}_1} \rpar \comma \cr f_2 \lpar {{\rm \xi}_2} \rpar &= \mathop \sum \limits_{k = 1}^P \; {\rm \beta} _k^2 {\rm \psi} _k^2 \lpar {\rm \xi} \rpar \; {\rm \delta} _k \lpar {{\rm \xi}_2} \rpar \comma \cr f_{12} \lpar {{\rm \xi}_1\comma\, {\rm \xi}_2} \rpar &= \mathop \sum \limits_{k = 1}^P \; {\rm \beta} _k^2 {\rm \psi} _k^2 \lpar {\rm \xi} \rpar \; {\rm \delta} _k \lpar {{\rm \xi}_1\comma\, {\rm \xi}_2} \rpar \comma}$$
where the selection function δ k takes the value 1 only if its argument corresponds to the set of stochastic directions used for the tensorization of Ψ k . Please refer to Geraci et al. (Reference Geraci, Congedo, Abgrall and Iaccarino2016) for a more exhaustive and general treatment of the statistics decomposition and its computation from PC expansions.
4. NUMERICAL RESULTS
The main goal of the present analysis is to characterize, in a probabilistic sense, the QoI defined above. For instance, the analysis can provide the probability of exceeding a prescribed threshold or the definition of confidence intervals. All these tasks involve the evaluation of PDFs, which in turn requires an assessment of the PC expansion accuracy [see Eq. (19)]. The PC expansion serves as a cheap surrogate of the original models, and we refer to this continuous approximation as a metamodel of the QoI. For each QoI, the optimal polynomial order n is identified by means of a convergence study. We considered total polynomial orders n ranging from 4 to 8, and we evaluated the L 1, L 2, and L ∞ norms according to the following definitions
 $$\eqalign{{\rm err}_{L^1} &= \displaystyle{{\sum \nolimits_{i = 1}^N \!\vert {\; f\lpar {{\rm \xi}^{\lpar i \rpar }} \rpar - f_{{\rm true}} \lpar {{\rm \xi}^{\lpar i \rpar }} \rpar \;} \vert \; p\lpar {{\rm \xi}^{\lpar i \rpar }} \rpar \; w_i} \over {\sum \nolimits_{i = 1}^N \! \vert {\; f_{{\rm true}} \lpar {{\rm \xi}^{\lpar i \rpar }} \rpar \;} \vert \; p\lpar {{\rm \xi}^{\lpar i \rpar }} \rpar \; w_i}}\comma \cr {\rm err}_{L^2} &= \left({\displaystyle{{\sum \nolimits_{i = 1}^N \! \lpar {\,f\lpar {{\rm \xi}^{\lpar i \rpar }} \rpar - f_{{\rm true}} \lpar {{\rm \xi}^{\lpar i \rpar }} \rpar } \rpar^2 p\lpar {{\rm \xi}^{\lpar i \rpar }} \rpar w_i} \over {\sum \nolimits_{i = 1}^N \; f_{{\rm true}}^2 \lpar {{\rm \xi}^{\lpar i \rpar }} \rpar p\lpar {{\rm \xi}^{\lpar i \rpar }} \rpar w_i}}} \right)^{\!\!\!1 /2}\comma \cr {\rm err}_{L^\infty} &= {\rm max}_i \left \vert {\; \displaystyle{{\lpar {\; f\lpar {{\rm \xi}^{\lpar i \rpar }} \rpar - f_{t{\rm rue}} \lpar {{\rm \xi}^{\lpar i \rpar }} \rpar } \rpar } \over {\,f_{{\rm true}} \lpar {{\rm \xi}^{\lpar i \rpar }} \rpar}}} \ \right \vert \;\comma} $$
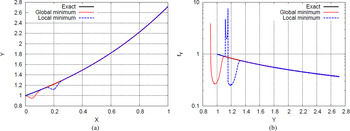
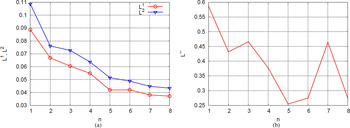
where f true denotes the values obtained directly from the numerical simulations, whereas f is obtained from Eq. (19). Making use of the CC quadrature rule, with 9 points per direction in our case, enables us to integrate exactly polynomial functions of order 8. Therefore, in principle, the maximum spectral content we can integrate is 4, that is, fourth order for each term in the inner product 〈f, Ψ k 〉. In practice, because the model function f is not polynomial, the optimal order of the expansion is not known a priori. Moreover, if n is too high, it can lead to undesired under- or overshootings due to the poor accuracy on the evaluation of the high-order spectral terms. Both the under- and overshootings, as numerical artifacts, can significantly deteriorate the quality of the PC expansion, hence the PDF for the QoI. If these numerical oscillations correspond to a local minimum/maximum, they introduce fictitious peaks in the PDF, whereas if they are a global minimum/maximum, their presence results in a shift of the bounds of the range of the function f. This latter case might have a strong effect on the analysis because it introduces outcomes of the function that are not allowed by the system. The quantification of the margin of probability would result biased by these fictitious outcomes. For instance, in Figure 4 an example of the modification of the PDF in the presence of local/global minima is reported for the function Y = exp(X) with X ~ U(0, 1). The PDF is known analytically as f Y = 1/Y over the support Y ∈ [1, e]. The global and local minima are introduced by subtracting a Gaussian function defined as 0.1 exp(−1000(X − X )2), where X takes the value 0.05 or 0.2 for the global or local minimum, respectively, to the original function Y = exp(X). We consider this point to be very important for the design methodology we propose in this work, and therefore, the information conveyed by the L 1 and L 2 norms are compared with the ones obtained through the evaluation of the L ∞ norm. More precisely, even if the L 1 and L 2 norms are monotonically decreasing with n, we choose the maximum total order for which a decreasing L∞ error is still obtained. This choice guarantees the smoothest response of the PC expansion. The results of this convergence study are not entirely reported here for brevity, but in Figure 5, a representative situation, for the front cylinder oscillation as QoI and a reduced velocity equal to 4, is represented. In Figure 5a both, the L 1 and L 2 norms are monotonically decreasing with n, whereas the L ∞ , reported in Figure 5b, shows a less regular behavior. In this case, the optimal polynomial order we selected is n = 5. We point out here that this convergence study does not require us to modify the set of simulations to run. In all the cases with n varying, the number of deterministic simulations is N sim = 81, and the optimal polynomial order is obtained a posteriori. Moreover, the number of terms involved in the PC expansion [Eq. (19)], can be related to the total polynomial order (the stochastic dimension is fixed in this analysis). From Eq. (21), it is possible to determine the number of terms to add while increasing the total polynomial order. If we consider the number of terms P a function of the total order n, so that P = P(n) = P n , it is possible to write
 $${\rm \Delta} P_n = P_{n + 1} - P_n = \displaystyle{{\lpar {n + 2} \rpar !} \over {2n!}}\left( {\displaystyle{{n + 3} \over {n + 1}} - 1} \right) = n + 2.$$
The term ΔP n quantifies the number of integrals to compute in addition to the ones evaluated for n to get a PC expansion of order n + 1.
Example of the probability density function modifications in the presence of a global or local extrema. (a) The exact function, Y = exp(X), where X ~ U(0, 1), and the ones containing the minima and (b) the exact probability density function, f Y = 1/Y with Y ∈ [1, e], and its modified counterparts.

Maximum displacement for the front cylinder at U red = 4. (a) The L 1 and L 2 norms and (b) the L 1 norm are computed according to Eq. (27).

4.1. Front cylinder (y Fr/D)max
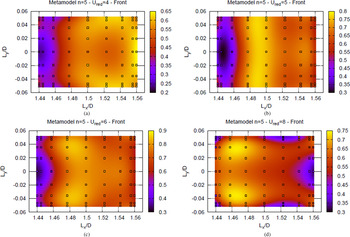
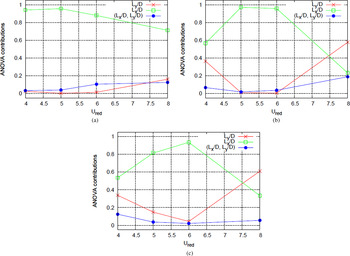
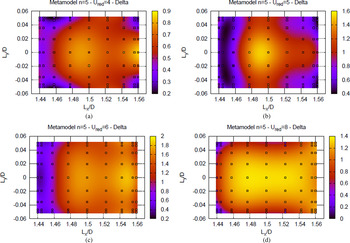
The contours for the surrogate model, that is, the PC expansion Eq. (19) corresponding to a total degree n = 5, are reported in Figure 6 for the maximum displacement of the front cylinder (y Fr/D)max. In Figure 6 the reduced velocities U red = 4, 5, 6, and 8 are considered, and the values obtained directly from the CFD fluid–structural IB solver are also reported for comparison by using a colormap. Therefore, the similarity between the symbols’ color and the background reflects the coherence between the simulations and the PC expansion, which, by construction, is not required to pass through the CFD values. We use the surrogate function to study the behavior of the system in the presence of the uncertainty in the position of the rear cylinder. The first information available when analyzing the contour plots in Figure 6 is that the region very close to the front cylinder, around L x /D = 1.44, is the region where the maximum displacement of the front cylinder is lower with respect to all the other horizontal distances. This behavior occurs up to a reduced velocity lower or equal to 6. For the reduced velocity U red = 8, the minimum of the displacement or the front cylinder moves on the extreme horizontal distance L x /D = 1.56. The behavior described above is very informative from a designer's standpoint. It reveals that if the flow moves at a low reduced velocity, the loadings acting on the frontal part of the structure can be minimized, placing the structural elements very close by each other. Moreover, for the reduced velocities lower than 6, the vertical separation between the structural elements plays a secondary role because the contours appear to be almost one dimensional with respect to the longitudinal separation L x /D. Therefore, to minimize the structural loadings on the front element, it is important for the designer to control more accurately the longitudinal positioning of the elements, whereas the system is more tolerant with respect to the uncertainty in the vertical separation L y /D. This becomes important when the reduced velocity is equal to U red = 8. In this case, the vertical displacement of the front cylinder shows local minima at the farther locations in the vertical direction and close to L x /D ≈ 1.52, while local maxima occur for L x /D ≈ 1.47 and L y /D ≈ ±0.03. Figure 7a shows the ANOVA for the front cylinder displacement. The role played by the longitudinal distance between the structural elements is confirmed, and more important, it can be quantified. The ANOVA reveals that the role of the vertical separation between the cylinders starts to dominate as the reduced velocity exceeds U red = 6. For U red = 6, the relative importance of the vertical separation accounts for almost 20%, and the interaction term, namely, the mixed ANOVA contribution (L x /D, L y /D), becomes more important, and it attains a value roughly equal to L y /D. From a physical point of view, the results obtained through the ANOVA are in very good agreement with the interpretations of the interaction mechanisms reported in Borazjani and Sotiropoulos (Reference Borazjani and Sotiropoulos2009). The authors, for the reduced velocity U red = 8, identify in the gap flow (i.e., a flow with velocities as high as the freestream velocity U) the main phenomenon driving the entire flow–structure dynamics. Therefore, it is reasonable to suppose that placing the rear cylinder in a position with L y /D ≠ 0 would affect the gap flow having strong consequences on the generation of the loadings.
Front cylinder maximum displacement (y Fr/D)max. Four reduced velocities are reported: (a) U red = 4, (b) U red = 5, (c) U red = 6, and (d) U red = 8. The realizations obtained from the numerical simulations are also reported for comparison as symbols filled according to the color map. All the metamodels are obtained by using a total polynomial order n = 5.

Analysis of variance decomposition for the maximum displacement of the (a) front (y Fr/D)max, (b) rear cylinder (y Fr/D)max, and (c) maximum vertical separation (Δ/D)max as a function of the reduced velocity U red.

4.2. Rear cylinder (y Rear/D)max
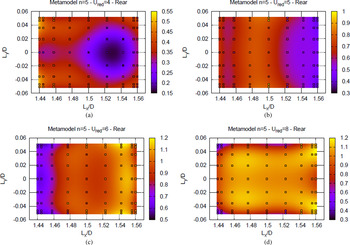
The contours obtained from the PC expansion of the maximum displacement for the rear cylinder (y Rear/D)max are reported in Figure 8 for all the reduced velocities and reveal a much more complex behavior with respect to the front cylinder. For the rear cylinder, the contours are nearly one dimensional with respect to L x /D for the intermediate reduced velocities, U red = 5 and 6, whereas at the lowest and higher reduced velocities, the vertical separation between the two cylinder becomes more relevant. The ANOVA, reported in Figure 7b, confirms the observations made above and, in addition, reveals that the separation L y /D becomes the predominant source of uncertainty when considering the highest reduced velocity. This information is important for the designer because it identifies the vertical separation of the cylinder as a significant parameter for the structure if the reduced velocity is low. For U red = 4, a low loading can be attained for the front cylinder, when the longitudinal distance between the cylinders is short, and the system is more tolerant, that is, less variable, with respect to the uncertainty in the vertical separation L y /D. However, in this configuration, the loadings on the rear cylinder are not independent from the vertical separation that makes the system more prone to the failure if it is designed with respect to the nominal loadings. On the contrary, if the longitudinal separation is nearly equal to 1.44, but the reduced velocity is equal to 6, then the loadings are minimized for both the front and rear cylinder and the system can be expected to be almost insensible to the uncertainty on the vertical separation L y /D. This point of design can be considered as an optimal choice for robustness.
Rear cylinder maximum displacement (y Rear/D)max. Four reduced velocities are reported: (a) U red = 4, (b) U red = 5, (c) U red = 6, and (d) U red = 8. The realizations obtained from the numerical simulations are also reported for comparison as symbols filled according to the color map. All the metamodels are obtained by using a total polynomial order n = 5.

4.3. Maximum vertical separation (Δ/D)max
The previous analyses can be corroborated by considering the maximum vertical separation attained by the two cylinders during the full motion. This QoI, namely, (Δ/D)max, provides complementary information with respect to the analysis of the maximum vertical displacements (y Fr /D)max and (y Rear/D)max separately. The maximum, (Δ/D)max, is evaluated as a function of the entire time history, whereas the maximum displacements for the front and rear cylinder are considered independently, that is, they might occur at different instants. The PC expansion with a total order n = 5 is reported for (Δ/D)max in Figure 9. The global behavior of this QoI is more complex with respect to the previous ones because it shows stronger dependence on both the uncertain parameters with respect to both (y Fr/D)max and (y Rear/D)max. In particular, the only reduced velocity for which the system can be considered robust with respect to the uncertainty in the vertical separation L y /D is U red = 6. This result confirms the finding that a configuration of the structure with a nominal condition with a short longitudinal separation, L x /D = 1.44, at a reduced velocity U red = 6 allows to minimize the loadings on the structural elements. Moreover, the system in this configuration is nearly insensible to the uncertain in the vertical separation L y /D, which might potentially guarantee a more robust design. For instance, a possible choice could be to make the structure more rigid in the longitudinal direction by adding a stiffener between the two structural elements to better control their longitudinal distance L x /D over the time. The ANOVA, reported in Figure 7c, confirms the analysis reported above and quantifies the dependence of (Δ/D)max, with respect to the longitudinal distance L x /D, as higher than 90% at the reduced velocity U red = 6. The ANOVA also reveals that for the highest reduced velocity, the importance of the two random parameter is inverted, as already seen for (y Rear/D)max, but in this case both parameters are very influent, namely, 60% and 40% for L y /D and L x /D, respectively. The designer should be aware that if the structure is designed to work at a reduced velocity close to 8, then the uncertainty in both L x /D and L y /D needs to be accurately controlled and reduced, if it is possible during the manufacturing process, to avoid any performance reduction.
Maximum separation (/D)max between the two cylinders. Four reduced velocities are reported: (a) U red = 4, (b) U red = 5, (c) U red = 6, and (d) U red = 8. The realizations obtained from the numerical simulations are also reported for comparison as symbols filled according to the color map. All the metamodels are obtained by using a total polynomial order n = 5.

4.4. Front and rear cylinder envelope
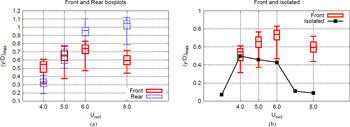
One of the main findings in Borazjani and Sotiropoulos (Reference Borazjani and Sotiropoulos2009) is that for low reduced velocities, namely, U red < 5, the amplitudes of vibration of the front cylinder are larger than the ones of the rear cylinder; the opposite is true for larger reduced velocities. The PC expansion can be sampled to obtain a PDF for both the maximum vertical displacement of the front and rear cylinders. This in turn can be used to compute the probability levels of 25%, 50%, and 75% and the limits of a confidence interval, corresponding to 90% of probability, defined between 5% and 95%. We use these levels to define box plots and the whisker bars for both the maximum displacements (y Fr/D)max and (y Rear/D)max. The probability levels, obtained using a lattice of 1500 equally spaced points per direction, are represented in Figure 10a. For the lowest reduced velocity U red < 5, the probability is higher of having larger oscillations for the front cylinder with respect to those of the rear cylinder, as reported in Borazjani and Sotiropoulos (Reference Borazjani and Sotiropoulos2009) for the nominal condition. In addition, the UQ propagation enables us to quantify that a probability higher that 50% exists for the maximum oscillations of the rear cylinder to fall in the interval 5%–25% of probability for the QoI (y Fr/D)max. For the reduced velocity U red = 5, the confidence intervals are overlapping. In particular, the tighter one, which corresponds to the oscillations of the rear cylinder, is almost entirely contained in the one corresponding to the front cylinder. The situation changes for the large reduced velocities, U red = 6 and 8. More precisely, for U red = 6 the interval 25%–95% of (y Fr/D)max is almost entirely contained in the interval 5%–20% of the rear cylinder. Finally, the two 90% confidence intervals become completely disjointed for the largest reduced velocity, namely, U red = 8. The quantification of these probabilities of occurrence suggests that the conclusions reported in Borazjani and Sotiropoulos (Reference Borazjani and Sotiropoulos2009), which can be used to guide the design of the system when only deterministic results are available, can be corroborated by the UQ analysis only for the reduced velocity U red = 8. For this latter reduced velocity, the visualization of the 90% confidence intervals, which are not overlapping, confirms that the rear cylinder exhibits a higher amplitude of oscillations with respect to the front cylinder. For all the other reduced velocities, the conclusions of Borazjani and Sotiropoulos (Reference Borazjani and Sotiropoulos2009), corresponding to the nominal conditions, agree with the events with the highest probability of occurrence.
Box plots (25%, 50%, and 75%) and whisker bars (5% and 95%) for the response of (a) front and rear cylinder and (b) front cylinder maximum amplitude of oscillation (y Fr/D)max compared to the maximum amplitude reached by an isolated cylinder. Both curves are reported as a function of the reduced velocity U red.

4.5. Front and isolated cylinder: Comparison of the envelopes
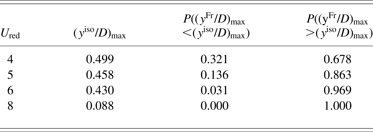
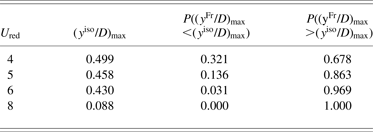
The fluid–structure simulations enable the designer to consider the mutual interference between structural elements without relying on the results related to isolated elements. In Borazjani and Sotiropoulos (Reference Borazjani and Sotiropoulos2009), the authors were able to build an envelope for the maximum vertical displacement of the front cylinder in comparison with an isolated element. The key results are that larger amplitudes occur for the tandem arrangement compared to the isolated cylinder and also that a wider lock-in region is present for the tandem arrangement. However, when the relative position of the two cylinders is affected by the presence of uncertainty, the analysis can be complemented by the quantification of the probabilities associated to these events. For instance, the PDF for (y Fr/D)max can be used to quantify the probability of exceeding the value of maximum displacement attained by the isolated cylinder. In Figure 10b, the box plots and the whiskers bars, as defined in the previous section, are reported for the front cylinder and compared with the maximum deflection of the isolated cylinder. It appears evident that, when considering the median of the PDF, these values are always higher than the corresponding values associated with the isolated cylinder. However, the confidence intervals are negatively skewed, that is, a long tail of the distribution is oriented toward low values; hence, a nonnegligible probability is associated with displacements that are smaller than the isolated cylinder's ones. In Table 1, for each reduced velocity, the probabilities of exceeding the displacements of the isolated cylinder, (yiso/D) max , are reported. The utility of this kind of quantification for the designer appears evident if a probability threshold is assigned to a response of the system. For instance, if the structure is designed to have a 95% probability to exhibit larger oscillations than a single cylinder, thus the design reduced velocity should be chosen to be U red > 6.
Probability for the front cylinder of exceeding the maximum displacement of the isolated cylinder (y iso /D)max
5. CONCLUSION
A preliminary assessment for the design tolerances of the VIV of two oscillating cylinders in the proximity-wake interference region is presented, and the importance of the UQ propagation for designing purpose is highlighted. A numerical analysis is performed on a configuration consisting of two identical rigid cylinders placed in tandem. The cylinders are elastically mounted and, therefore, are free to vibrate, transversally to the flow, in response to flow-induced forces. An imperfect knowledge of the relative resting distance between the cylinders is considered a source of uncertainty in the system. The vibration of this arrangement is studied for flows corresponding to reduced velocities ranging from 4 to 8. Two uniform random variables are used to prescribe the uncertain resting relative position of the two cylinders. The Navier–Stokes equation, describing the incompressible flow, is solved numerically using a second-order accurate finite difference scheme on a Cartesian staggered grid. The nonlinear terms are discretized by an explicit Adams–Bashforth scheme and the linear viscous terms by an implicit Crank–Nicolson scheme, whereas the presence of moving bodies is taken into account by using an IB technique. The interaction of the vibrating cylinders with the incoming fluid is taken into account by means of a strongly coupled iterative FSI scheme. The propagation of the random inputs is performed by using a PC approach, which required 45 numerical simulations (for each reduced velocity) to obtain a converged solution in the stochastic space. The PC expansion is chosen also as a surrogate model to obtain statistics for different quantities of interest of the system, namely, the maximum vertical displacements of the front and rear cylinders and the maximum vertical distance attained by the cylinders during the entire motion. The ANOVA analysis is used to understand the relative importance of the longitudinal and vertical position of the rear cylinder for the different regimes. The contribution of the horizontal separation is always the most important one for all the QoI and the reduced velocities considered in this study, with the exception of the maximum amplitude of oscillation of the rear cylinder and the maximum separation between the cylinders at the reduced velocity U red = 8, for which the main contribution to the variance comes from the vertical separation L y /D. Moreover, the ANOVA analysis shows a critical regime, around a reduced velocity of approximately 5.5, which is identified by the peak of the variance contribution associated with the horizontal separation between the cylinders. Moving away from this critical condition, the contribution of the vertical separation to the variance becomes, increasingly, more important. ANOVA also enables the designer to choose the optimal configuration of the system, and operating conditions, such that the robustness of the system is maximized under the effect of the uncertainty. For instance, if the cylinders are placed at the shortest longitudinal distance considered in this study, L x /D = 1.44, and at a reduced velocity U red = 6, the loadings are minimized and the sensitivity of the QoI, with respect to the uncertainty, is minimized too. The analysis is complemented by the extension, and the quantification in the probabilistic sense, of the main findings reported in Borazjani and Sotiropoulos (Reference Borazjani and Sotiropoulos2009) for the nominal conditions: larger amplitude of motion for the tandem arrangement compared to an isolated cylinder, larger oscillation for the front cylinder compared to the rear one for low reduced velocities, and significantly larger vibrations for the rear cylinder compared to the front one when the reduced velocity is above a certain threshold. This work can be considered as a first step toward the definition of clearance acceptance criterion with explicit assessment of the uncertainty extending the approaches presented in Det Norske Veritas (2009). The results illustrate the radical difference between single riser and interfering risers in the determination of the maximum oscillation under VIV. For instance, for reduced velocities above U red = 6, the probability of occurrence of oscillations larger than the single cylinder case is 95%. Current research directions are focused on the analysis of the evolution of the vorticity and pressure fields to gain a deeper understanding of the physical mechanisms that are responsible for the transition between the different regimes revealed by the preliminary stochastic analysis reported in this study.
Gianluca Geraci is a Postdoctoral Fellow in the Flow Physics and Computational Engineering Group at Stanford University. He received his PhD in applied mathematics and scientific computing in 2013 from the French Institute for Research in Computer Science and Automation (INRIA) and the University of Bordeaux 1, France. In 2010 he received a Master's degree in aeronautical engineering from the Politecnico di Milano, with a major in aerodynamics. His current research interests are in the area of uncertainty quantification for fluid flow problems.
Marco de Tullio is an Associate Professor in fluid dynamics at the Politecnico di Bari. He received his PhD in mechanical engineering in 2007. Dr. De Tullio has been a member of the research staff at the Centre of Excellence for Computational Mechanics at the Politecnico di Bari since 2003. His research, which is in the field of computational fluid dynamics, is focused on the development of immersed boundary techniques for the simulation of a large variety of complex problems, involving moving and deforming geometries. He has given several invited lectures on the immersed boundary method in Europe and the United States.
Gianluca Iaccarino is an Associate Professor in mechanical engineering and Co-Director of the Institute for Computational Mathematical Engineering at Stanford University. He received his PhD from the Politecnico di Bari in 2005. In 2008 Professor Iaccarino funded the Uncertainty Quantification Lab, which works on algorithms to assess the impact of tolerances and limited knowledge on the simulation of engineering systems. Dr. Iaccarino has served as the Director of the Stanford Thermal and Fluid Sciences Industrial Affiliate Program since 2009. In 2010 he received the Presidential Early Career Award for Scientists and Engineers from the US Department of Energy.