Implications
The results indicate the growth traits are moderately heritable in Brahman cattle, and that such traits can be genetically improved by breeding programs. The breeding programs aiming for both BW and body measurements are possible, as suggested by their correlations. With the high correlations, only BW can determine growth for beef cattle in the selection index theory instead of including both BW and body measurements. This is the same case for the growth traits at early age and the maturity.
Introduction
Worldwide demand for beef is growing each year, particularly in developing countries, due to rising incomes along with population growth. To meet production demand, either the number of beef cattle raised needs to increase (along with more pastures) or the farm production needs to improve, which is a more sustainable solution (Bruinsma, Reference Bruinsma2003). An improvement could be accomplished through genetic improvement by executing a breeding program (Simm, Reference Simm1998; Visscher et al., Reference Visscher, Hill and Wray2008; Toghiani, Reference Toghiani2012) with selection based on estimated breeding values for economically important traits.
In Thailand, a breeding program with the imported American Brahman cattle has been established since the 1950s. This breed, selected under Thai environmental conditions, is able to cope with high temperatures, high humidity and insect and disease challenges. The established breed, known as Thai Brahman, is used throughout the country. To further increase productivity, Thai Brahman and Taurine cattle are often crossed in order improve the growth rate. The Thai Brahman cattle are mainly raised to supply the modern trade market, which demands beef from young animals marketed around 2 years of age. The sale price is determined by visual appraisal; therefore, BW and body measurements are economically important traits for Thai Brahman cattle (Bureau of Animal Husbandry and Genetic Improvement (BAHGI), 2015; Osothongs et al., Reference Osothongs, Khemsawat, Sarakul, Jattawa, Suwanasopee and Koonawootrittriron2016). To improve such traits by selection, genetic parameters for the population are required. Knowledge about genetic parameters related to economically important traits are important for the design of the breeding program. The parameters include heritabilities and genetic and phenotypic correlations of breeding objective traits, and other traits that may be related and can be measured on young breeding animals. In earlier studies on Thai beef cattle, positive correlations have been found between BW and body measurements (Intaratham et al., Reference Intaratham, Koonawootrittriron, Sopannarath, Graser and Tumwasorn2008). These traits are relatively easy to measure, have a moderate to high heritability and have shown to respond to selection (Afolayan et al., Reference Afolayan, Pitchford, Deland and McKiernan2007; Bertipaglia et al., Reference Bertipaglia, Carreño, Aspilcueta-Borquis, Boligon, Farah, Gomes, Machado, Rey and da Fonseca2015). The objective of this study was to estimate the heritability of, and the phenotypic and genetic correlations between BW and body measurements recorded at different ages in the Thai Brahman cattle in order to evaluate their suitability to be included in a selection index.
Materials and methods
Animals and data
Data for this study were collected by the Department of Livestock Development (DLD) and the use of data was authorized by DLD. The cattle were from 17 animal research stations located in the central, eastern, north-eastern and southern regions of Thailand. Grey and red Brahman cattle were presented in the dataset. Animal pen size was 600 m2, 24 m×25 m. One pen contained up to 50 cattle weighing <200 kg or 30 cattle >200 kg. The animals could graze on pasture during daytime. At night all animals were housed and supplemented with hay or silage and complemented with 0.5 kg of 14% crude protein concentrate per head. Drinking water and dry lick mineral block were available for each pen. For calving, herds were managed to calve in rainy (from May to September) and cold season (from October to January), but there were a few calves born in warm season (from February to May). Selection of animal for replacement was chosen from candidate bulls from all available herds and the selection was based on performance and appearance after weaning period. Selected bulls were assigned to mate with dams within research stations to provide genetic ties. The average daily temperature was 28.5°C and the average relative humidity was 75.7%. In total, 26 years of data (1990 to 2016) were used in this study.
Phenotypes
All calves were weighed within 24 h after birth and stayed with their dam until weaning at around 5 to 7 months. Males as well as females were recorded and only males were selected after weaning based on their performance at birth and weaning due to cost saving. This mean only selected bulls had records for post-weaning. Phenotypic records comprised BW and body measurements, which were heart girth (GR), body length (BL) and hip height (HH). Girth rate was measured as the circumference behind the forelegs, BL was measured from the shoulder blades to the pin bone and HH was measured from the ground to the hip bone. Traits were measured at birth, 200 days (weaning), 400 days (yearling) and 600 days of age.
Data editing
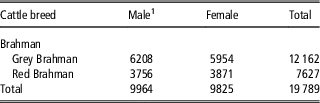
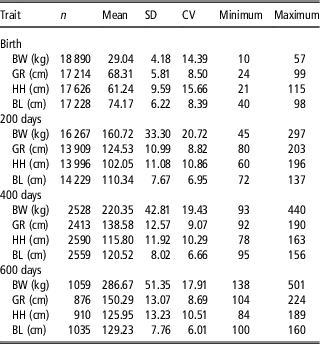
Phenotypic records were removed when the record was more than 4 SDs from the mean. Contemporary groups (which consist of year-season within each herd) had to have >50 observations or where removed otherwise. There were 81 contemporary groups in total. Herds were defined according to animal research stations, and there were 17 herds of cattle. In total, 19 790 animals had at least one phenotypic record and 24 919 were present in the pedigree. The animals with phenotypic records had a complete pedigree, with both parents known. There were 7371 different dams represented in the pedigree, with 2845 dams also included their own phenotype and 7371 dams having progeny with a record. The average number of progeny per dam was 2.62, with a minimum of 1 and a maximum of 12 per dam. There were 867 sires represented in the pedigree with 262 also included their own phenotype, and 866 sires having progeny with a record. The average number of progeny per sire was 22.06, with a minimum of 1 and a maximum of 251 per sire. The data after editing are presented in Table 1, showing numbers of animal records grouped by color and gender, and the descriptive statistics for the recorded traits are presented in Table 2.
Number of animal records grouped by color and gender

1 Selection at weaning was used on males, so only selected bulls had records for post-weaning traits.
Number of observations (n), means, SD, CV, minimums and maximums for BW, heart girth (GR), hip height (HH) and body length (BL) at birth, 200, 400 and 600 days of age in Brahman cattle

Statistical analysis and models
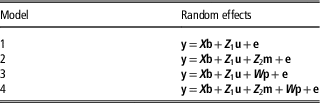
Genetic parameters were estimated using an animal model on the software package ASReml (Gilmour et al., Reference Gilmour, Gogel, Cullis, Welham and Thompson2015). The following fixed effects were fitted in model 1 (see Table 3; for BW at birth: sex, herd, breed and contemporary group). Later measurements also fitted age of animal, unit of day, at the time of measurement. There were two breeds considered in the data: grey and red Brahman. The Thai Brahman breed was subdivided into two groups because the red type strongly preferred in the southern region and the grey type more dominant in the rest of the country. Fixed effects in the model were identified through preliminary ANOVA using a linear model with only fixed effects in RStudio (RStudio Team, 2016). Effects with P-value <0.05 were kept in the model for further analysis as random effects we fitted direct additive genetic effects and maternal genetic, as well as permanent maternal environmental effects. Various models with different combinations of random effects were compared, and these models are summarized in Table 3. The log-likelihood ratio test was used to test if the addition of a particular random effect was significant (P-value < 0.05). The variance components from the most appropriate univariate analysis were used to calculate heritability. A series of multivariate model analyses were then performed to estimate (co)variances among the traits at the same age and between the same trait at different ages of animal. In the multivariate analyses, a four-trait model, the most suitable model, was used for each trait based on univariate analyses.
Random effects in model for data analysis in Brahman cattle

y=a vector of the observations; b=a vector of the fixed effects and covariates; u=a vector of random additive genetic effects; m=a vector of random maternal additive genetic effects; p=a vector of random permanent environmental effects; e=a vector of residual effects; X , Z 1, Z 2 and W =incidence matrices relating observations to fixed, additive genetic, maternal additive genetic and maternal permanent environmental effects, respectively.
Results
Fixed and random effects
With breed effect, there were no difference between grey and red Brahman for the traits studied. Females had consistently lower means than males for both BW and body measurements at all ages.
The model with the additive genetic, maternal genetic and maternal permanent environmental effects (model 4) had the highest likelihood for BW at 200 days of age. BW and body measurements at birth and 200 days of ages were best fitted in model 2, using additive and maternal genetic effects, except for BL where maternal effects were not significant. All traits at 400 and 600 days of age were best estimated fitting model 1 in which maternal effects were not fitted.
Variance components and heritabilities
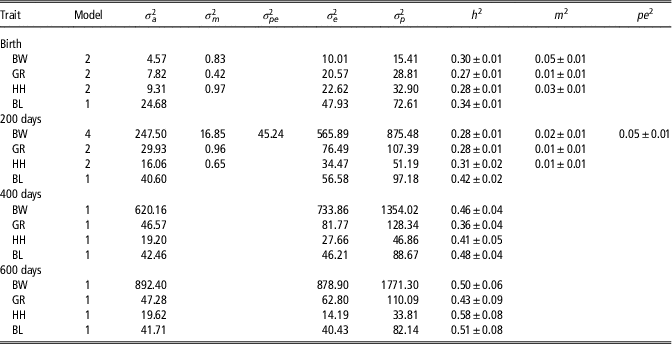
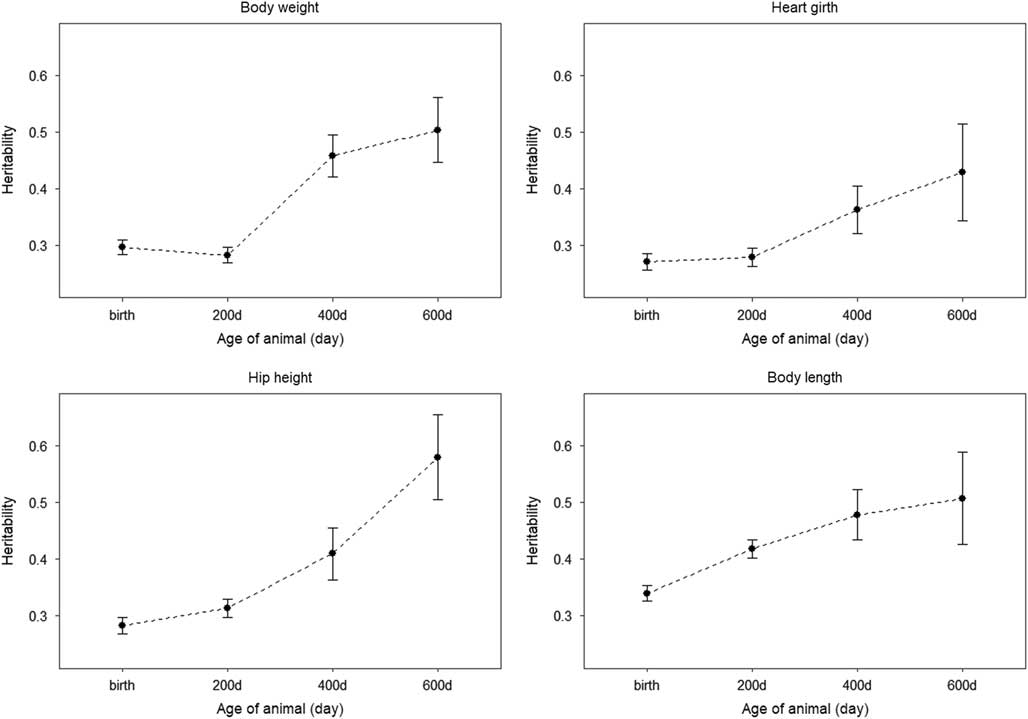
Variance components and heritabilities for all traits from the best univariate model are shown in Table 4. Heritabilities estimated from birth to 600 days of age ranged from 0.28±0.01 to 0.50±0.06 for BW, 0.27±0.01 to 0.43±0.09 for GR, 0.28±0.01 to 0.58±0.08 for HH and 0.34±0.01 to 0.51±0.08 for BL. There was a trend such that heritabilities for the trait increased with age (Figure 1). Heritabilities for traits at birth were slightly different from 200-day traits, except for BL. The maternal genetic effect was generally low, explaining between 1% and 5% of the phenotypic variance. The largest maternal genetic effect was for BW at birth, explaining 5% of the phenotypic variance. The maternal permanent environmental effect only explained BW at 200 days of age with a value of 5% of the phenotypic variance. In total, the maternal effect (sum of maternal genetic and permanent environmental effects) explained a considerable part of the phenotypic variance (7% for BW at 200 days).
Estimates of variance components, heritabilities and maternal heritabilities for BWs and body measurements in Brahman cattle from appropriated models

GR=heart girth; HH=hip height; BL=body length;
 $\sigma _{a}^{2} $
=additive genetic variance;
 $\sigma _{m}^{2} $
=maternal additive genetic variance;
 $\sigma _{{pe}}^{2} $
=permanent environmental variance;
 $\sigma _{e}^{2} $
=residual variance;
 $\sigma _{p}^{2} $
=phenotypic variance; h
2=heritability; m
2=maternal heritability, pe
2=maternal permanent environmental effect.
Heritabilities with the standard error for the traits studied at different age classes in Brahman cattle.

Genetic and phenotypic correlations
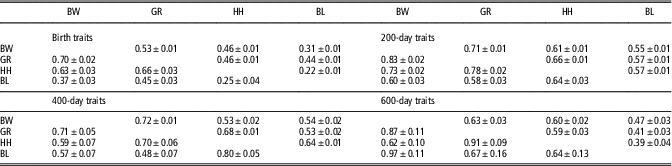
Correlations between different traits studied at the certain age are summarized in Table 5. Genetic correlations were all positive and higher than 0.5, except for BL and BW, BL and GR, BL and HH at birth and BL and GR at 200 days (0.37±0.03, 0.45±0.03, 0.25±0.04 and 0.48±0.07, respectively). The phenotypic correlations had the same pattern as the genetic correlations, but the values of phenotypic correlation were slightly lower.
CorrelationsFootnote 1 between the traits at the certain age in Brahman cattle

GR=heart girth; HH=hip height; BL=body length.
1 Above diagonal=phenotypic correlations; below diagonal=additive genetic correlations.
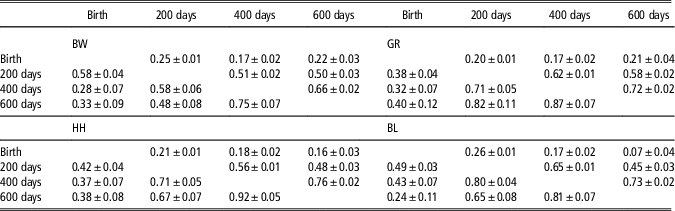
Estimation of correlations between the measured traits studied at different ages is presented in Table 6. All traits were positively correlated between ages. Genetic correlation between measurements at birth and older ages was the lowest. For example, the genetic correlation between BW at birth and 600 days was estimated at 0.33±0.04. Genetic correlations were higher between traits at older ages. For instance, the genetic correlation between BW at 400 days with BW at 600 days was estimated at 0.75±0.09. This pattern was also observed for the body measurement traits.
CorrelationsFootnote 1 between the same trait at different age classes in Brahman cattle

1 Above diagonal: phenotypic correlations; below diagonal: additive genetic correlations.
Discussion
Heritabilities
Estimates of heritability for the traits studied were moderate to high and increased with the age of the animal, except for 200-day BW which was slightly lower than BW at birth. Heritability estimates from birth to 600 days of age ranged from 0.28±0.01 to 0.50±0.06 for BW. The traits measured during the pre-weaning period were influenced by maternal genetic effect, except for BL, and only BW at 200 days of age was explained by permanent environmental effects of the dam.
The heritability estimates obtained in this study are within or close to the range of values reported by other studies. Tessema et al. (Reference Tessema, Sopannarath, Tumwasorn and Raungprim2013) reported an estimate of heritability for weaning BW of 0.55 in crossbred Thai cattle. Vargas et al. (Reference Vargas, Buzanskas, Guidolin, Grossi, Bonifácio, Lôbo, da Fonseca, Oliveira and Munari2014) reported estimates of heritability of BW in Brahman cattle in Brazil from ages of 120 days to 550 days ranged from 0.26±0.05 to 0.39±0.06. The same study reported maternal heritabilities between 0.09±0.03 and 0.19±0.04. A study on Brahman cattle in Brazil Bertipaglia et al. (Reference Bertipaglia, Carreño, Aspilcueta-Borquis, Boligon, Farah, Gomes, Machado, Rey and da Fonseca2015) estimated higher heritabilities for BW at the ages between 60 and 550 days, ranging from 0.60 to 0.75 using random regression, and 0.44 to 0.75 using multivariate analysis.
We found maternal heritability and maternal permanent environmental effects only to be significant for pre-weaning traits. This result differs from studies in Brahman cattle reported by Pico et al. (Reference Pico, Neser and Van Wyk2004), Vargas et al. (Reference Vargas, Buzanskas, Guidolin, Grossi, Bonifácio, Lôbo, da Fonseca, Oliveira and Munari2014) and Bertipaglia et al. (Reference Bertipaglia, Carreño, Aspilcueta-Borquis, Boligon, Farah, Gomes, Machado, Rey and da Fonseca2015) where maternal heritability and maternal permanent environmental effects were found for both pre-weaning and post-weaning performance traits. For maternal heritability estimates, similar values to our study were found by Pico et al. (Reference Pico, Neser and Van Wyk2004) for BW at birth and weaning, but a higher value at weaning (26%) was obtained by Vargas et al. (Reference Vargas, Buzanskas, Guidolin, Grossi, Bonifácio, Lôbo, da Fonseca, Oliveira and Munari2014).
We found moderate to high estimates of heritability for body measurements including GR, BL and HH, ranging from 0.27±0.01 to 0.58±0.08 in Thai Brahman cattle. Heritability for weaning GR in Bali cattle (0.40±0.09) was reported by Supriyantono et al. (Reference Supriyantono, Tomiyama and Suzuki2012) and was within the range estimated in this study. Our heritability for weaning HH was below the range (0.54 to 0.73) reported by the other authors (Vargas et al., Reference Vargas, Elzo, Chase and Olson2000; Magnabosco et al., Reference Magnabosco, Ojala, De Los Reyes, Sainz, Fernandes and Famula2002; Tessema et al., Reference Tessema, Sopannarath, Tumwasorn and Raungprim2013). A very high heritability (0.65) for mature HH was obtained by Vargas et al. (Reference Vargas, Elzo, Chase, Chenoweth and Olson1998). Heritabilities for weaning BL ranged from 0.32 to 0.39 in Bali cattle (Supriyantono et al., Reference Supriyantono, Tomiyama and Suzuki2012) and Brahmans from Mexico (Magnabosco et al., Reference Magnabosco, Ojala, De Los Reyes, Sainz, Fernandes and Famula2002), which is comparable to estimates found in this study. The lower values for post-weaning body measurements in Bonsmara cattle were found by Maiwashe et al. (Reference Maiwashe, Bradfield, Theron and van Wyk2002) (0.18±0.05 for BL and 0.41±0.06 for shoulder height). A study on Australian beef cattle by Afolayan et al. (Reference Afolayan, Pitchford, Deland and McKiernan2007) estimated heritabilities for GR, HH and BL at weaning, 400 days and 600 days of age. The heritability estimates of body measurements ranged from 0.09±0.05 to 0.32±0.19 for GR, 0.19±0.17 to 0.25±0.08 for BL, and 0.42±0.10 to 0.60±0.13 for HH. Gilbert et al. (Reference Gilbert, Bailey and Shannon1993) reported heritability of body measurements at weaning 0.43±0.13 for HH, 0.40±0.13 for GR and 0.25±0.10 for BL in American Angus and Hereford cattle. In general, our heritabilities for body measurements were moderate to high and comparable to other studies.
Genetic and phenotypic correlations
Phenotypic and genetic correlations among the different traits for the same age class ranged from moderate to high. Phenotypic and genetic correlations among the same trait at different age classes ranged from low to high.
The correlations between traits at weaning, which range from 0.60±0.03 to 0.83±0.02 in this study, were within range reported by several authors (Gilbert et al., Reference Gilbert, Bailey and Shannon1993; Vargas et al., Reference Vargas, Elzo, Chase and Olson2000; Magnabosco et al., Reference Magnabosco, Ojala, De Los Reyes, Sainz, Fernandes and Famula2002; Tessema et al., Reference Tessema, Sopannarath, Tumwasorn and Raungprim2013). Maiwashe et al. (Reference Maiwashe, Bradfield, Theron and van Wyk2002) reported highly positive correlations between body measurements and BW at final BW for Bonsmara cattle (0.83±0.05 for BL and 0.72±0.06 for shoulder height). Another study conducted by Afolayan et al. (Reference Afolayan, Pitchford, Deland and McKiernan2007) found correlations between BW and body measurements, including GR, HH and BL, at 400 days of age in Australian, and reported the values for genetic and phenotypic correlations were also highly positive, with values generally higher than 0.5.
Some correlations were low across different age classes for the same trait. Body measurement at birth least correlated with the measurements at older ages, ranging from 0.07±0.04 to 0.26±0.01 (Table 6). The estimated genetic and phenotypic correlations between BW at weaning to maturity were reported to be highly positive by several authors using multivariate analyses (0.46 to 0.82) (Estrada-León et al., Reference Estrada-León, Magaña-Monforte and Segura-Correa2014; Vargas et al., Reference Vargas, Buzanskas, Guidolin, Grossi, Bonifácio, Lôbo, da Fonseca, Oliveira and Munari2014; Bertipaglia et al., Reference Bertipaglia, Carreño, Aspilcueta-Borquis, Boligon, Farah, Gomes, Machado, Rey and da Fonseca2015). The correlation between BWs measured between 60 and 550 days of age ranged from low negative to positive (−0.06 to 0.42) when using a random regression model (Bertipaglia et al., Reference Bertipaglia, Carreño, Aspilcueta-Borquis, Boligon, Farah, Gomes, Machado, Rey and da Fonseca2015). There were no studies on body measurements at different ages to compare.
The Thai Brahman cattle have been observed at various ages for BW and body measurement traits for several years in a national breeding program. These traits are all related to growth and could be used in selection for the main breeding objective trait, which is 600-day BW. Since BW and body measurement traits at the same age were found highly correlated, both phenotypically and genetically, there may be a case to remove some of these traits from a measurement program. However, for breeding purpose, the early trait measurements could be used in a selection index as they can be used for selection of bulls at a younger age.
Conclusion
This was the first study on genetic parameters in the Brahman cattle for BW and body measurements and different ages. Estimates of heritability were moderate to high. Genetic correlations between traits at the same age were positive and generally high. Correlations between measurements of the same trait at different ages were also positive and high. The estimated genetic parameters indicate that the BW and body measurements in the Brahman cattle could be genetically improved. Therefore, selection for improved growth could be achieved using BW traits and/or correlated traits such as body measurements. Furthermore, both the estimated genetic and phenotypic correlations between the traits are favorable. This means that the traits could be easily improved simultaneously in the same breeding program or include related traits in selection criteria to gain accuracy using selection index theory.
Acknowledgements
The authors would like to express sincere thanks to the Royal Thai Government for financial support and Department of Livestock Development of Thailand for dataset support for this project.
Declaration of interest
None.
Ethics statement
None.
Software and data repository resources
None of the data were deposited in an official repository.