INTRODUCTION
Two general conditions of linguistic change are that children come to speak differently than their primary caregivers (cf., Weinreich, Labov, & Herzog, Reference Weinreich, Labov, Herzog, Lehmann and Malkiel1968:184–185), and, with each generation, divergence proceeds in the same direction as the previous generation. But how do we account for what Labov (Reference Labov2001:411) described as the “seamless succession of [leaders of change], one more advanced than the next” that characterizes generational change? Answering this question is the empirical challenge at the heart of Labov's (Reference Labov2001:503) socially motivated projection model of change.Footnote 1 A component of this model is a stage of vernacular reorganization, a period from about age 5–17 during which children and adolescents shift their grammars in ways that reflect the diachronic trajectories of changes in progress (Labov, Reference Labov2001:415).
The period of vernacular reorganization has an upper bound (i.e., an age limit) of about 17 years old. This predicts that at any given synchronic state, the speakers at the forefront of change will be those members of the community approaching the end of this period. According to this model, 17-year-olds will have gone through vernacular reorganization for longer than speakers younger than them, and therefore will be more advanced than those younger speakers. Additionally, 17-year-olds are hypothesized to have acquired a more advanced level of a change in progress from their caregivers compared to immediately older speakers; therefore, 17-year-olds will also be more advanced than those speakers. Thus, when viewed in apparent time, the trajectory of change across all age cohorts of a community will exhibit a peak in apparent time around the age of 17 (Labov, Reference Labov2001:454): those who are 17 will be more advanced than those who are 15 (who have not yet peaked), and also more advanced than those who are 19 (who peaked at a lower level two years earlier).
Such a peak has been reported (implicitly or explicitly) in many apparent time studies of changes in progress (inter alia, Ash, Reference Ash1982; Cedergren, Reference Cedergren1973, Reference Cedergren1984; Cheshire et al., Reference Cheshire, Kerswill, Fox and Torgersen2011; Labov, Reference Labov2001; Tagliamonte & D'Arcy, Reference Tagliamonte and D'Arcy2009; Wagner, Reference Wagner2008). However, as Tagliamonte (Reference Tagliamonte2012:48) noted, other explanations are consistent with this empirical pattern in apparent time. For example, Ash (Reference Ash1982) suggested the pattern is due to community-level retrograde change. In this scenario, a peak in frequency of an ostensible innovation is due to a community-wide reversal of the direction of change; a peak among older adolescents (i.e., 17-year-olds) is the result of younger adolescents (i.e., 15-year-olds) leading this reversal. Alternatively, both Cedergren (Reference Cedergren and Lowenberg1988:53) and Chambers (Reference Chambers2003:195) suggested that age-grading (or, as Tagliamonte [Reference Tagliamonte2012:49] put it, “a return to adult norms following adolescent years”) is responsible for teenagers’ rise and subsequent fall in frequency of adolescent-associated speech features. In order to disentangle these three competing hypotheses—vernacular reorganization, retrograde change, and age-grading—real-time data is necessary. One possible methodological approach is a panel study that follows the same individuals from adolescence into early adulthood. In such a study, vernacular reorganization would be reflected in the advancement of an innovation by an individual year-by-year until the age of 17. At that point, the individual is predicted to stabilize. Tagliamonte (Reference Tagliamonte2012:274–6) and Wagner and Tagliamonte (Reference Wagner, Tagliamonte, Wagner and Buchstaller2018) tracked a speaker's usage of quotative be like through adolescence and early adulthood. They reported results consistent with vernacular reorganization (see below). A second methodological approach is a trend study, which compares two cohorts of speakers from the same community, with the two cohorts born in the same year but interviewed at different times—one cohort interviewed before and one cohort interviewed after cohort members have stabilized. In other words, the first cohort is interviewed when its members are younger than 17; the second cohort interviewed some years later when its members are older than 17. This method can test whether vernacular reorganization occurred in the time between the two interview times. Crucially, it can also distinguish between vernacular reorganization, retrograde change, and age-grading.
In this paper, we pursue the second method, through a real-time analysis of the rise of the be like quotative, as in (1):Footnote 2
(1)
a. He’s like, “Do you know what the book is about?” And I'm like, “I think so.” (F/16/2003)
b. I was like, “Oh, like the other day, like the first time in so long he actually said something nice about me” and I was like, “’cause of my writing on cakes. That's the only thing he'll ever compliment me is on cakes.” (F/19/2013)
The data come from two corpora of vernacular speech collected ten years apart, in 2003 with speakers aged 10 to 86, and in 2013, with speakers who were under 17 when the 2003 data was recorded, born between 1986 and 1999, and aged 16 to 27 in 2013. The two sets of recordings of speakers born between 1986 and 1999, offset by 10 years of real time, allows us to test the hypotheses that vernacular reorganization and subsequent stabilization took place between 2003 and 2013 while this cohort of speakers went through adolescence.Footnote 3 Both corpora are balanced for binary gender, and the 2003 data is also a balanced sampling of ages between 10 and 86. Both were collected using comparable sociolinguistic methods, in Toronto, Canada. Trend studies of this nature that directly compare age cohorts at two different times are not common in sociolinguistics, which makes our approach largely unprecedented (though, see Pope, Meyerhof, & Ladd [Reference Pope, Meyerhof and Ladd2007] for a notably similar methodology for examining change across the lifespan).
The paper is organized as follows. We first review Labov's (Reference Labov2001) socially motivated projection model of linguistic change, focusing on extant evidence for the beginning and end points of vernacular reorganization. We present both Labov's (Reference Labov2001) evidence and support from subsequent research. Next, we describe our data and briefly discuss past quotative research. We then present our results, which provide confirmation of vernacular reorganization during adolescence within a community using real-time trend data. Our results diverge from Labov's predictions in one respect. We find evidence that male adolescents undergo vernacular reorganization just as female adolescents do. We conclude that these unexpected results, while in conflict with the specifics of the original model, are in line with more recent sociolinguistic findings (vis-à-vis language and gender generally, and for quotatives specifically), and are logically consistent with a more contemporary, socially realistic conception of Labov's idealization.
TRANSMISSION AND INCREMENTATION VIA VERNACULAR REORGANIZATION
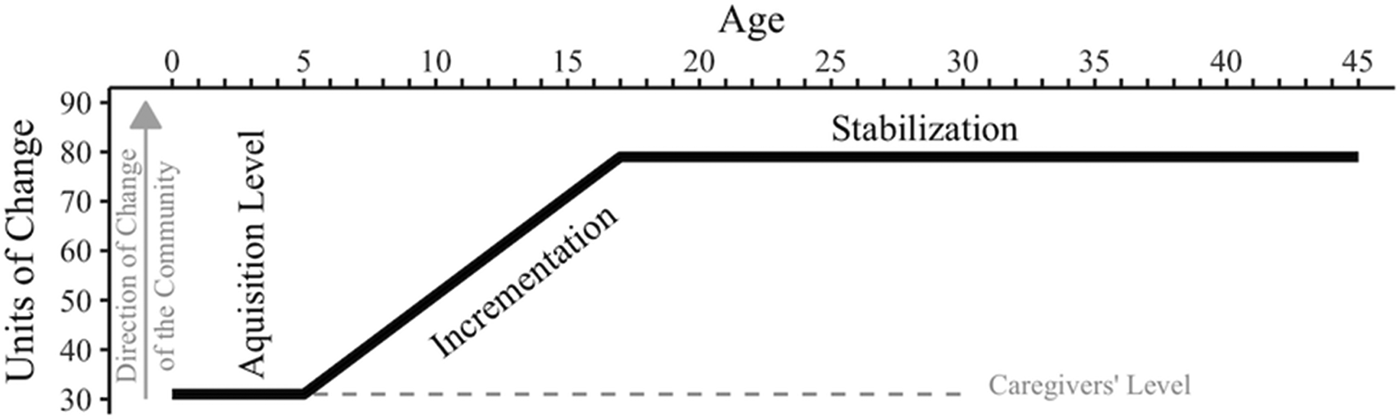
Two central features of Labov's model are: (1) the consistent intergenerational transmission of changes in progress from caregivers to children, and (2) the incremental progression of change driven by vernacular reorganization in adolescence. The model is idealized in Figure 1 (Labov, Reference Labov2001:448).
An idealized model of incrementation for a single (female) speaker from 1–45 years of age (adapted from Labov [Reference Labov2001:448, Figure 14.1]).

In brief, speakers in (urban, Western) speech communities first acquire the grammar of their primary caregivers, which necessarily includes features that are undergoing change within the speech community. For these changes in progress, children first acquire the variable patterns of their caregivers at their caregivers’ level of advancement of each change. Children subsequently reorganize their variable grammars from ages five to 17. This reorganization is not random, but follows the direction of change in the community. At approximately 17, the grammars of adolescents essentially stabilize; into adulthood, speakers may still change in the direction of the community, but Labov, Rosenfelder, and Fruehwald (Reference Labov, Rosenfeler and Fruehwald2013:39) argued that the rate of change will be substantially smaller than during vernacular reorganization (cf., Sankoff, Reference Sankoff and Brown2006; Sankoff & Blondeau, Reference Sankoff and Blondeau2007).
The simplest version of the model assumes that all speakers participate in the change in exactly the same way, as schematized in Figure 1. However, Labov (Reference Labov2001) argued for gender asymmetry, whereby only female speakers undergo vernacular reorganization. He argued that women shift their grammars in the direction of community changes in progress during adolescence, but men do not. Adult men match the vernacular of their (typically female) caregivers, who are a generation older than the men's female peers. Labov's proposal is intended to account for two tendencies found across studies of changes in progress in English and other languages: first, that women tend to be the leaders of linguistic change, and, second, that men tend to lag behind by about a generation (see Gauchat [Reference Gauchat1905]; Hermann [Reference Hermann1929] on Swiss French; Wolf & Jiménez [Reference Wolf, Jiménez and Barrenechea1979] on Buenos Aires Spanish; Chae [Reference Chae1995] on Seoul Korean; Chambers & Hardwick [Reference Chambers, Hardwick, Harris and Hawkins1985] on Toronto and Vancouver English; Labov [Reference Labov2001] on Philadelphia English; Haeri [Reference Haeri1996] on Cairo Arabic, etc.; see also Labov [Reference Labov2001:279–284, 303–306] for discussion).
Details of transmission
According to Labov (Reference Labov2001:437), “[c]hildren begin their language development with the pattern transmitted to them by their female caretakers.” This is the first stage of transmission. For example, Kerswill and Williams (Reference Kerswill and Williams2005:1030) found a significant correlation between the speech of four-year-olds and that of their female caregivers for the fronting and unrounding of (ou) in Milton Keynes. Furthermore, the correlation goes beyond frequency matching. Roberts (Reference Roberts1994:145–146) showed that children under the age of five exhibit the same variable grammar constraining (-ing) variation as the adult model. Similarly, Smith, Durham, and Fortune (Reference Smith, Durham and Fortune2007:78–79, 87–88) show that the children in their study acquire their caregivers’ linguistic constraints for variable (au) and verbal -s before age four.
Labov's (Reference Labov2001:437) second stage of transmission is as follows: “[l]inguistic variation is transmitted to children as stylistic differentiation on the formal/informal dimension, rather than as social stratification. Formal speech variants are associated by children with instruction and punishment, informal speech with intimacy and fun.” Smith, Durham, and Fortune (Reference Smith, Durham and Fortune2007) provided confirmation that the language use of caregivers and children in didactic and disciplinary contexts, in which the power differential is emphasized, involves markedly lower rates of nonstandard/informal/local variants such as the local monophthongal variant of (au), compared with intimate and day-to-day interactions. Thus, children's first associations of formal/informal and standard/nonstandard are with the only social reality that children have: are they “being placed in the category of ‘good’ or ‘bad’ and will [they] be rewarded or punished for what they have done?” (Labov, Reference Labov2001:420).
The final stage in transmission is that adolescents subsequently associate different variants with different levels of social status and conformity, and to different positions within the social structure of their speech community (Labov, Reference Labov2001:437).Footnote 4 With respect to the second component of the transmission problem (that differences across generations are consistently in the same direction), it must be the case that children infer the direction of change from the behavior of speakers of different ages in the speech community. That is, children must be attuned to what Weinreich, Labov, and Herzog (Reference Weinreich, Labov, Herzog, Lehmann and Malkiel1968:184) observed is the “continuous distribution through successive age levels of the population.” Their slightly older peers have a grammar that is that much more advanced than those members of the community who are adults, those adult speakers are that much more advanced than speakers older still, and so on. Indeed, Stanford, Severance, and Baclawski (Reference Stanford, Severance and Baclawski2014) have shown children's attention to these community patterns and McCullough, Clopper, and Wagner (Reference McCullough, Clopper and Wagner2015) found that children as young as four are able to distinguish different dialects of American English by locality, status, and solidarity (see also Chambers, Reference Chambers2002). If children extrapolate along this age trajectory accordingly, there will be a mismatch between their current (caregiver-like) grammar and what they infer their own level of advancement should be given the community pattern. Remedying this mismatch leads to vernacular reorganization (Labov, Reference Labov2007:379–380).
Details of vernacular reorganization
Figure 1 is a highly idealized schematic in that several parameters are fixed (including the onset and end of vernacular reorganization and the size of a generation). It assumes that year-by-year change will advance by uniform increments. However, real world linguistic change follows an S-shaped curve, not the linear trajectory that Figure 1 depicts (Altmann, von Buttlar Rott, & Strauss, Reference Altmann, von Buttlar, Rott, Strauss and Brainerd1983; Denison, Reference Denison and Hickey2003; Devitt, Reference Devitt1989; Kroch, Reference Kroch1989). For this reason, Labov (Reference Labov2001) argued that yearly increments of advancement must vary depending on the progression of the change in the community—beginning small, increasing in magnitude, and then receding as the change comes to completion. Labov (Reference Labov2001:450) proposed that the size of an increment for any given year can be determined by the logistic function, as in (2). This function generates the well-observed S-curve of change.
(2)
 $$I={K_1}/(1+{K_2/N_0}\times {e^{-rt}})$$

Each parameter of the function represents an abstract component of the constraints on a change. K 1 is the maximum possible change in one year, and K 2 is the limit of the change. Both of these parameters are related to the physical or logical upper bound of a change. For example, the limit of an acoustic change is determined by physiological context and the limit for a change that affects the (proportional) frequency of a variant of a variable is 100%. The maximum possible change in a year will be increasingly smaller as the change reaches these limits. N 0 is the initial year of the change (which will always be one). The rate of the change, r (which varies from 0 to 1), determines the speed of the change; a larger r indicates a faster change. The last parameter, t, is time in years for a given increment size. By varying any of these parameters, different values for I (the yearly increment size) are produced.
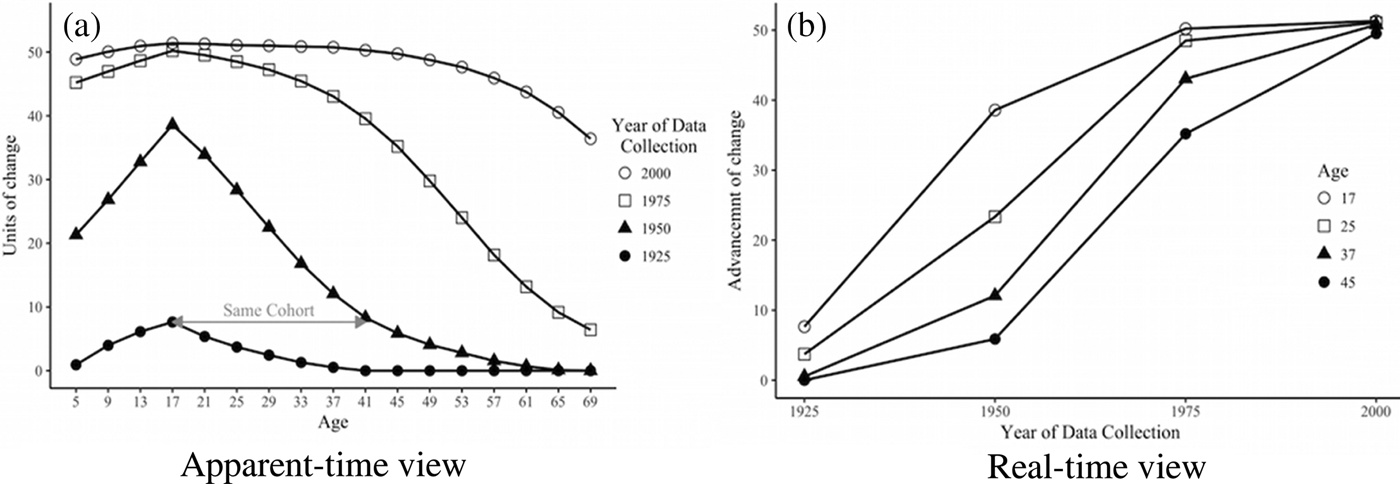
Figure 2a from Labov (Reference Labov2001:453) demonstrates the incrementation of a change in a single community over time when the yearly increments are determined by the logistic function. The four lines represent the proportion of the same incoming variant by age, measured at four 25-year increments. Seventeen-year-olds on the lowest line (1925) were born in the same year as 42-year-olds on the second lowest line (1950) and, therefore, have the same level of advancement of the change. (See Labov [Reference Labov2001:452] for details including a table of yearly increments over a century of change.) In this figure, the level of advancement of a speaker of any given age is calculated by adding the cumulative sum of the increments for each year of her period of vernacular reorganization to her initial level as transmitted from her caregiver. The caregiver may have advanced the change during her adolescence and may have acquired the change in progress from an even older caregiver who advanced the change during her adolescence, etc. For example, if Speaker A is born in the 50th year of a change taking place, she acquires her caregiver's level and then advances this level by the yearly increments in years 55 to 77 (i.e., when she is between the ages of five and 17). If she has a child, Speaker B, in the 75th year of the change, that child will acquire Speaker A's postadolescent level of advancement and then incrementally push the change forward in years 80 through 92 (when Speaker B is between five and 17 years old). In a community, this process happens concurrently and iteratively across the population.
Idealized logistic incrementation, based on Labov (Reference Labov2001:449).

The representation of this community-wide process in Figure 2a shows a smooth trajectory through apparent-time, with each speaker more advanced than speakers older than her (at least for speakers over the age of 17 who have stabilized). Figure 2b transforms the data from Figure 2a to show a real-time perspective: time period is on the x-axis and the lines represent speakers of different ages in those time periods. The pattern is much more S-shaped than linear, consistent with how linguistic change has been observed to proceed.
Lower and upper bounds of vernacular reorganization
The model schematic presented in Figure 1 assumes a lower and upper bound of vernacular reorganization, beginning around five years old and ending around 17.Footnote 5 Labov (Reference Labov2001:426–427) pointed to research on new dialect formation in Milton Keynes to verify the starting point (Kerswill & Williams, Reference Kerswill and Williams1994, Reference Kerswill and Williams2000). Kerswill and Williams’ (Reference Kerswill and Williams2000:93) examination of children aged four, eight, and 12 and their female caregivers shows that the incoming fronted variant of the (ou) variable (versus the conservative back variant) was used most frequently by twelve-year-olds, followed by eight-year-olds. Critically, the four-year-olds and the comparison group of caregivers exhibit a similar rate of the incoming form, a rate lower than the eight- and 12-year-olds, suggesting that vernacular reorganization begins sometime after age four and continues into adolescence. It is likely no accident that this corresponds to a significant life stage change: the beginning of primary schooling. This is an important time for children such that the (linguistic) influence of parents begins to diminish in favor of the influence of peers. Indeed, in computer simulations, Baxter and Croft (Reference Baxter and Croft2016) showed that a transition from primarily adult interaction to interaction with older peers is required to produce adolescent peaks. This new source of social contact instigates vernacular reorganization. At the other end, Labov (Reference Labov2001:447, citing Johnson & Newport [Reference Johnson and Newport1989]) suggested that the culmination of vernacular reorganization (or the beginning of stabilization) is 17, which corresponds with when “the declining ability to acquire native syntactic intuitions hits bottom.”Footnote 6
A prediction of Labov's (Reference Labov2001) model is that, at any given time, the speakers who exhibit the most advanced state of a change will be those who are at the onset of stabilization. Thus, the adolescent peaks that have been observed in the literature are evidence of this stabilization.
For example, Cedergren (Reference Cedergren1973) initially interpreted the adolescent peak she observed for variable lenition of (ʧ) in Panama City Spanish as an indication of retrograde change (i.e., that the younger speakers had reversed the direction of change). When she replicated her study 13 years later, she found a step-wise advancement for each older age group and a similar peak (Cedergren, Reference Cedergren1984), not consistent with retrograde change.
Labov (Reference Labov2001:458) reported that several interrelated changes in the Philadelphia vowel system also exhibit adolescent peaks. For female speakers, either those 17 to 29 or 13 to 16 exhibit the most advanced levels of change. Peaks are less obvious for male speakers; where they were observed, Labov (Reference Labov2001:460) interpreted the few modest male peaks as a potential indication of retrograde change in the community (cf., Labov, Rosenfeler, & Fruehwald, Reference Labov, Rosenfeler and Fruehwald2013).
Tagliamonte and D'Arcy (Reference Tagliamonte and D'Arcy2009) looked for apparent time peaks in several morphosyntactic and discourse-pragmatic changes in progress in another urban setting: Toronto, Canada. The innovative variants of six changes in progress were considered including quotative be like. While these changes vary with respect to the stage of the change at the time of data collection and with respect to the time depth of the change, all but one exhibits an adolescent peak (confirmed through a series of Wilcoxon tests between adjacent age groups). This indicates that vernacular reorganization is not limited to sound change (Tagliamonte & D'Arcy, Reference Tagliamonte and D'Arcy2009: 98). A major difference between Labov (Reference Labov2001) and Tagliamonte and D'Arcy (Reference Tagliamonte and D'Arcy2009), though, is that, in the latter, the trajectories for both women and men exhibit adolescent peaks. Although Labov (Reference Labov2001) suggested that male peaks in his data are the result of retrograde change, this interpretation could not be sustained for quotative be like, discourse like, intensifier so, and possessive have in the Toronto study.
The recurring observation of adolescent peaks in apparent time at approximately the age of 17 for a variety of changes in progress presents substantive evidence for the upper bound of vernacular reorganization. A second piece of evidence is the longitudinal case study of ‘Clara,’ a female speaker from Toronto who has been interviewed by the same interviewer every 12–18 months since 2002, when she was 16 (Brook et al., Reference Brook, Konnelly, Jankowski and Tagliamonte2018; Tagliamonte, Reference Tagliamonte2012; Wagner & Tagliamonte, Reference Wagner, Tagliamonte, Wagner and Buchstaller2018). Tagliamonte (Reference Tagliamonte2012) and Wagner and Tagliamonte (Reference Wagner, Tagliamonte, Wagner and Buchstaller2018) showed that Clara's frequency of the quotative be like begins around 65% at age 16, varies little after one year, and then jumps up to over 75% at age 18, in line with others aged 17–19 in the community. Her rate remains stable until age 22, at which point there is some fluctuation, though her rate never dips to her age 16 level.Footnote 7
METHODOLOGY AND PREDICTIONS
Building on the results from the aforementioned studies, we now turn to a real-time trend study of quotative be like. The exceptional rapidity with which be like has taken over the English quotative system makes it ideal for observing vernacular reorganization (Tagliamonte, Reference Tagliamonte2012:248). We must note that Labov's model was intended to account for the dynamics of sound change and, specifically, sound change from below. However, Tagliamonte and D'Arcy (Reference Tagliamonte and D'Arcy2009) documented adolescent peaks with morphosyntax and discourse-pragmatics changes, including be like (adopted, at least initially, from outside the speech community), and adolescent peaks are also reported for other “changes from above,” like globally-innovative goose-fronting (Cheshire et al., Reference Cheshire, Kerswill, Fox and Torgersen2011). While be like likely arrived in Toronto via contact, the diffusion process would have taken place in the early 1980s, when be like was first attested. Once adopted (typically by adults, though potentially also by adolescents at the time), children subsequently acquire the form in the regular process of language acquisition. Indeed, Tagliamonte and Denis (Reference Tagliamonte and Denis2014) presented a plausible pathway for be like’s development within a community, which has been corroborated by Gardner's (Reference Gardner2017) study of Cape Breton English. The form is initially adopted by young adults via diffusion as a lexical-like borrowing and is then transmitted to the next generation, who impose system-internal constraints consistent with the initially adopted form (e.g., grammatical person of the subject, tense of the quotative). In other words, be like quickly becomes embedded in the variable grammar of the quotative system and is subject to the same process of transmission as Labov describes for sound change from below (see also Buchstaller & D'Arcy, Reference Buchstaller and D'Arcy2009; Cheshire et al., Reference Cheshire, Kerswill, Fox and Torgersen2011; Levey, Reference Levey and Pichler2016).
This paper makes use of two complementary sets of sociolinguistic interview data. The older, baseline data come from the Toronto English Archive (TEA), a multimillion-word corpus of sociolinguistic interviews with native speakers of Toronto English between the ages of nine and 92 (Tagliamonte, Reference Tagliamonte2003–2006, Reference Tagliamonte2006a). The interviews used in this study were conducted between 2002 and 2004, although most took place in 2003. Numerous changes in progress have been studied using this corpus, and, in virtually every case, there have been peaks in apparent time around age 17. This paper introduces a key point of comparison: a newer collection of sociolinguistic interviews, also with native speakers of Toronto English, recorded ten years later in 2012 and 2013. The speakers in this newer corpus are 14–27 years old. For simplicity's sake, we refer to the two corpora as the 2003 and 2013 data. Both corpora are balanced for male and female genders and the age ranges that they each include. The sample also reflects the ethnic diversity of the city. Critically, the speakers in the 2013 data were children and adolescents (4–17 years old) at the time that the 2003 data was recorded. Thus, this combined data allows for a trend study of the same cohort of speakers; we compare the same cohort before reaching the peak of vernacular reorganization and after it.
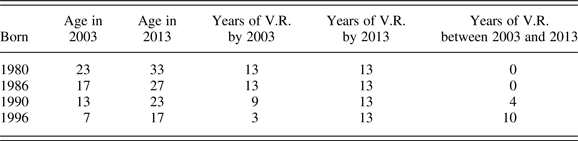
Given Labov's (Reference Labov2001) model, we predict that speakers who were younger than 17 in 2003 (i.e., speakers born after 1986) will show evidence of having gone through vernacular reorganization between 2003 and 2013; however, speakers born in or before 1986 ought to have already stabilized by that time. Therefore, in comparing the 2003 and 2013 data, older speakers should not exhibit any differentiation over time. The specific prediction for quotative be like is that we will observe a discrepancy in the frequency of be like between 2003 and 2013 for speakers born after 1986, but not for those born in or before 1986. This finding would constitute strong, real-time evidence for vernacular reorganization and subsequent stabilization as part of the incrementation of this change in progress. Table 1 makes this explicit. Speakers born in 1986 or earlier will have stabilized in or before 2003, having already completed (all) 13 years of vernacular reorganization. Those younger will have undergone fewer years of vernacular reorganization, but, thereafter, will have continued to augment their rate of be like between 2003 and 2013 before stabilizing around 17 years old. Thus, the younger the speaker was in 2003, the more years of vernacular reorganization they will have had between the times of collection of the two corpora, and, therefore, the larger the discrepancy in the frequency of be like between the 2003 and 2013 data.
Number of years of vernacular reorganization (V.R.) (2003–2013)

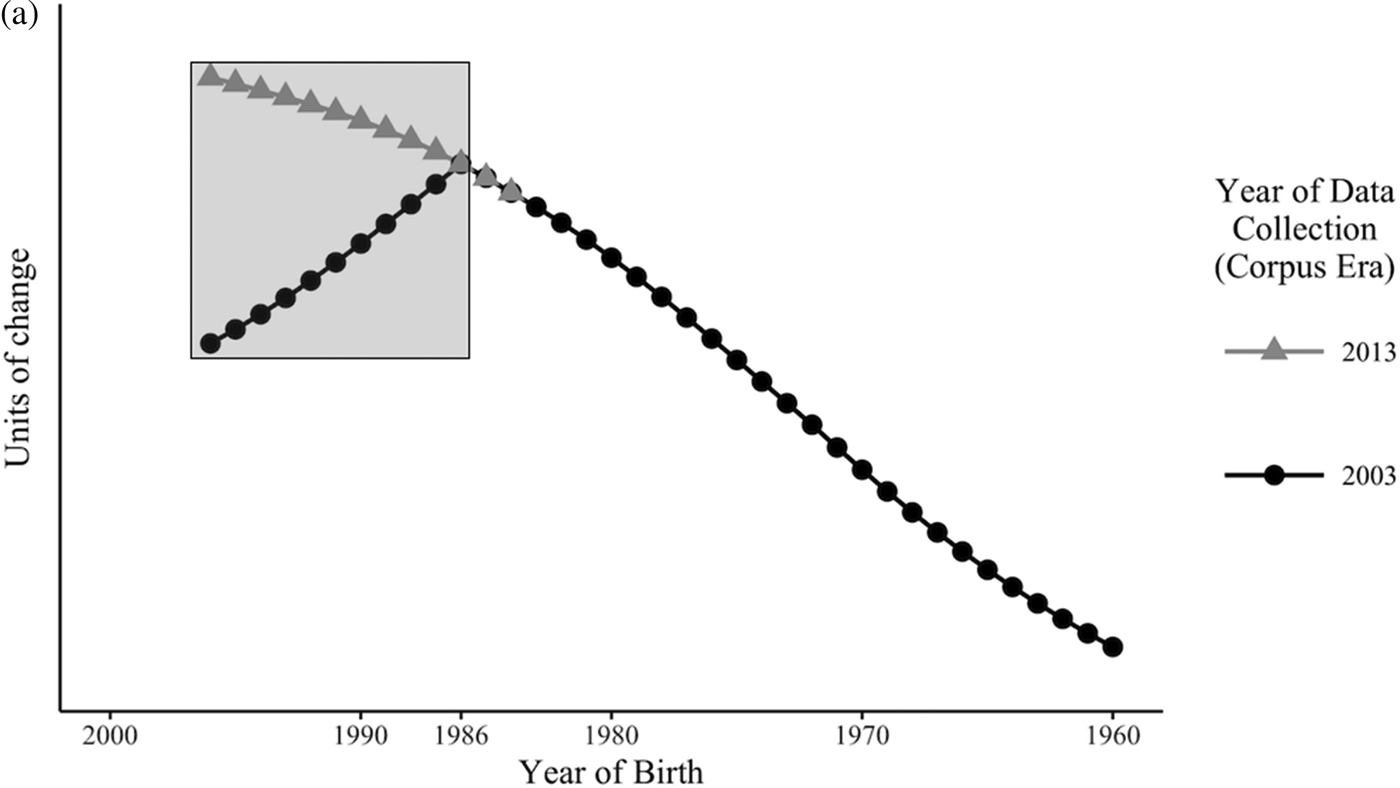
Viewed more abstractly, the model predicts the pattern presented in Figure 3a, wherein an adolescent peak in apparent time for speakers born in 1986 is expected for the 2003 data, and a real-time continuation of the S-shaped curve of change is expected for the 2013 data. While a peak is apt for describing the pattern expected for vernacular reorganization in apparent time, a real-time contrast with speakers born before and after 1986 predicts a different visualization: the younger the speaker, the larger the discrepancy, which will together produce not a peak but rather an ‘arrowhead’ formation (here pointing to the right). Such an arrowhead will only appear under specific conditions, namely, when there is comparable apparent time data from two points in real time from the same community, with the earlier data representing adolescents and the newer data representing that same cohort, now older and into the stabilization period. Our data that includes adolescents in 2003 and young adults in 2013 offers precisely this type of comparison. If vernacular reorganization has occurred in the advancement of be like, we should observe this arrowhead formation when the apparent-time trajectories for the two age cohorts are overlaid in real time (plotted by year of birth, which is static, rather than age, which is constantly changing).
Trajectory of an arbitrary change in progress in real and apparent time (based on Labov, Reference Labov2001). The arrowhead pattern (‘>’) is highlighted by the gray box.

To fully elaborate our predictions, we now compare the three possible explanations for a peak in apparent time. Note the marked differences between Figure 3a (vernacular reorganization) and Figures 3b (retrograde change) and Figure 3c (age-grading). In real time comparison, the three phenomena produce distinct patterns. This confirms Sankoff's (Reference Sankoff, Bayley, Cameron and Lucas2013:265) observation that “[t]he result of […] different processes yielding superficially similar age-related patterns makes all the more crucial the use of real time data.”
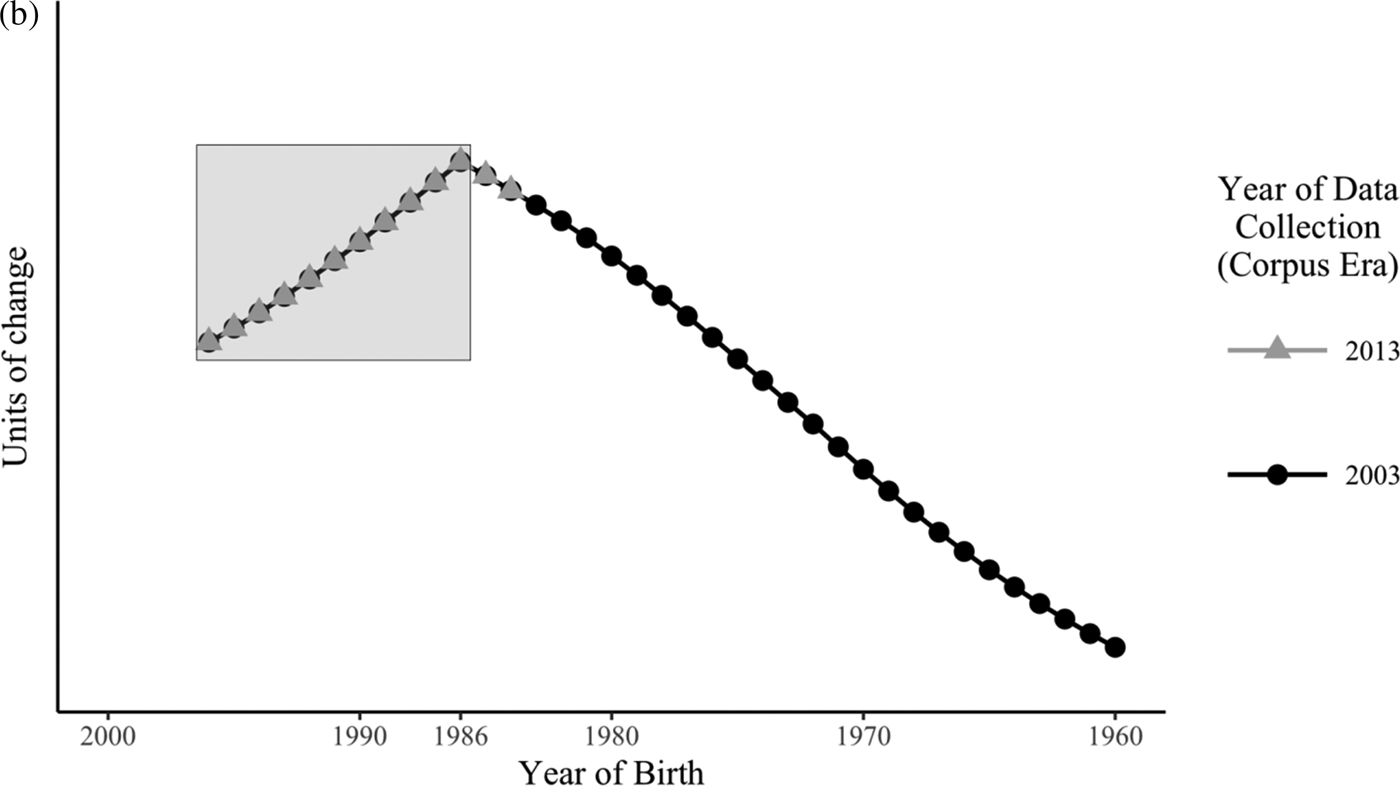
Trajectory for retrograde change in real and apparent time. The overlay pattern is highlighted by the gray box.

Figure 3b shows the ‘overlay’ pattern that would occur if the peak were due to a reversal of the change in progress at a community level. In this case, the 17- to 29-year-olds in 2013 (born between 1984 and 1996) would be predicted to mirror the seven- to 19-year-olds in 2003 (also born between 1984 and 1996). If the peak in 2003 were indicative of retrograde change, then presumably no incrementation would be apparent, and speakers aged 7–19 in 2003 would remain at the same level in 2013, now 17 to 29 years of age.
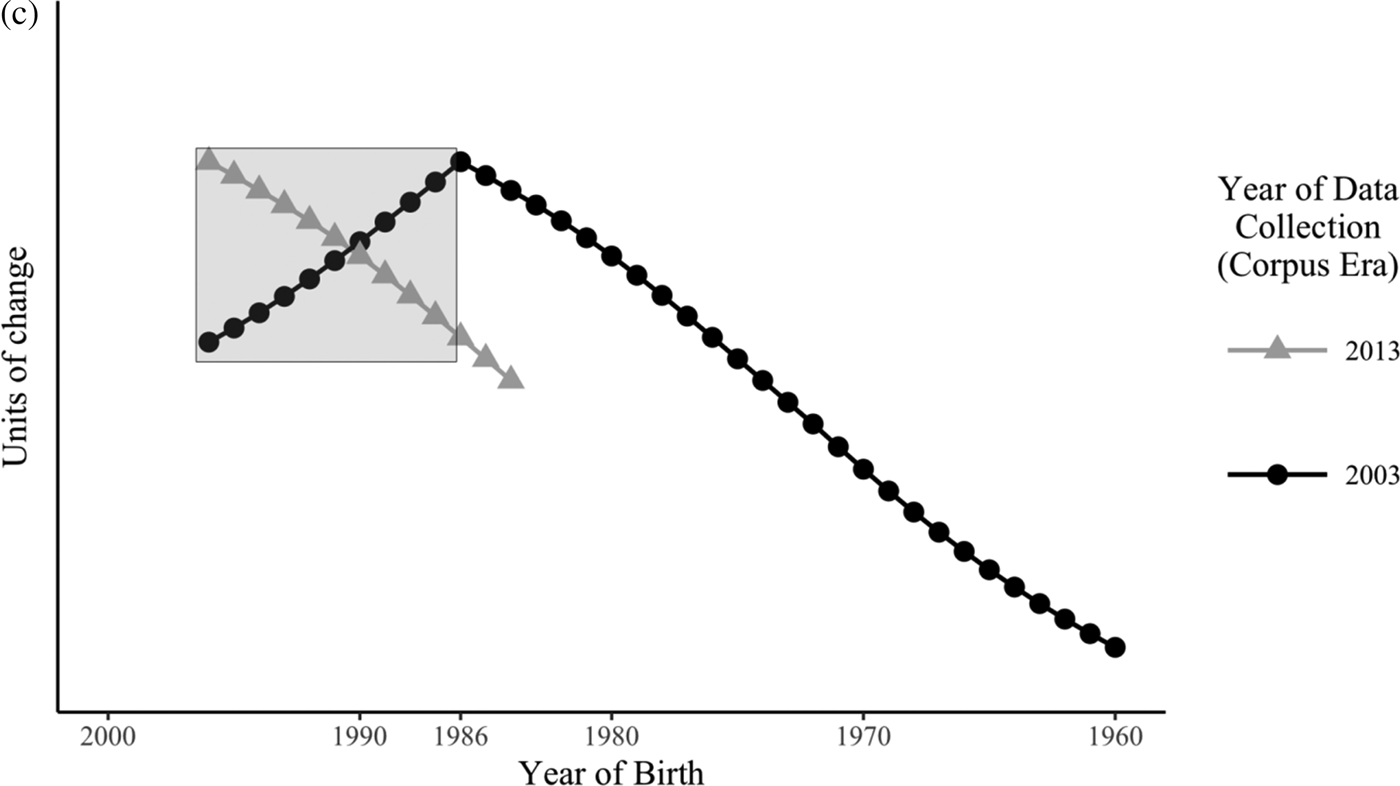
Figures 1, 3a, and 3b assume that there is no change after stabilization (at age 17). As indicated earlier, change in adulthood in the direction of the community can occur (e.g., Sankoff, Reference Sankoff and Brown2006; Sankoff & Blondeau, Reference Sankoff and Blondeau2007; though see also Labov, Rosenfelder, & Fruehwald [Reference Labov, Rosenfeler and Fruehwald2013:39]). In such a context, the gray line in Figures 3a–3b would be higher (for 3a) or lower (for 3b) than the black line where it overlaps for adult speakers.
Figure 3c shows another form of adult change: the ‘crisscross’ pattern that would occur if an adolescent peak were due to age-grading. In this schematization, our 2013 data would not continue the trajectory of those born before 1986 in the 2003 data. Instead, those 17–29 years old in 2013 (born between 1984 and 1996), would echo the behavior observed in those 17–29 years old in 2003 (born between 1986 and 1974), because, for age-grading, as speakers proceed further into adulthood, they use ‘adolescent’ features less frequently, and this pattern repeats for each generation.
Trajectory for age-grading in real and apparent time. The crisscross pattern (‘X’) is highlighted by the gray box.

In sum, if vernacular reorganization in adolescence is the cause of the peak in apparent time that Tagliamonte and D'Arcy (Reference Tagliamonte and D'Arcy2009) found for be like in Toronto, we predict the arrowhead pattern (Figure 3a) rather than the overlay pattern (Figure 3b) or the crisscross pattern (Figure 3c).
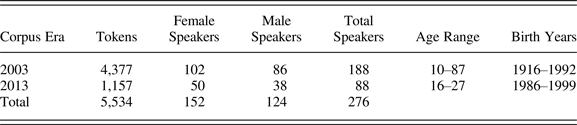
For consistency with earlier research on be like in Toronto, we follow the methodology of Tagliamonte and D'Arcy (Reference Tagliamonte and D'Arcy2004, Reference Tagliamonte and D'Arcy2007) for extracting and coding quotative verbs. All verbs introducing reported speech, be like or otherwise, were extracted and coded to highlight the three main grammatical/discourse contrasts known to constrain quotative variation: the grammatical person of the subject (first person versus third person); the tense morphology and temporal reference of the quotative verb (past tense with past temporal reference [1b] versus present tense with present temporal reference [1a] versus present tense with past temporal reference [i.e., ‘historical present’]); and the type of content of the quotation (internal dialogue/thought versus direct speech).Footnote 8 While these contributing factors are not the focus of this paper, we include them in our statistical modeling as controls in order to factor out their effect from the overall trajectory of change (see Gardner et al. [Reference Gardner, Denis, Brook and Tagliamonte2018] for detailed analysis of these patterns). In total, our analysis includes 5534 quotatives from 276 speakers, as summarized in Table 2. There are slightly more women than men in each corpus, though only about 55% to 45%. The methodological goal of data collection in 2003 was to survey the baseline, middle-class Toronto speech community (Tagliamonte, Reference Tagliamonte2006a). The speakers recorded ten years later were acquaintances of students in a third-year sociolinguistics course taught by the fourth author. The students in this course conducted the sociolinguistic interviews and were instructed to find speakers to match the demographic nature of the 2003 data as closely as possible.
Summary of data

VERNACULAR REORGANIZATION IN REAL TIME
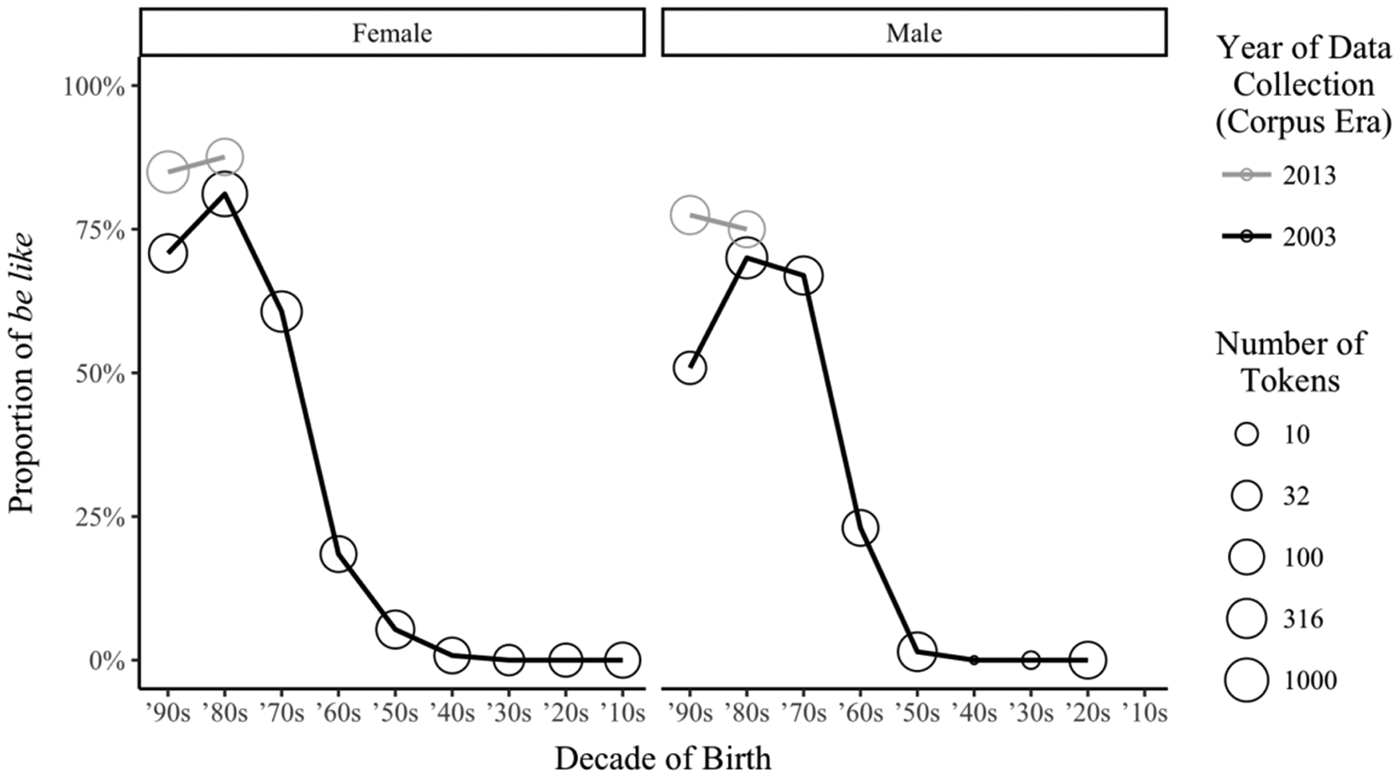
We begin with the overall distribution of be like across apparent time. Figure 4 groups speakers into age cohorts of 10 years based on their year of birth. To probe vernacular reorganization, we consider speakers separately with respect to the era in which they were recorded (2003 versus 2013) and their gender.
Overall distribution of be like by decade of birth, era, and speaker gender.

As Tagliamonte and D'Arcy (Reference Tagliamonte and D'Arcy2009) had already observed, a peak in apparent time is evident among female speakers in the 2003 data; female speakers born in the 1980s, which includes those who were 17 at the time of data collection, exhibit the highest frequency of be like. This is consistent with Labov's (Reference Labov2001) predictions. However, we note two differences from what Labov's (Reference Labov2001) model predicts. First, there is evidence that male speakers undergo vernacular reorganization. Male speakers exhibit a peak in apparent time in the 2003 data (albeit at a lower frequency than their female counterparts), and with the real-time comparison, we observe an arrowhead pattern as in Figure 3a. For those born in the 1980s, the frequency of be like in 2003 and 2013 is nearly identical; however, for those speakers born in the 1990s, the frequency in 2013 is substantially greater than in 2003, indicating vernacular organization occurred.
Second, there is an unexpected decrease in the rate of be like use in apparent time among women recorded in 2013. As with the men, the frequency of be like in 2003 and 2013 for women born in the 1980s is nearly identical, while rates for speakers born in the 1990s is higher in 2013; however, in the 2013 data, be like is less frequent for female speakers born in the 1990s than for speakers born in the 1980s. We predicted that the speakers born in the 1990s should have a higher rate than those born in the 1980s. However, while this does not superficially resemble the expected pattern in Figure 3a, it is still consistent vernacular reorganization under a particular scenario: the very end of the S-curve of change. If the speech community was approaching a point of saturation for be like in the quotative system between 2003 and 2013, the difference between cohorts (here 1980s and 1990s) should decrease and flatten out. Hints of this pattern are visible in Figure 2a.
It is possible that these differences are artifacts of some imbalance in the distribution of tokens across linguistic environments. This is a perennial problem with considering the rate of an incoming variant in naturalistic speech. In order to test whether the observed arrowhead pattern is unlikely due to chance variation but instead reflects change between the two corpora, we turn to (mixed-effects) logistic regression analysis (e.g., Tagliamonte & Baayen, Reference Tagliamonte and Baayen2012). This statistical modeling technique also allows us to control for any uneven distributions of tokens across favoring and disfavoring contexts and the uneven number of tokens each speaker contributes to the data. In our analysis, we test three interrelated hypotheses, focusing only on speakers born from 1986 onward (i.e., the speakers who potentially underwent vernacular reorganization in the ten years between our two corpora). Our first hypothesis is that vernacular reorganization will manifest as a discrepancy in the probability of be like between 2003 and 2013 for speakers born in the same year. In our statistical model, a significant main effect of Era would indicate that this difference is unlikely due to chance.
Our second hypothesis is that this discrepancy will only be observed for women. If Labov's (Reference Labov2001) gender asymmetric model is correct—and the observed peak in apparent time and evidence of vernacular reorganization among male speakers in the distributional analysis above is simply chance variation—there will be a significant discrepancy in the probability between the 2003 and 2013 data for female speakers only. On the other hand, if both male and female speakers are active participants in vernacular reorganization, there will be a significant discrepancy in the probability of be like between the two eras for both male and female speakers. We test this in our statistical model by including a parameter for the interaction between Era and Gender. A significant interaction will indicate that the probability of be like increased for women but not for men between 2003 and 2013. This can be interpreted as an indication that only women participate in vernacular reorganization. A nonsignificant interaction between Era and Gender instead can be interpreted as an indication that both male and female speakers have similar discrepancies in the probability of be like between the 2003 and 2013 data.
Lastly, our third hypothesis is that the direction of the effect of Year of Birth in 2003 and 2013 will be different. In 2003, those born in 1986 (17 years old at the time) will have a higher probability of be like than younger speakers, because they will have undergone more years of vernacular reorganization. In 2013, those born in 1986 will have a lower probability of be like than younger speakers who have continued to increase their rate of the incoming variant since 2003. Thus, a significant interaction between Year of Birth and Era is statistical corroboration of the arrowhead pattern. Again, Labov's (Reference Labov2001) model asserts that male speakers do not undergo vernacular reorganization. If this assertion is correct, we would predict a significant three-way interaction between Era, Year of Birth, and Gender.
We test these hypotheses with mixed-effects logistic regression as implemented in the lme4 package in R (Bates et al., Reference Bates, Maechler, Bolker and Walker2015). The dependent variable is the binary selection of be like or not be like (i.e., other quotative in the variable context). Our model includes the following parameters (or factors/effects/predictors): main fixed effects of Content of the Quotation, Grammatical Person of the Subject, Tense/Temporal Reference, Era, Year of Birth (centered), and Gender; pairwise interactions between Era, Year of Birth, and Gender, and a three-way interaction between Era, Year of Birth, and Gender; and a random intercept of Speaker. The linguistic factors in the model serve as controls as we test our three hypotheses.Footnote 9
We begin with a statistical model that includes all of these parameters (i.e., a full model) in order to determine which of the factors contributes to a statistical, explanatory understanding of the data. To do this, we subject the full model to a Wald χ2 test. This test iteratively adds and removes each parameter of a statistical model, comparing how well each iteration fits the distribution of the data. If a parameter is found to be significant by the Wald χ2 test, it is interpreted as adding explanatory value. If a parameter is not significant, its contribution is interpreted as superfluous to our understanding of the data and can be set aside. The Wald χ2 test, therefore, reveals how to construct the most parsimonious model of the data (i.e., a model that only includes parameters having a statistically significant effect on the variation, or rather, that best fits the distribution of the data). This procedure is similar to the stepping-up/stepping-down procedure in Goldvarb (see Bates et al., Reference Bates, Kliegl, Vasishth and Baayen2015; Matuschek et al., Reference Matuschek, Kliegl, Vasishth, Baayen and Bates2017; Paolillo, Reference Paolillo2002; Tagliamonte, Reference Tagliamonte2006b).
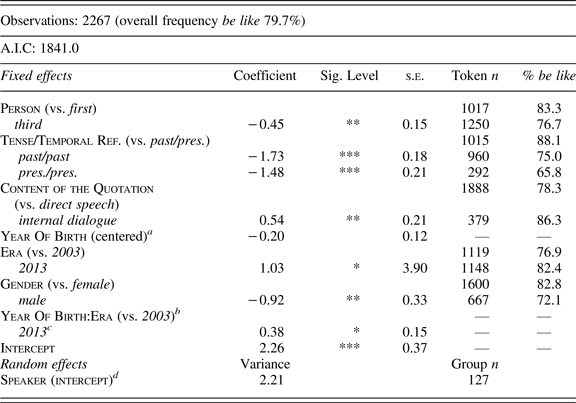
The Wald χ2 test indicates that six factors add explanatory value in modeling the variation (i.e., are statistically significant): Era (χ2 = 6.05, df = 1, p < 0.05), Gender (χ2 = 7.83, df = 1, p < 0.01), Person (χ2 = 9.83, df = 1, p < 0.01), Tense/Temporal Reference (χ2 = 108.73, df = 2, p < 0.001), Content of the Quotation (χ2 = 6.89, df = 1, p < 0.01), and the interaction between Year Of birth and Era (χ2 = 6.43, df = 1, p = 0.01). Four factors are not statistically significant: Year Of Birth (χ2 = 0.90, df = 1, p = 0.34), the interaction between Year Of Birth and Gender (χ2 = 0.27, df = 1, p = 0.60), the interaction between Era and Gender (χ2 = 0.03, df = 1, p = 0.85), and the interaction between Year Of Birth, Era, and Gender (χ2 = 0.40, df = 1, p = 0.53). Given these results the most parsimonious model includes just the main effects of Era, Gender, Person, Tense/Temporal Reference, and Content of the Quotation, plus an interaction between Year of Birth and Era.
Table 3 reports the coefficient for each of the parameters of the model, reported in log-odds, and its significance level (as determined by a Wald χ2 test), along with the standard error of the coefficient, and, for each parameter level (including reference levels), token counts and the proportion of be like in that level. Log-odds are centered around zero; positive log-odds indicate a favoring effect relative to the reference level, while negative log-odds indicate a disfavoring effect relative to the reference level. Categorical parameters are coded using treatment contrast coding: for each categorical parameter, one of the factor levels is treated as a reference level against which the other level(s) is/are compared. This is noted in the table for each factor. Thus, for the parameter Gender (versus female), the male level of the Gender factor is being compared against the reference level (female). The significant p-value indicates that the male level is statistically different from the female level, and the polarity/sign of the coefficient tells us the direction of this difference. In this case, the negative polarity/sign of the coefficient (−0.92) tells us that male speakers have a lower probability of be like than female speakers.
Mixed-effects logistic regression testing the fixed effects of Content of the Quotation, Grammatical Person of the Subject, Tense/Temporal Reference, Era, Year Of Birth (scaled), and Gender, a fixed interaction between Era and Year Of Birth, and a random intercept of Speaker on the realization of quotative be like. Treatment contrast coding; treatment levels are indicated. Model converges with BOBYQA optimizer with < 10 000 iterations. Coefficients reported in log-odds. Correlation of fixed effects r < |0.32|

Notes: * p < .05; ** p <.01; *** p <.001.
amean year of birth = 1989, s.d. = 2.8.
bmean year of birth (2003) = 1987, s.d. = 2.1.
cmean year of birth (2013) = 1991, s.d. = 2.3.
dmean by speaker = 71.5%, s.d. = 30.0%.
Our statistical modeling indicates that our data diverges from the details of Labov's (Reference Labov2001) model vis-à-vis male vernacular reorganization. The interactions between Era and Gender and between Era, Gender, and Year of Birth do not add explanatory value in modeling the variation between be like and other quotatives. As discussed above, if all speakers participate in vernacular reorganization, there should be a significant main effect for Era in our model and a significant interaction between Era and Year of Birth, but no significant interactions between Era and Gender, or between Era, Year of Birth, and Gender. This is exactly what the Wald χ2 test revealed. The most parsimonious model of the data (Table 3) is consistent with predictions that arise from all speakers undergoing vernacular reorganization and inconsistent with the predictions of a gender-asymmetric model.
Table 3 also provides statistical validation of the existence of an arrowhead pattern. Because we use treatment coding contrasts, the coefficient for the main effect of Year of Birth in Table 3 can be interpreted as the apparent-time slope for the 2003 data (the reference level of Era). This coefficient is negative, which tells us that as the year of birth of 2003 speakers increases, the likelihood of be like decreases. To determine the apparent time slope for 2013 (the treatment level of Era), we must add the coefficient of the interaction between Year of Birth and Era (which represents the difference in the effect of Year of Birth between the two levels of Era) to the coefficient for Year of Birth (−0.20 + 0.38 = 0.18). Hence, we have modeled a negative slope for 2003 (−0.20) and a positive slope for 2013 (0.18). This is the arrowhead formation predicted for vernacular reorganization as idealized above in the left half of Figure 3a.
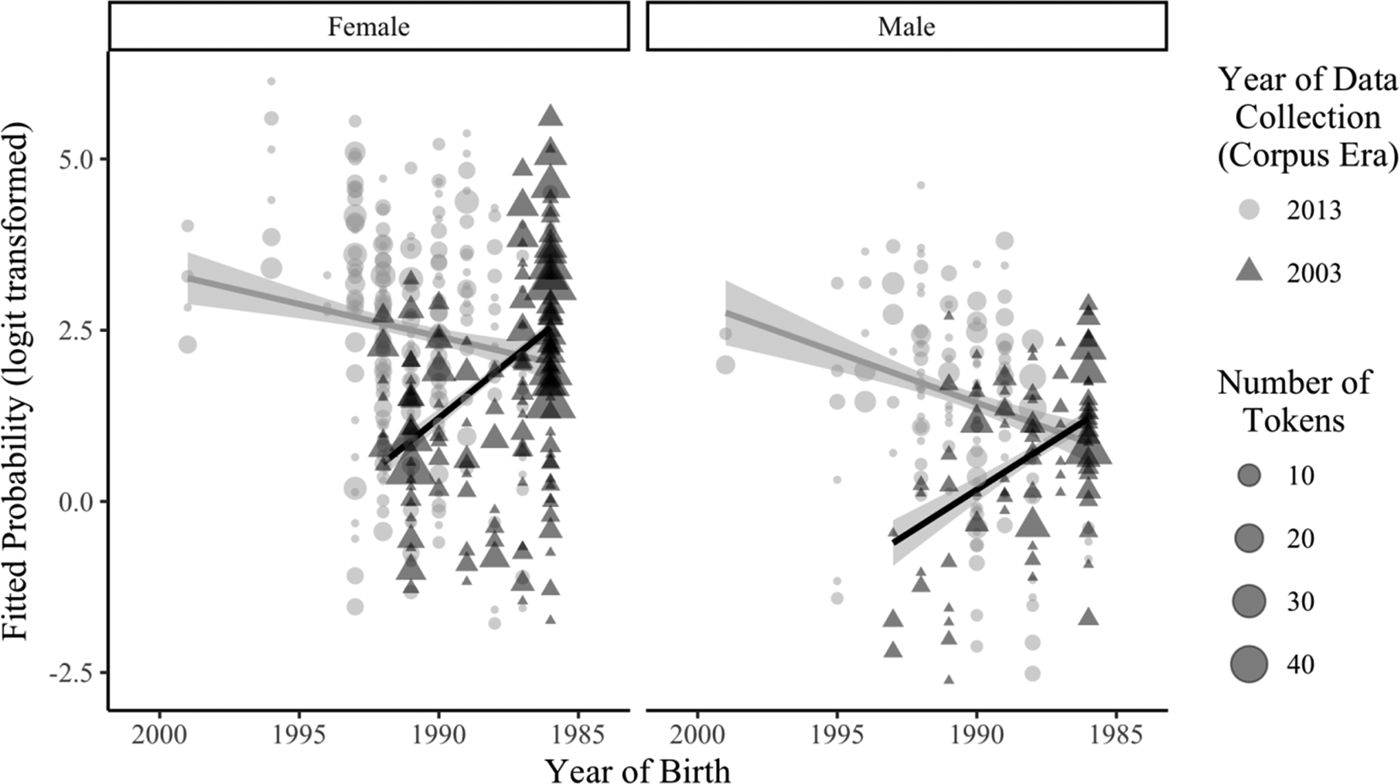
To aid in the understanding and interpretation of this model, we visualize the (logit transformed) fitted probabilities of the model in Figure 5. The probability of be like for each quotative token (converted to log-odds) is plotted by the Year of Birth of its speaker, coded for its value for Era (as dark gray triangles for 2003 and as light gray circles for 2013). Lines of best fit (with confidence intervals) are included to illustrate the interaction between Year of Birth and Era. The data are partitioned by gender to emphasize parallelism and the lack of a three-way interaction between Era, Year of Birth, and Gender.
Fitted probabilities (logit transformed) of be like by Year of Birth, Era, and Speaker Gender.

The ostensible decline in be like use among 1990s females in Figure 4 is not reflected in Figure 5, where we have controlled for the array of internal conditioning factors on quotatives. Among both male and female speakers the probability of be like in the 2003 data decreases as Year of Birth increases, but in the 2013 data the probability of be like increases as Year of Birth increases. In fact, male and female speakers exhibit essentially identical patterns. Any gender difference is therefore quantitative: female speakers have a higher probability of be like than male speakers at every point along the x-axis (as indicated by the significant main effect of Gender in the statistical model) in both 2003 and 2013, but the overall pattern is the same (as indicated by the lack of any significant interaction with Gender). Thus, while women are leading the change towards be like, our results demonstrate that both women and men are advancing this change by participating in vernacular reorganization.
DISCUSSION
How do we reconcile our real-time results with the gender asymmetry of Labov's socially motivated projection model of change? That is, if men undergo vernacular reorganization, how do we explain the male lag in the use of innovations observed here and with many other changes in progress, a lag sometimes as long as a generation? We suggest that the gender asymmetry of linguistic change should be conceived of as a matter of degree, not kind, and thus likely to be more apparent in some changes than others (see also Tagliamonte & D'Arcy, Reference Tagliamonte and D'Arcy2009:97). Indeed, D'Arcy (Reference D'Arcy, Honeybone and Salmons2015) suggested several ways Labov's model can be modified to account for the facts. One option would be to allow the rate of change, r, in the logistic expression in (2) to be set distinctly for women and for men. This would mean that the size of female increments year by year would be larger than those of male speakers of the same age/generation. The social evaluation of variables, their variants, or change itself, for example, may lead to adolescent male or female speakers actively increasing or attenuating their use of an innovation (see, for example, Tagliamonte, Reference Tagliamonte2008:389) leading to differences in r. Setting other components of the logistic expression in (2) differently could also have the same effect. For example, if male and female speakers acquire different baseline variable grammars because speech is modeled differently to children of different sexes assigned at birth by caregivers, then a male lag in the advancement of an innovation may occur (see D'Arcy, Reference D'Arcy, Honeybone and Salmons2015:594; Ely et al., Reference Ely, Gleason, Narasimhan and McCabe1995; Foulkes, Docherty, & Watt, Reference Foulkes, Docherty and Watt2005; Gleason et al., Reference Gleason, Perlmann, Ely, Evans, Sokolov and Snow1994; Reese, Haden, & Fivush, Reference Reese, Haden and Fivush1996). More broadly, apparent gender differences in cognition and/or behavior are often much more readily attributable to differences in socialization than to anything else (see Fine [Reference Fine2010] for an overview). Since language use is a social activity, there is no reason to expect it to deviate from this pattern. Along these lines, Schieffelin and Ochs (Reference Schieffelin and Ochs1986) and Ochs (Reference Ochs, Duranti and Goodwin1992), for instance, investigate language socialization from the standpoint of indexicality. Another possibility is a difference in the length of vernacular reorganization for female and male speakers. Perhaps male speakers, on average, begin vernacular reorganization later or stop sooner than their female counterparts. Thus, the male lag pattern is only one of a range of possible configurations observed in the literature that are consistent with both male and female speakers undergoing vernacular reorganization to at least some extent. These different patterns include a male-led change, a step-wise progression, or a lack of a gender effect, etc. We suggest that the critical factor determining these different patterns is the degree of participation in advancement due to differences in the rate of incrementation, the baseline acquisition of the change, or the length of vernacular reorganization. Furthermore, these three parameters may vary depending on social categories within a community such as social class, ethnicity, rural/urban residency, adolescent social group, etc., in addition to (or instead of) gender. By this account, the group that ends up leading a particular change is the one with the highest rate of incrementation, the highest acquired baseline, the longest period of vernacular reorganization, or any combination of these three. The advantage of this revision of Labov's (Reference Labov2001) basic model of childhood and adolescent vernacular reorganization is that it can be more congruously embedded within diverse sociolinguistic patterns observed for change in progress in different speech communities.
Consider again Figure 5. The arrowhead formation is clear and is a statistically accurate reflection of the data. However, around the lines of best fit in the statistical model is evidence for considerable dispersion, indicating a great deal of individual variability for both men and women. This highlights the fact that so-called male speakers and female speakers are composite groups (inter alia Eckert, Reference Eckert, Gardner, Greeno, Reif and Schoenfeld1990, Reference Eckert2014). Indeed, Labov's (Reference Labov2001:§11.4) proposed resolution to the gender paradox (i.e., that women lead changes from above and from below) was an acknowledgment of the diversity within the macrolevel category of gender: some women lead changes from below (these women also happen to have a higher rate of nonstandard, local features) and some other women lead changes from above. This heterogeneity undoubtedly interacts with the incrementation of change; the settings of the parameters in the logistic function in (2) are necessarily averages across a speech community composed of individuals, some male, some female, some neither; some leaders, some laggards, and some in between. We suggest that, when it comes to gender asymmetry and vernacular reorganization, the reality is more gradient than what the idealization suggests. While we have found that both female and male speakers participate in vernacular reorganization, a more socially realistic version of Labov's model—one in which individuals are subject to variation around idealized means—still allows for the patterns that have been observed here and that have been reported in the literature. Put another way, everybody increments—some more, some less than others. Therefore, gender cannot be the only relevant factor for the advancement of change. Individuals must vary on the parameters of (2) with respect to many other dimensions. While discussion of these demographic, sociological, and social-psychological factors is beyond the scope of this paper, we predict that these factors (and the ways in which they intersect) will correlate with the amount, scope, and extent of change that an individual will make during vernacular reorganization. A longitudinal trend study of several socially differentiated adolescents undergoing vernacular reorganization that considers multiple changes in progress, from different levels of the grammar, would provide new insights into these issues.
CONCLUSIONS
The goal of this paper was to use a real-time trend study to corroborate vernacular reorganization as an omnipresent mechanism of linguistic change. Adolescent peaks in apparent time have previously provided evidence of this process (e.g., Labov, Reference Labov2001; Tagliamonte & D'Arcy, Reference Tagliamonte and D'Arcy2009). While the peak is surely a reflex of incrementation in apparent time, the arrowhead formation we have identified is its counterpart when real-time data is added. We demonstrated this by proposing straightforward statistical hypotheses arising from Labov's (Reference Labov2001) predictions about how vernacular reorganization unfolds. This allowed us to rule out alternative explanations for the peaks in apparent time (namely, age-grading and retrograde change). We predict that the arrowhead formation will appear whenever vernacular reorganization has occurred and appropriate real- and apparent-time data from adolescents and young adults are available. In cases of slow change unfolding over several centuries, the arrowhead may be nearly imperceptible. In cases like be like, which has rapidly reshaped the quotative system of English, the pattern is unmistakable. Given our apparent and real-time findings, Labov's (Reference Labov2001) observations of peaks in apparent time for several sound changes, and Tagliamonte and D'Arcy's (Reference Tagliamonte and D'Arcy2009) observations of adolescent peaks in apparent time for morphosyntactic and discourse-pragmatic changes, we anticipate that the arrowhead formation will manifest for changes at all levels of the grammar. As such studies come to the fore, they will offer further insights into vernacular reorganization and greater precision about how it is that children and adolescents come to speak differently than their caregivers, steadily and continuously moving changes in language forward into the future.