1 Introduction
Cavitation is known to involve a number of small bubbles. The motion of two bubbles is the simplest, but still important, scenario in the dynamics of a multi-bubble system. Therefore, many studies have been conducted to elucidate the dynamics of cavitation bubbles as well as other cavitation-related phenomena from the perspective of their applications in various fields, both theoretically and numerically (e.g. Shima Reference Shima1971; Blake et al. Reference Blake, Robinson, Shima and Tomita1993; Pelekasis & Tsamopoulos Reference Pelekasis and Tsamopoulos1993; Harkin, Kaper & Nadim Reference Harkin, Kaper and Nadim2001; Robinson et al. Reference Robinson, Blake, Kodama, Shima and Tomita2001) and experimentally (Lauterborn & Hentschel Reference Lauterborn and Hentschel1985; Testud-Giovanneschi, Alloncle & Dufresne Reference Testud-Giovanneschi, Alloncle and Dufresne1990; Tomita & Shima Reference Tomita and Shima1990; Tomita, Shima & Sato Reference Tomita, Shima and Sato1990; Jungnickel & Vogel Reference Jungnickel, Vogel, Blake, Boulton-Stone and Thomas1994; Sato, Tomita & Shima Reference Sato, Tomita, Shima and Katz1994; Tomita, Sato & Shima Reference Tomita, Sato, Shima, Blake, Boulton-Stone and Thomas1994; Sato, Tomita & Shima Reference Sato, Tomita, Shima, Michel and Kato1998; Tomita & Sato Reference Tomita, Sato, Balasoiu and Popoviciu2000; Tomita & Kodama Reference Tomita, Kodama, King and Shikhmurzaev2001). Furthermore, the interactions of a single bubble or two bubbles with a free surface (Robinson et al. Reference Robinson, Blake, Kodama, Shima and Tomita2001; Pearson et al. Reference Pearson, Cox, Blake and Otto2004; Gregorčič, Petkovšek & Možina Reference Gregorčič, Petkovšek and Možina2007; Chen et al. Reference Chen, Yu, Su, Chen and Chen2013) have been actively studied, including cases of laser-induced bubbles within axisymmetric liquid jets (Robert et al. Reference Robert, Lettry, Farhat, Monkewitz and Avellan2007) and cavitation bubbles within spherical water masses under low gravity (Obreschkow et al. Reference Obreschkow, Kobel, Dorsaz, de Bosset, Nicollier and Farhat2006). The observation of phenomena such as jet production, jet disintegration and spray formation is of prime interest. When two bubbles oscillate within a defined area, attractive or repulsive bubble migration occurs because of the secondary Bjerknes forces (Crum Reference Crum1975), which are induced by the pressure gradient developed in the liquid surrounding the two bubbles. If two bubbles are generated at different times, the flow pattern around the first bubble is strongly influenced by the motion of the delayed-formation bubble, depending on the initial conditions of the two bubbles.
Fong et al. (Reference Fong, Adhikari, Klaseboer and Khoo2009) and Chew et al. (Reference Chew, Klaseboer, Ohl and Khoo2011) experimentally and numerically studied the interaction between two similar-sized bubbles produced by underwater spark discharge at different positions and times for a wide range of bubble parameters. They mainly changed the dimensionless bubble distance,
 $d^{\prime }$
, and the phase difference in the bubble motion. Consequently, they determined that bubble interactions could be classified into five categories. In particular, they found that strong interactions occurred when
 $0.5<d^{\prime }<1.5$
. In this regime, one of the two bubbles became toroidal while continuing to compress the penetrating part of the other bubble. Finally, separation occurred, creating two smaller bubbles with high curvature tips. The separated tips moved quickly in opposite directions, each containing a fine jet. Very recently, a similar investigation was performed by Han et al. (Reference Han, Köhler, Jungnickel, Mettin, Lauterborn and Vogel2015), who investigated the dynamics of laser-induced bubble pairs of equal millimetre-scale sizes both experimentally and numerically. They focused on the jetting mechanism produced in the second bubble for the two specified bubble-pair conditions of in- and anti-phase. They found that the second bubble produced a fast jet with a peak velocity of approximately 150
 $\text{m}~\text{s}^{-1}$
, whereas the collapse of the first bubble caused the formation of a slow, high mass jet that rapidly transformed into a ring vortex.
Recently, sonoporation has attracted attention as an effective method for drug delivery (e.g. Bao, Thrall & Miller Reference Bao, Thrall and Miller1997). Delivery is usually realised by employing low-intensity ultrasound together with microbubbles. Sonoporation has also been applied in the field of acoustics with high mechanical index values; in this case, inertial cavitation plays a dominant role (Postema et al. Reference Postema, van Wamel, Lancée and de Jong2004; Forbes, Steinberg & O’Brien Reference Forbes, Steinberg and O’Brien2008; Tomita, Matsuura & Kodama Reference Tomita, Matsuura and Kodama2015). One of the known major causes of sonoporation is the impact of a liquid jet produced during the collapse of a cavitation bubble. However, it may be true that for a small single bubble (i.e. with a radius comparable to the cell size), the resultant jet diameter becomes much smaller, of the order of one-tenth of the maximum bubble diameter (Tomita & Shima Reference Tomita and Shima1986; Blake et al. Reference Blake, Keen, Tong and Wilson1999). The potential energy corresponding to this jet impact may be small and unable to cause membrane disruption. To overcome the potential energy shortage, it is necessary to increase the jet velocity. This can be realised in a system of two tandem bubbles. A jet formed in the first generated bubble can collide vertically with the lower surface of the bubble, thereby forming a small pore in the cell membrane. When a single bubble collapses near a biological boundary, the direction of the jet may depend on the dynamic properties of the boundary. Recently, two-dimensional tandem bubbles with cell-sized diameters have been used to demonstrate tandem-bubble sonoporation as a design tool, promoting the effect of sonoporation by cavitation. This technique is expected to yield more benefits in the future (Sankin, Yuan & Zhong Reference Sankin, Yuan and Zhong2010; Tinne et al. Reference Tinne, Schumacher, Nuzzo, Arnold, Lubatschowski and Ripken2010; Yuan, Sankin & Zhong Reference Yuan, Sankin and Zhong2011; Hsiao et al. Reference Hsiao, Choi, Singh, Chahine, Hay, Ilinskii, Zabolotskaya, Hamilton, Sankin, Yuan and Zhong2013; Tinne et al. Reference Tinne, Knoop, Kallweit, Veith, Bleeker, Lubatschowski, Krüger and Ripken2014; Han et al. Reference Han, Köhler, Jungnickel, Mettin, Lauterborn and Vogel2015). Sankin et al. (Reference Sankin, Yuan and Zhong2010) found important evidence that, under some parameter combinations, small pores could be produced in cells, although no poration occurred when a single bubble collapsed at the same bubble stand-off distance.
If a bubble is small and the distance from it to the surrounding boundary surface is sufficiently large compared to the maximum bubble radius, a three-dimensional effect is crucial in determining the flow around the bubble. Some previous studies have addressed two-dimensional jets (Sankin et al. Reference Sankin, Yuan and Zhong2010; Yuan et al. Reference Yuan, Sankin and Zhong2011; Hsiao et al. Reference Hsiao, Choi, Singh, Chahine, Hay, Ilinskii, Zabolotskaya, Hamilton, Sankin, Yuan and Zhong2013), which have substantially different characteristics from three-dimensional jets (Lauterborn & Hentschel Reference Lauterborn and Hentschel1985; Han et al. Reference Han, Köhler, Jungnickel, Mettin, Lauterborn and Vogel2015). From the viewpoint of application to tandem-bubble sonoporation, the precise timing and position of the jet impact that contributes to the perforation of a cell must be known. However, several behavioural aspects of the jets remain unclear; the features of a pulsed jet, consisting of the quasi-confined water between two interacting cavitation bubbles and developing by the rapid growth of the second bubble, must be investigated in more detail.
In the present study, therefore, we use high-speed photography to study tandem-bubble dynamics, including topological and interfacial phenomena. We elucidate a variety of aspects of the jets produced in the first generated bubble, namely the process of jet formation and development and spray formation at the tip of the jet. In addition, we examine the effect of dimensionless interaction parameters on the jet impact velocity, as well as the timing, of a jet impacting the lower surface of the first generated bubble. The dimensionless interaction parameters include the ratio of the two bubble sizes,
 $\unicode[STIX]{x1D709}$
, the distance between the two bubbles,
 $l_{0}^{\ast }$
, and the time difference between the two bubble generations,
 $\unicode[STIX]{x0394}\unicode[STIX]{x1D703}^{\ast }$
.
2 Experiment
2.1 Methods
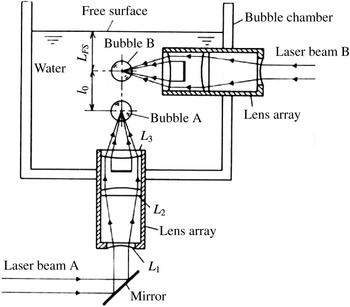
Figure 1 shows a schematic of the principle of the generation of tandem bubbles. A Q-switched twin-pulsed ruby laser (Japan Science Engineering Ltd., NAL-707TS 1) with a pulse width (full width at half-maximum) of 30 ns and a wavelength of 694 nm was used to generate the two bubbles. The bubbles were formed by focusing two laser beams, which were individually radiated from different ruby rod oscillators with diameters of 10 mm. The diameter of each beam was first enlarged to twice the original beam diameter by using a plano-concave lens; the beam was then collimated to obtain a parallel light beam by utilizing a plano-convex lens. After cutting the central part of the beam where the light intensity was high, the remaining annular-shaped laser beam was focused in tap water at a temperature of 293 K and an atmospheric pressure of 101.3 kPa by using an aspherical convex lens with a focal length in air
 $f_{a}=12$
mm. The plain side of the aspherical convex lens was in contact with the water; therefore, its focal length was 16 mm, as obtained from multiplying
 $f_{a}$
by the refractive index of water, 1.33. Because the outside beam diameter at the exit of the aspherical lens was 10 mm, the laser beam was focused into the water at a convergence angle of
 $34.7^{\circ }$
.
Generation of two tandem bubbles.

If the optical energy at the minimum cross-sectional beam area exceeds a threshold value while the laser beam is being applied, liquid breakdown occurs, resulting in the generation of a vapour bubble. The first laser beam (beam A) was fed from the bottom of a rectangular vessel made of stainless steel
 $(240~\text{mm}\times 240~\text{mm}\times 300~\text{mm})$
through a mirror, while the second beam (beam B) was guided to another lens tube from the side. The position of each bubble generation point was controlled by adjusting the length of the lens tube. In the present experiment, laser beam B was focused onto a location far from any free surfaces, thereby realising a situation wherein the two cavitation bubbles behaved like those in an infinite volume of water. We note that the time duration from the moment when power was supplied to the moment when the laser was focused was 845
 $\unicode[STIX]{x03BC}\text{s}$
. Two bubbles were generated in the direction vertical to the free surface. The top bubble was referred to as bubble B, while that below was bubble A; these two bubbles were the so-called tandem bubbles. The timing of the two beam oscillations was adjusted using a digital delay circuit.
Using an image-converter high-speed camera (John Hadland 790), together with a Xe flash lamp (duration: 200
 $\unicode[STIX]{x03BC}\text{s}$
) as a light source, we observed the motion of the two bubbles. Primarily, a framing mode with a rate of 100 000 f.p.s. (frame interval: 10
 $\unicode[STIX]{x03BC}\text{s}$
, exposure time: 2
 $\unicode[STIX]{x03BC}\text{s}~\text{frame}^{-1}$
), was used for the high-speed photography; however, a rate of 500 000 f.p.s. (frame interval: 2
 $\unicode[STIX]{x03BC}\text{s}$
, exposure time: 0.4
 $\unicode[STIX]{x03BC}\text{s}~\text{frame}^{-1}$
) was also used to observe the development of the jet inside bubble A in greater detail. The number of available frames when using this camera was limited to 18. To visualise the insides of the two bubbles more effectively, a diffuser plate was positioned between the light source and the two bubbles.
2.2 Determination of initial conditions and parameters
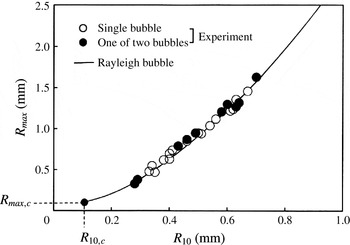
A preliminary experiment, performed by taking many high-speed photographs of single laser-induced bubbles, showed that the laser-induced bubbles behaved in a manner similar to Rayleigh bubbles (see Appendix for details). We define the maximum radius,
 $R_{max,i}$
(
 $i=\text{A}$
or B), of each of the two bubbles as equal to that of a single bubble, assuming that the maximum radius is attained because of the supplied laser energy with no influence from the nearby bubble. If we know the birth time of bubble A and its radius at time
 $t$
measured from the instant of its generation, we can trace the time history of bubble A as a Rayleigh bubble and thereby determine its maximum radius,
 $R_{max,A}$
. We used the time
 $t=10~\unicode[STIX]{x03BC}\text{s}$
, the frame interval at the rate of 100 000 f.p.s., when determining
 $R_{max,A}$
. In addition, we determined the maximum radius,
 $R_{max,B}$
, by assuming that the delayed bubble B grows considerably for 10
 $\unicode[STIX]{x03BC}\text{s}$
after its birth without influence from the nearby bubble A.
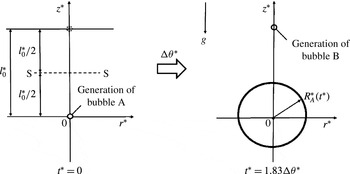
Initial conditions and parameters. Bubble size ratio
 $\unicode[STIX]{x1D709}=R_{max,B}/R_{max,A}$
(
 $R_{max,A}$
,
 $R_{max,B}$
: maximum radii of bubbles A and B, respectively); distance between the two bubbles
 $l_{0}^{\ast }=l_{0}/(R_{max,A}+R_{max,B})$
(
 $l_{0}$
: initial bubble distance); time difference in bubble generation
 $\unicode[STIX]{x0394}\unicode[STIX]{x1D703}^{\ast }=\unicode[STIX]{x0394}T/T_{A}$
(
 $\unicode[STIX]{x0394}T$
: time difference between the two bubble generations,
 $T_{A}$
: period of bubble A). S–S indicates the virtual centre line between the two bubbles.

We now introduce the three dimensionless parameters:
 $$\begin{eqnarray}\displaystyle \unicode[STIX]{x1D709}=R_{max,B}/R_{max,A},\quad l_{0}^{\ast }=l_{0}/(R_{max,A}+R_{max,B}),\quad \unicode[STIX]{x0394}\unicode[STIX]{x1D703}^{\ast }=\unicode[STIX]{x0394}T/T_{A}, & & \displaystyle\end{eqnarray}$$
where
 $\unicode[STIX]{x1D709}$
is the bubble size ratio;
 $l_{0}^{\ast }$
is the dimensionless bubble distance with
 $l_{0}$
being the initial distance between the two bubbles; and
 $\unicode[STIX]{x0394}\unicode[STIX]{x1D703}^{\ast }$
is the dimensionless time difference defined as the time difference between the two bubble generations,
 $\unicode[STIX]{x0394}T$
, divided by the period of bubble A,
 $T_{A}$
, when bubble A is free of influence from the nearby bubble B. Figure 2 shows a schematic of the definitions of the initial conditions and parameters of the two bubbles. The birth point of bubble A is taken as the origin in the system of the two bubbles, and
 $g$
is the gravitational acceleration, directed downward. S–S indicates the centre line of
 $l_{0}$
, expressing a virtual boundary, either a solid wall or a free surface, which would be located at
 $l_{0}/2$
in the case where a single bubble is near a boundary. From (2.1), it is readily seen that when
 $\unicode[STIX]{x0394}T=0$
and
 $\unicode[STIX]{x0394}T=T_{A}$
, we obtain
 $\unicode[STIX]{x0394}\unicode[STIX]{x1D703}^{\ast }=0$
and 1, respectively. These solutions imply that the two bubbles are in phase. In contrast, when bubble B is generated at
 $\unicode[STIX]{x0394}T=T_{A}/2$
, we obtain
 $\unicode[STIX]{x0394}\unicode[STIX]{x1D703}^{\ast }=0.5$
. In this situation, the two bubbles are out of phase. In both cases, if the two bubbles are identical in size, namely
 $\unicode[STIX]{x1D709}=1$
, the dimensionless bubble distance
 $l_{0}^{\ast }$
becomes
 $l_{0}/(2R_{max})$
. Substituting
 $L=l_{0}/2$
yields the relation
 $l_{0}^{\ast }=\unicode[STIX]{x1D6FE}(=L/R_{max})$
, where
 $\unicode[STIX]{x1D6FE}$
is the stand-off parameter with respect to a single bubble, near either a solid boundary or a free surface (Naudé & Ellis Reference Naudé and Ellis1961; Blake & Gibson Reference Blake and Gibson1981; Tomita & Shima Reference Tomita and Shima1986; Blake & Gibson Reference Blake and Gibson1987; Vogel, Lauterborn & Timm Reference Vogel, Lauterborn and Timm1989). The period of an isolated bubble,
 $T_{i}$
, is twice the Rayleigh collapse time,
 $t_{R,i}$
(Rayleigh Reference Rayleigh1917), as expressed by
 $$\begin{eqnarray}\displaystyle T_{i}=2t_{R,i}=1.83R_{max,i}(\unicode[STIX]{x1D70C}/\unicode[STIX]{x0394}p)^{1/2}\quad (i=\text{A}\text{ or }\text{B}), & & \displaystyle\end{eqnarray}$$
where
 $\unicode[STIX]{x1D70C}$
is the density of water and
 $\unicode[STIX]{x0394}p$
(
 $=p_{\infty }-p_{v}$
) is the pressure difference between the inside and outside of the bubble, with
 $p_{\infty }$
being the hydrostatic pressure and
 $p_{v}$
being the saturated vapour pressure inside the bubble. At a temperature of 293 K in tap water and an atmospheric pressure
 $p_{\infty }$
of 101.3 kPa, the physical constants are
 $\unicode[STIX]{x1D70C}=998.2~\text{kg}~\text{m}^{-3}$
and
 $p_{v}=2.3$
kPa, yielding
 $\unicode[STIX]{x0394}p=99$
kPa. Therefore, we obtain the expression
 $T_{i}=183.8R_{max,i}$
, where
 $T_{i}$
(in microseconds) is the period for an isolated bubble,
 $R_{max,i}$
(in millimetres) is the maximum radius of bubble
 $i$
and the number 183.8 has the units of microseconds/millimetres. Using (2.2) and taking
 $R_{max,A}$
as our length scale with
 $t$
being time, the dimensionless time,
 $t^{\ast }$
, is defined as
 $$\begin{eqnarray}\displaystyle t^{\ast }=\frac{t}{R_{max,A}}\sqrt{\frac{\unicode[STIX]{x0394}p}{\unicode[STIX]{x1D70C}}}=\frac{1.83t}{T_{A}}. & & \displaystyle\end{eqnarray}$$
Furthermore, the dimensionless jet velocity,
 $V_{j}^{\ast }$
, is expressed as the jet velocity
 $V_{j}$
divided by the characteristic velocity (
 $\unicode[STIX]{x0394}p$
/
 $\unicode[STIX]{x1D70C}$
)
 $^{1/2}$
, namely
 $$\begin{eqnarray}\displaystyle V_{j}^{\ast }=\frac{V_{j}}{\sqrt{\unicode[STIX]{x0394}p/\unicode[STIX]{x1D70C}}}. & & \displaystyle\end{eqnarray}$$
3 Results and discussion
First, we examine the overall motion of two interacting cavitation bubbles for
 $l_{0}^{\ast }\leqslant 1$
, mainly focusing on the deformation of bubble A, because preliminary experiments indicated that no penetration of bubble B into bubble A occurred for any data in the range
 $l_{0}^{\ast }>1$
. Next, we address the aspects of the two types of jets produced in both bubble A and bubble B, each of which develops in opposing directions. Especially, we investigate the characteristics of the jet formed in bubble A, which affect the perforation effect in tandem-bubble sonoporation.
3.1 Overall motion of two interacting bubbles
In this section, we study the overall motion of two bubbles for
 $l_{0}^{\ast }\leqslant 1$
, focusing on the deformation of the upper surface of bubble A, which is definitely affected by the fluid motion induced by bubble B. Selected results are shown and discussed for the two categories of bubble interaction, i.e. weak and strong interactions, between two bubbles.
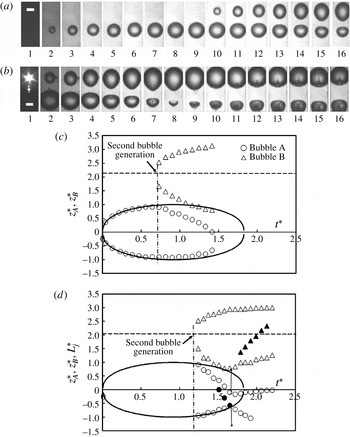
Weak interaction between two similar-sized tandem bubbles A and B with the same dimensionless bubble distance,
 $l_{0}^{\ast }=1.0$
: influence of the birth-time difference of the two bubbles on their mutual interaction. Panels (
 $a$
) and (
 $b$
) are high-speed photographs of the two bubbles and (
 $c$
) and (
 $d$
) the time variations of the upper and lower surfaces of the bubbles. The parameters in (
 $a$
) and (
 $c$
) are as follows:
 $\unicode[STIX]{x1D709}=1.2$
(
 $R_{max,A}=1.1$
mm,
 $R_{max,B}=1.3$
mm),
 $\;l_{0}^{\ast }=1.0$
(
 $l_{0}=2.5$
mm) and
 $\unicode[STIX]{x0394}\unicode[STIX]{x1D703}^{\ast }=0.4$
(
 $T_{A}=202~\unicode[STIX]{x03BC}\text{s}$
,
 $\unicode[STIX]{x0394}T=80~\unicode[STIX]{x03BC}\text{s}$
). In (
 $b$
) and (
 $d$
), the parameters are
 $\unicode[STIX]{x1D709}=1.0$
(
 $R_{max,A}=1.5$
mm,
 $R_{max,B}=1.5$
mm),
 $l_{0}^{\ast }=1.0$
(
 $l_{0}=2.9$
mm) and
 $\unicode[STIX]{x0394}\unicode[STIX]{x1D703}^{\ast }=0.65$
(
 $T_{A}=267~\unicode[STIX]{x03BC}\text{s}$
,
 $\unicode[STIX]{x0394}T=170~\unicode[STIX]{x03BC}\text{s}$
). Frame 1 in (
 $a$
) corresponds to
 $-0.043$
, and frame 1 in (
 $b$
) corresponds to 1.17. In addition, the dimensionless inter-frame times, corresponding to 10
 $\unicode[STIX]{x03BC}\text{s}$
, are 0.0859 and 0.0687 in (
 $a$
) and (
 $b$
), respectively. The pair of solid lines in (
 $c$
) and (
 $d$
) denotes the theoretical results obtained by assuming Rayleigh-like behaviour of the isolated bubble A. ○: bubble A; ▵: bubble B. The white scale bars in (
 $a$
) and (
 $b$
) denote 1 mm.

3.1.1 Weak interaction without bubble penetration
Figure 3 shows two examples of the overall bubble motion, indicating weak interactions between two similar-sized tandem bubbles produced at different times and the same dimensionless bubble distance,
 $l_{0}^{\ast }=1.0$
, where no bubble penetration, specifically of bubble B into bubble A, occurred. In panels (
 $a$
) and (
 $b$
), 16 high-speed photographs are presented temporally from the left. Panels (
 $c$
) and (
 $d$
) show the time variations of the dimensionless upper and lower bubble surface positions along the central axis of the two bubbles, measured from the birth point of bubble A, namely
 $z_{A}^{\ast }$
and
 $z_{B}^{\ast }$
, which are depicted using an open circle (○) for bubble A and an open triangle (▵) for bubble B. The pair of solid lines represents the theoretical results obtained by assuming that bubble A behaves like a Rayleigh bubble. As depicted in (
 $c$
), the time evolutions of the upper and lower surfaces of bubble A in (
 $a$
) agree well with the calculations for an isolated Rayleigh bubble before interaction with bubble B; however, after bubble B is generated, the upper surface of bubble A is gradually flattened, taking a shorter path to approach its minimum volume compared to the Rayleigh bubble. This shifts the centroid of bubble A downward. In contrast, bubble B changes in shape, becoming elongated with a bullet-shaped tip. A liquid jet is seen in bubble A in case (
 $b$
). This jet impacts the lower surface of bubble A at a velocity of
 $-44~\text{m}~\text{s}^{-1}$
(or the dimensionless jet velocity
 $V_{j,A}^{\ast }=-4.4$
). Afterward, a toroidal bubble A is generated, reaching a minimum volume between frames 8 and 9. In panel (
 $d$
), the positions of the upper surfaces of bubble A along the central axis are depicted using open circles (○) before jet formation and solid circles (●) after jet formation. We note that the open circles used in (
 $d$
) after jet formation do not indicate the positions of the upper surfaces of bubble A along the central axis, but instead the highest positions of the surfaces as viewed from the side; these points may be located somewhere off the central axis. The time variations of the jet tip locations,
 $L_{j}^{\ast }$
, formed inside both bubbles are plotted using the symbols (●) and (▴) for bubbles A and B, respectively. Immediately after the toroidal bubble A rebounds, shock waves may be emitted outward, as illustrated by the conjectured dashed lines in panel (
 $d$
). We could not capture shock waves or pressure waves in the present experiment because diffused light was used to visualise the flow field. However, we observe several small bubbles near the lower surface of bubble B in the ninth frame, which must be formed by secondary cavitation (Gibson Reference Gibson1968; Tomita, Kodama & Shima Reference Tomita, Kodama and Shima1991) as a consequence of shock wave interactions with the lower surface of bubble B. The liquid particle velocity
 $V_{p}$
behind a shock wave is expressed as
 $V_{p}\approx p_{sw}/\unicode[STIX]{x1D70C}c$
, where
 $p_{sw}$
is the shock wave pressure. A maximum velocity of
 $2V_{p}$
is attained at the bottom of the surface of bubble B because of the shaped charge effect (Tulin Reference Tulin1969; Dear & Field Reference Dear and Field1988). Combining the radial flow induced by the rebound of the toroidal bubble A with the flow from the shock wave interaction, a fine jet is created inside bubble B, moving upward at a velocity of 32
 $\text{m}~\text{s}^{-1}$
. Under the conditions
 $l_{0}^{\ast }\geqslant 1$
and
 $0.15<\unicode[STIX]{x0394}\unicode[STIX]{x1D703}^{\ast }<0.8$
, jets are produced inside both bubbles, although no penetration of bubble B into bubble A occurs for any bubble size ratio
 $\unicode[STIX]{x1D709}$
.
3.1.2 Strong interaction with bubble penetration
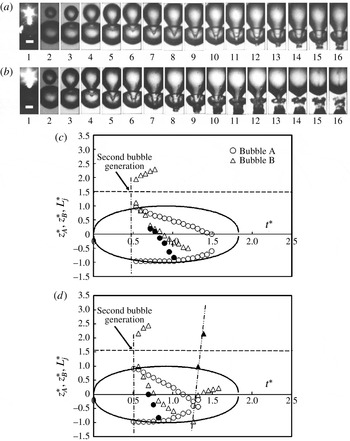
A strong interaction between two bubbles often leads to the phenomenon of bubble penetration, as shown in figure 4, where the birth time differences,
 $\unicode[STIX]{x0394}\unicode[STIX]{x1D703}^{\ast }$
, are close to each other, i.e. 0.26 in (
 $a$
) and 0.28 in (
 $b$
). The two cases differ significantly in bubble size ratio, i.e. (
 $a$
)
 $\unicode[STIX]{x1D709}=1.0$
and (
 $b$
)
 $\unicode[STIX]{x1D709}=1.4$
. Thus, the upper surface of bubble A is notably deformed before the bubble reaches its maximum volume. In contrast, the lower surface of bubble A varies with time in a manner similar to that of a Rayleigh bubble, even after interaction with the delayed bubble B. During the early growth period of bubble B, a conical mass of water, accelerated by the elongated bubble B, moves downward to create a jet within bubble A. In frame 7 in 4(
 $a$
), we observe the existence of a weak spray at the tip of the conical jet, which collides with the downward surface of bubble A at a velocity of
 $-34~\text{m}~\text{s}^{-1}$
(i.e.
 $V_{j,A}^{\ast }=-3.4$
). The locus of the tip of the conical water mass, or the pulsed liquid jet consisting of a quasi-confined volume of water between the lower surface of bubble B and the upper surface of bubble A, is plotted using a solid circle (●) in (
 $c$
) (aspects of the jets formed in bubble A are discussed in more detail in § 3.2.1). Observing the lower surface of bubble A carefully, we can see an apparent projection in frame 11, which may be a vortex ring formed by the circulation of the liquid pushed forward after the jet impact (Tong et al.
Reference Tong, Schiffers, Shaw, Blake and Emmony1999). Afterwards, the toroidal bubble A collapses, allowing the portion of bubble B that penetrated bubble A to be compressed rapidly.
Strong interaction between two bubbles causing notable bubble deformation followed by jet impact under the condition
 $l_{0}^{\ast }<1.0$
, where bubble penetration occurs. The second bubble is generated at the dimensionless times
 $t^{\ast }$
of 0.48 in (
 $a$
) and 0.50 in (
 $b$
). Panels (
 $a$
) and (
 $b$
) are high-speed photographs of the two bubbles and (
 $c$
) and (
 $d$
) are the time variations of the upper and lower surfaces of each bubble A and B. Parameters are given as
 $\unicode[STIX]{x1D709}=1.0$
(
 $R_{max,A}=1.7$
mm,
 $R_{max,B}=1.7$
mm),
 $l_{0}^{\ast }=0.74$
(
 $l_{0}=2.5$
mm) and
 $\unicode[STIX]{x0394}\unicode[STIX]{x1D703}^{\ast }=0.26$
(
 $T_{A}=307~\unicode[STIX]{x03BC}\text{s}$
,
 $\unicode[STIX]{x0394}T=80~\unicode[STIX]{x03BC}\text{s}$
) in (
 $a$
) and (
 $c$
). In (
 $b$
) and (
 $d$
), they are given as
 $\unicode[STIX]{x1D709}=1.4$
(
 $R_{max,A}=1.6$
mm,
 $R_{max,B}=2.3$
mm),
 $l_{0}^{\ast }=0.64$
(
 $l_{0}=2.5$
mm) and
 $\unicode[STIX]{x0394}\unicode[STIX]{x1D703}^{\ast }=0.28$
(
 $T_{A}=290~\unicode[STIX]{x03BC}\text{s}$
,
 $\unicode[STIX]{x0394}T=80~\unicode[STIX]{x03BC}\text{s}$
). Frame 1 in (
 $a$
) corresponds to 0.48 and that in (
 $b$
) corresponds to 0.50 (in each case, bubble B is generated 80
 $\unicode[STIX]{x03BC}\text{s}$
after the generation of bubble A). In addition, the dimensionless inter-frame times corresponding to 10
 $\unicode[STIX]{x03BC}\text{s}$
are 0.0596 in (
 $a$
) and 0.0630 in (
 $b$
). The pair of solid lines in (
 $c$
) and (
 $d$
) denotes the theoretical results obtained by assuming that the isolated bubble A behaves like a Rayleigh bubble. ○: bubble A; ▵: bubble B; ●: jet in bubble A; ▴: jet in bubble B. The chained line with one dot in (
 $d$
) indicates the path of movement from the lowest position of bubble B to the tip of the fine jet within bubble B. The white scale bars in (
 $a$
) and (
 $b$
) denote 1 mm.

On the other hand, (
 $b$
) depicts the case of a larger bubble size ratio,
 $\unicode[STIX]{x1D709}=1.4$
, which corresponds to an individual laser energy ratio,
 $E_{B}/E_{A}$
, of approximately 3. Accordingly, bubble B grows more rapidly compared with that in (
 $a$
) and the water located between the two bubbles acquires greater momentum, which is sufficient to dent the surface of bubble A very quickly. In frame 4, the distance between the lower edge of bubble B and the tip of the conical water mass becomes clear, and a weak spray is formed at the crest of the tip in frame 5. The tip of the jet impacts the lower surface of bubble A at a speed of
 $-72~\text{m}~\text{s}^{-1}$
(i.e.
 $V_{j,A}^{\ast }=-7.2$
). As clearly seen in frames 11 and 12, the toroidal bubble A collapses further with great surface disturbance before it rebounds. A portion of bubble B is compressed by the force from the collapse of toroidal bubble A. This portion moves upward with a velocity of approximately
 $240~\text{m}~\text{s}^{-1}$
(i.e.
 $V_{j,B}^{\ast }=24$
), as seen in frames 13 and 14.
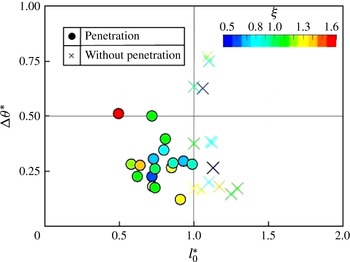
Bubble penetration region on the (
 $l_{0}^{\ast }$
,
 $\unicode[STIX]{x0394}\unicode[STIX]{x1D703}^{\ast }$
) diagram as a parameter of bubble size ratio,
 $\unicode[STIX]{x1D709}$
, where bubble B penetrated into the interior of bubble A and contracted rapidly after the rebound of the toroidal bubble A. This corresponds to the ‘catapult’ domain defined by Fong et al. (Reference Fong, Adhikari, Klaseboer and Khoo2009). By squeezing the lower part of bubble B, the tip of the bubble is rapidly compressed and moved upward during the short period from the collapse to the rebound of the toroidal bubble A. Each symbol ● and
 $\times$
denotes a case with or without penetration, respectively. The gradations of colour in the experimental values correspond to individual data with different bubble size ratios,
 $\unicode[STIX]{x1D709}$
.

3.1.3 Bubble penetration regime
The bubble penetration regime is shown in figure 5, where solid symbols (●) denote the cases where bubble penetration occurs, and the cross symbols
 $(\times )$
represent the cases where no penetration occurs. The gradation of colour corresponds to each value of the parameter
 $\unicode[STIX]{x1D709}$
, varying with a step of 0.1. Although the (
 $l_{0}^{\ast }$
,
 $\unicode[STIX]{x0394}\unicode[STIX]{x1D703}^{\ast }$
) diagram is incompletely drawn, we note that no data showing bubble penetration occur in the region of
 $\unicode[STIX]{x0394}\unicode[STIX]{x1D703}^{\ast }>$
0.6, where bubble B is generated during the collapse phase of bubble A. It is recognised that, in the application of tandem-bubble sonoporation, the lower surface of bubble A may form a contact with the cell membrane at the maximum bubble volume. However, if bubble B is generated with the condition
 $\unicode[STIX]{x0394}\unicode[STIX]{x1D703}^{\ast }>0.5$
, jet impact occurs during a certain stage in the collapse of bubble A. Therefore, if a cell is present, the lower surface of bubble A may become detached from the cell membrane before the jet impact. Afterward, the jet must move downward with a decelerated velocity through the water layer. This situation may be disadvantageous to pore production in the cell membrane. Clearly there is a threshold dimensionless bubble distance, i.e.
 $l_{0}^{\ast }=1.0$
, below which bubble penetration can occur. In the region where
 $l_{0}^{\ast }<1.0$
, the occurrence range of bubble penetration is affected by the birth-time difference between two bubbles,
 $\unicode[STIX]{x0394}\unicode[STIX]{x1D703}^{\ast }$
, depending on the bubble size ratio
 $\unicode[STIX]{x1D709}$
. When
 $\unicode[STIX]{x1D709}\leqslant 1$
, bubble penetration occurs for
 $\unicode[STIX]{x0394}\unicode[STIX]{x1D703}^{\ast }>0.2$
, whereas when
 $\unicode[STIX]{x1D709}>1$
, the lower limit of
 $\unicode[STIX]{x0394}\unicode[STIX]{x1D703}^{\ast }$
allowing bubble penetration is reduced;
 $\unicode[STIX]{x0394}\unicode[STIX]{x1D703}^{\ast }=0.12$
when
 $\unicode[STIX]{x1D709}=1.3$
. Notably, the range of
 $l_{0}^{\ast }<1.0$
for bubble penetration agrees well with the ‘catapult’ domain for
 $\unicode[STIX]{x1D709}\approx 1$
, as reported by Fong et al. (Reference Fong, Adhikari, Klaseboer and Khoo2009). If
 $\unicode[STIX]{x1D709}$
is much larger than unity and two bubbles are produced with a low value of
 $l_{0}^{\ast }$
, bubble penetration can occur even for
 $\unicode[STIX]{x0394}\unicode[STIX]{x1D703}^{\ast }>0.5$
; however, in this regime of
 $\unicode[STIX]{x0394}\unicode[STIX]{x1D703}^{\ast }$
, the confined mass of water that forms the pulsed jet would be entirely transformed into mist (see § 3.2.1.1).
3.2 Aspects of two types of jets produced in different directions
As shown in § 3.1, two types of jets with different directions can be formed in tandem bubbles produced at different times, depending on the combination of the three parameters
 $\unicode[STIX]{x1D709}$
,
 $l_{0}^{\ast }$
and
 $\unicode[STIX]{x0394}\unicode[STIX]{x1D703}^{\ast }$
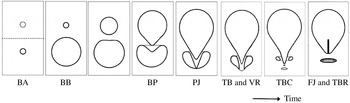
. In this section, we address the various aspects of these two types of jets. In particular, we focus on jets formed in the bubble produced first (bubble A) in § 3.2.1, because this type of jet is expected to be applied in tandem-bubble sonoporation. In contrast, jets formed in the second produced bubble (bubble B) are discussed briefly in § 3.2.2, because details on these jets were reported in depth by Han et al. (Reference Han, Köhler, Jungnickel, Mettin, Lauterborn and Vogel2015). For a strong interaction in the system of two tandem bubbles, a series of phenomena, such as bubble penetration (BP), pulsed conical jet in bubble A (PJ), toroidal bubble (TB), vortex rings (VR) and fine jet in bubble B (FJ), are sequentially captured; a typical schematic is shown in figure 6.
Sequential schematic of strong bubble interaction. BA: bubble A generation, BB: bubble B generation, BP: bubble penetration, PJ: pulsed jet impact, TB and VR: toroidal bubble with vortex ring, TBC: toroidal bubble collapse, FJ and TBR: fine jet formation and toroidal bubble rebound.

3.2.1 Jets formed in the first produced bubble
When the upper surface of bubble A is non-spherically deformed according to the fluid motion induced by the growth of the delayed bubble B, a jet forms that impacts the lower surface of bubble A. This type of jet occurs in situations where
 $l_{0}^{\ast }<1$
and
 $l_{0}^{\ast }\geqslant 1$
as demonstrated in § 3.1. For the short bubble distance
 $l_{0}^{\ast }<1$
, under the condition of
 $\unicode[STIX]{x0394}\unicode[STIX]{x1D703}^{\ast }<0.5$
, a conical jet can be produced. This contains a water spike at the tip followed by water flow passing through an annular water passage caused by bubble penetration. The water mass of this jet is often confined because of the presence of the nearby bubble B; here, it is called a pulsed jet. The formation mechanism of this jet differs from that produced in a single bubble collapsing near a solid wall, in which plenty of liquid particles initially located on the bubble surface gather in a water region near the far side bubble surface, opposite the solid wall, creating a jet directed toward the solid wall during the later stages of the collapse (Blake & Gibson Reference Blake and Gibson1987).
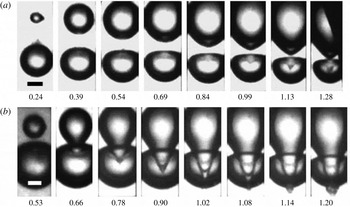
Developments of jets generated in bubble A: (
 $a$
)
 $\unicode[STIX]{x1D709}=1.3$
(
 $R_{max,A}=1.3$
mm,
 $R_{max,B}=1.7$
mm),
 $l_{0}^{\ast }=0.91$
(
 $l_{0}=2.8$
mm), and
 $\unicode[STIX]{x0394}\unicode[STIX]{x1D703}^{\ast }=0.12$
(
 $T_{A}=245~\unicode[STIX]{x03BC}\text{s}$
,
 $\unicode[STIX]{x0394}T=30~\unicode[STIX]{x03BC}\text{s}$
); (
 $b$
)
 $\unicode[STIX]{x1D709}=1.3$
(
 $R_{max,A}=1.6$
mm,
 $R_{max,B}=2.1$
mm),
 $l_{0}^{\ast }=0.85$
(
 $l_{0}=2.5$
mm) and
 $\unicode[STIX]{x0394}\unicode[STIX]{x1D703}^{\ast }=0.27$
(
 $T_{A}=301~\unicode[STIX]{x03BC}\text{s}$
,
 $\unicode[STIX]{x0394}T=80~\unicode[STIX]{x03BC}\text{s}$
). The black and white scale bars in (
 $a$
) and (
 $b$
) each denote 1 mm.

3.2.1.1 Pulsed jet formation
To explain the formation of a pulsed jet produced in the range of
 $l_{0}^{\ast }<1$
, where bubble penetration occurs, we show figure 7, in which two series of high-speed photographs of two tandem bubbles are presented with parameter combinations of equivalent bubble size ratio
 $\unicode[STIX]{x1D709}=1.3$
, and almost equivalent dimensionless bubble distances
 $l_{0}^{\ast }\sim 0.9$
, but different values of
 $\unicode[STIX]{x0394}\unicode[STIX]{x1D703}^{\ast }$
of 0.12 in (
 $a$
) and 0.27 in (
 $b$
). These correspond to the times from which the interaction started of
 $t^{\ast }=0.224$
(
 $R_{A}^{\ast }=0.80$
) in (
 $a$
) and 0.486 (
 $R_{A}^{\ast }=0.90$
) in (
 $b$
). We notice a significant difference in the radii of bubble A between (
 $a$
) and (
 $b$
) at each instant of the generation of bubble B. This leads to differences in the flow distance from the birth point of bubble B to the upper surface of bubble A, being longer in (
 $a$
) than that in (
 $b$
). For the case of the same
 $\unicode[STIX]{x1D709}$
values, therefore, the radial flow velocity at the upper surface of bubble A becomes lower in (
 $a$
) than that in (
 $b$
) because the radial velocity decreases with inverse proportionality to the square of flow distance. Consequently, the fluid force induced by bubble B’s motion immediately after its generation must be smaller at the upper surface of bubble A in (
 $a$
) compared with that in (
 $b$
). Furthermore, it is well recognised that a laser-induced bubble contains gas, initially at a high-pressure state from the degeneration of the plasma that drove the formation and growth of the bubble. Disregarding the surface tension and assuming that the gas obeys an adiabatic law, the gas pressure inside bubble A,
 $p_{g,A}^{\ast }$
, is expressed with the initial gas pressure ratio of
 $\unicode[STIX]{x1D6FC}=100$
at
 $R_{0,A}^{\ast }=0.1$
as follows (Pearson Reference Pearson2002):
 $$\begin{eqnarray}p_{g,A}^{\ast }=\unicode[STIX]{x1D6FC}(R_{0,A}^{\ast }/R_{A}^{\ast })^{3\unicode[STIX]{x1D705}}=0.0063R_{A}^{\ast -4.2},\end{eqnarray}$$
where
 $p_{g,A}^{\ast }=p_{g,A}/\unicode[STIX]{x0394}p$
,
 $\unicode[STIX]{x1D6FC}=p_{0}/\unicode[STIX]{x0394}p$
,
 $R_{0,A}^{\ast }=R_{0}/R_{max,A}$
,
 $R_{A}^{\ast }=R_{A}/R_{max,A}$
,
 $\unicode[STIX]{x1D705}$
: ratio of specific heats of gas (
 $=1.4$
),
 $p_{0}$
: initial gas pressure,
 $R_{0}$
: initial bubble radius,
 $R_{A}$
: bubble A’s radius at time
 $t$
. From (3.1), it is readily seen that the state,
 $p_{g,A}^{\ast }=1$
, is satisfied at 0.026 after the birth of bubble A, where the pressure at the surface of bubble A balances with the pressure difference,
 $\unicode[STIX]{x0394}p$
(
 $=\,p_{\infty }-p_{v}$
), when the dimensionless bubble radius is 0.30. Of course, the state of
 $p_{g,A}^{\ast }=0$
implies conditions for a Rayleigh bubble, wherein the bubble interior is filled with vapour at a constant pressure. Therefore, the internal gas pressure of a Rayleigh-like single bubble differs significantly from that of a gas bubble during early bubble growth. It is, therefore, clear that the gas pressures in the first frames for both cases (
 $a$
) and (
 $b$
) are sufficiently low, namely
 $p_{g,A}^{\ast }<0.02$
at
 $t^{\ast }=0.24$
(
 $R_{A}^{\ast }=0.81$
) in (
 $a$
) and
 $p_{g,A}^{\ast }<0.01$
at
 $t^{\ast }=0.53$
(
 $R_{A}^{\ast }=0.98$
) in (
 $b$
). Consequently, the upper surface of bubble A can be easily deformed by the increasing momentum of water flow caused by the motion of bubble B. As seen in (
 $b$
), a conical pulsed jet is formed in strong interactions. The conical jet formation mechanism seems to be similar to the process of the formation of a water spike with a conical tip (Blake & Gibson Reference Blake and Gibson1981; Longuet-Higgins Reference Longuet-Higgins1983). During the pronounced penetration of the lower surface of bubble B into bubble A, the annular water flow passage between the two bubbles becomes narrower, forming a low volume and quasi-confined region of water, which is essential to the formation of a pulsed jet. A quasi-confined water volume is attained earlier for larger bubble size ratios or shorter distances between the two bubble generation sites. Under these conditions, a pulsed jet with a very small amount of water can be formed. The timing of jet impact on the lower surface of bubble A strongly depends on the time difference
 $\unicode[STIX]{x0394}\unicode[STIX]{x1D703}^{\ast }$
between the two bubble generations. In (
 $b$
), the jet impact onto the lower surface of bubble A occurs at 1.02, while it is delayed until 1.28 in the case of (
 $a$
).
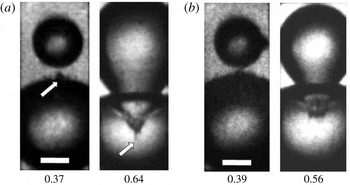
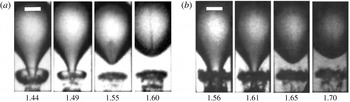
As already described in § 3.1.2, and seen again at 0.78 in figure 7(b), a weak spray is observed at the tip of the conical jet. Spray formation in tandem-bubble systems where the bubbles are produced at different times is an interesting research subject. However, some difficulties remain in the detailed elucidation of the spray formation mechanism because few observations exist to relate the cause and effect of spray formation. In the present report, therefore, spray formation is described only briefly. Figure 8 shows two examples of a pair of frames. The first frame corresponds to the state immediately after bubble B’s generation, and the second frame indicates the phenomenon immediately before spray formation. Obviously, we can observe several slender projections, indicating two at 0.64 in (
 $a$
) as depicted by a white arrow, and four in (
 $b$
). These projections are broken, finally transforming into spray. The generation mechanism of the projections remains in question.
Secondary cavitation and jet ejections: (
 $a$
)
 $\unicode[STIX]{x1D709}=1.1$
(
 $R_{max,A}=1.9$
mm,
 $R_{max,B}=2.1$
mm),
 $l_{0}^{\ast }=0.74$
(
 $l_{0}=2.9$
mm), and
 $\unicode[STIX]{x0394}\unicode[STIX]{x1D703}^{\ast }=0.18$
(
 $T_{A}=340~\unicode[STIX]{x03BC}\text{s}$
,
 $\unicode[STIX]{x0394}T=60~\unicode[STIX]{x03BC}\text{s}$
); (
 $b$
)
 $\unicode[STIX]{x1D709}=1.3$
(
 $R_{max,A}=1.8$
mm,
 $R_{max,B}=2.3$
mm),
 $l_{0}^{\ast }=0.72$
(
 $l_{0}=2.9$
mm) and
 $\unicode[STIX]{x0394}\unicode[STIX]{x1D703}^{\ast }=0.18$
(
 $T_{A}=329~\unicode[STIX]{x03BC}\text{s}$
,
 $\unicode[STIX]{x0394}T=60~\unicode[STIX]{x03BC}\text{s}$
). The dimensionless times noted under each frame are measured from the generation of bubble A, respectively. The white scale bars in (
 $a$
) and (
 $b$
) each denote 1 mm.

We approach the situation in (
 $a$
) in a simple manner. First, we note that, at 0.37 in the first frame, the dimensionless gas pressure inside bubble A with the radius of 1.7 mm is less than 0.01 as calculated by using (3.1), whereas bubble B is earlier in its growth period at 0.047 (i.e. 9
 $\unicode[STIX]{x03BC}\text{s}$
) after its generation. Therefore, approximately 8
 $\unicode[STIX]{x03BC}\text{s}$
have elapsed since the interaction of the shock wave with the upper surface of the low-pressure bubble A, because the shock wave travels approximately 1.5 mm to reach the surface, which requires the time of 1
 $\unicode[STIX]{x03BC}\text{s}$
. Consequently, a local pressure reduction is achieved in the region near the upper surface immediately after the passage of the reflected expansion wave, creating multiple black spots as seen in (
 $a$
). We now consider the central black spot, indicated by a white arrow. If this is a bubble with the maximum radius of
 $R_{max,a}\sim 0.12$
mm, whose period as a Rayleigh bubble is approximately 11
 $\unicode[STIX]{x03BC}\text{s}$
, it should be located near the curved upper surface of bubble A with the relative distance of
 $\unicode[STIX]{x1D6FE}\sim 1$
. Pearson (Reference Pearson2002) elucidated that the length of a water spike developed at the surface resulting from the bubble motion linearly increased with time with a constant velocity of
 $V_{je}^{\ast }\sim 0.45$
over the maximum bubble state. Because the free surface deformation is about 0.8 at the maximum bubble state (Blake & Gibson Reference Blake and Gibson1987), the length of jet motion
 $L_{je}^{\ast }$
in the second frame of (
 $a$
) is determined as 2.7 for the dimensionless elapsed time of 4.2 when
 $R_{max,a}$
is used as the scale length (i.e.
 $0\rightarrow 4.2$
for
 $R_{max,a}=0.12$
mm). Since
 $R_{max,a}\sim 0.12$
mm, we can determine the estimated jet length of 0.32 mm, which approaches the value of 0.26 mm measured from the image in (
 $a$
). The slender projection observed at 0.64, therefore, must be a micro-jet ejection resulting from the development of the free surface caused by the motion of a minute bubble.
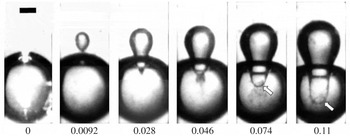
Figure 9 shows a special case of strong interaction between two bubbles. The parameter conditions are
 $\unicode[STIX]{x1D709}=1.6$
,
 $l_{0}^{\ast }=0.5$
and
 $\unicode[STIX]{x0394}\unicode[STIX]{x1D703}^{\ast }=0.5$
. Here, the instant at which bubble B is generated is defined as zero, and the elapsed dimensionless times are noted below each frame. Because
 $\unicode[STIX]{x0394}\unicode[STIX]{x1D703}^{\ast }$
is taken as 0.5, the pressure inside bubble A is estimated to be equivalent to the vapour pressure. Immediately after 0.0092, the tip velocity of the lower surface of bubble B varies from
 $-440~\text{m}~\text{s}^{-1}$
(i.e.
 $V_{ls,B}^{\ast }=-44$
) to
 $-120~\text{m}~\text{s}^{-1}$
(i.e.
 $V_{ls,B}^{\ast }=-12$
), both of which are measured using two successive frames with the frame interval of 2
 $\unicode[STIX]{x03BC}\text{s}$
. Thus, a large change in the momentum of the water near the lower surface of bubble B occurs much earlier in the growth of bubble B, causing a small amount of water to move forward. As clearly seen at 0.028, a black substance, located ahead of the tip of bubble B, is continuously pressed by the growing bubble B to form a conical jet. The jet moves downward with a velocity of
 $-194~\text{m}~\text{s}^{-1}$
(i.e.
 $V_{j,A}^{\ast }=-19.5$
). During this process, an annular water flow passage between the two bubbles narrows to create a water film, due to the high-speed movement of the extending lower part of bubble B. A little water flows into the region of the pulsed jet through the annular flow passage. A spray appears at the tip of the conical jet starting at 0.028 and spreads outward over time. The water film is ruptured at 0.074, creating a circle somewhere on the lower part of bubble B, as indicated by the white arrows in figure 9. After this occurs, the circle radius is increased with increasing time, as seen at 0.11; instabilities propagate, spreading over the entire water film. The head shape of the lower surface of bubble B gradually becomes rounded, which is similar to the behaviour observed by Lauterborn & Hentschel (Reference Lauterborn and Hentschel1985). Thus, when
 $\unicode[STIX]{x1D709}$
is large, most of the water initially entrapped to form a jet is instead transformed into mist. Consequently, no jet impact occurs, but the tip of bubble B arrives at the lower surface of bubble A in the form of a pseudo-impact, or surface contact between the two bubbles.
Jet development, spray formation and water film rupture due to strong bubble interaction:
 $\unicode[STIX]{x1D709}=1.6$
(
 $R_{max,A}=2.2$
mm,
 $R_{max,B}=3.4$
mm),
 $l_{0}^{\ast }=0.5$
(
 $l_{0}=2.8$
mm) and
 $\unicode[STIX]{x0394}\unicode[STIX]{x1D703}^{\ast }=0.5$
(
 $T_{A}=397~\unicode[STIX]{x03BC}\text{s}$
,
 $\unicode[STIX]{x0394}T=200~\unicode[STIX]{x03BC}\text{s}$
). The instant of the formation of bubble B is defined as zero and the first frame corresponds to the dimensionless time
 $t^{\ast }=0.92$
(i.e. 200
 $\unicode[STIX]{x03BC}\text{s}$
) after the generation of bubble A. White arrows indicate the circle part of film rupture. The black scale bar denotes 1 mm.

3.2.1.2 Effects of interaction parameters on jet impact velocity
Using two similar-sized bubbles with an uncertainty of
 $\pm 15\,\%$
(i.e.
 $\unicode[STIX]{x1D709}=1.0\pm 0.15$
), the jet velocity,
 $V_{j,A}^{\ast }$
, in impacting the lower surface of bubble A was examined as a function of the time difference between the generation of two tandem bubbles,
 $\unicode[STIX]{x0394}\unicode[STIX]{x1D703}^{\ast }$
, for the two distance parameters
 $l_{0}^{\ast }=0.75$
(▴) and 1.0 (●), where a spatial uncertainty of 15 % was considered in determining
 $l_{0}^{\ast }$
. Figure 10 shows the results and the details of these data points can be found in the figure caption. It is known that, for two bubbles generated simultaneously with equal input energies, i.e. when
 $\unicode[STIX]{x0394}\unicode[STIX]{x1D703}^{\ast }=0$
(although it is difficult to generate two bubbles of exactly equal size, because the one-way focusing of the laser beam at the focal point tends to generate a non-spherical plasma volume along the optical axis), two jets are produced in opposite directions resulting from the creation of a high-pressure stagnation region between the two bubbles. Therefore, in the case where the first produced bubble, namely bubble A, is located lower, the jet formed in it is directed upward, which is a similar trend in jet direction observed for a single bubble collapsing near a rigid planar boundary above the bubble. Han et al. (Reference Han, Köhler, Jungnickel, Mettin, Lauterborn and Vogel2015) numerically obtained a jet velocity of
 $V_{j,A}^{\ast }=7.0$
for the parameter combination of
 $\unicode[STIX]{x1D709}=1.0$
,
 $l_{0}^{\ast }=0.87$
and
 $\unicode[STIX]{x0394}\unicode[STIX]{x1D703}^{\ast }=0$
. Although a planar stagnation region could be formed in the flow field between the two simultaneously produced bubbles with
 $\unicode[STIX]{x1D709}=1.0$
, a convex upward stagnation region may be formed in the case of
 $\unicode[STIX]{x1D709}>1.0$
; the flow field created around the lower bubble in this case looks similar to that formed by a single bubble near a concave rigid wall (Tomita et al.
Reference Tomita, Robinson, Tong and Blake2002). If bubble B is generated with a time delay
 $\unicode[STIX]{x0394}T$
(i.e.
 $\unicode[STIX]{x0394}\unicode[STIX]{x1D703}^{\ast }>0$
), bubble A grows like a Rayleigh bubble until bubble B is generated, but the symmetry of the flow field between the two bubbles is quickly lost after interaction with the delayed bubble B, causing a discrepancy in the bubble shapes; accordingly, the impact velocity of a jet in bubble A may drop drastically when
 $\unicode[STIX]{x0394}\unicode[STIX]{x1D703}^{\ast }$
is slightly shifted from zero. Even under these conditions, if the gas pressure at the time
 $t^{\ast }$
(
 $\unicode[STIX]{x0394}\unicode[STIX]{x1D703}^{\ast }$
) satisfies the condition
 $p_{g,A}^{\ast }\gg 1$
, the jet produced in bubble A remains directed upward because the flow field around the bubble would be similar to that created when two simultaneously produced bubbles with
 $\unicode[STIX]{x1D709}<1.0$
collapse; it is known that the flow field in the latter is similar to that formed by a single bubble near a convex rigid wall (Tomita et al.
Reference Tomita, Robinson, Tong and Blake2002). Pearson (Reference Pearson2002) numerically found an upward-directed jet at the dimensionless time of 0.05, corresponding to
 $\unicode[STIX]{x0394}\unicode[STIX]{x1D703}^{\ast }=0.027$
.
Effect of
 $\unicode[STIX]{x0394}\unicode[STIX]{x1D703}^{\ast }$
on the velocity of a jet
 $V_{j,A}^{\ast }$
impacting the lower surface of bubble A (
 $\unicode[STIX]{x1D709}=1.0$
). ● denotes the case for
 $l_{0}^{\ast }=1.0$
and ▴ denotes the case for
 $l_{0}^{\ast }=0.75$
. ▪ indicates the case for
 $l_{0}^{\ast }=1.0$
and
 $\unicode[STIX]{x0394}\unicode[STIX]{x1D703}^{\ast }=0.5$
(Han et al.
Reference Han, Köhler, Jungnickel, Mettin, Lauterborn and Vogel2015);
 $\odot$
(
 $l_{0}^{\ast }=0.95$
,
 $\unicode[STIX]{x0394}\unicode[STIX]{x1D703}^{\ast }=0$
) (Tomita & Shima Reference Tomita and Shima1990) and
 $\oplus$
(
 $l_{0}^{\ast }=0.87$
,
 $\unicode[STIX]{x0394}\unicode[STIX]{x1D703}^{\ast }=0$
) (Han et al.
Reference Han, Köhler, Jungnickel, Mettin, Lauterborn and Vogel2015) are experimentally and numerically obtained data for two simultaneously generated bubbles, respectively.

 $\unicode[STIX]{x1D6FE}=1.0$
) (Philipp & Lauterborn Reference Philipp and Lauterborn1998) and

 $\unicode[STIX]{x1D6FE}=0.75$
) (Brujan et al.
Reference Brujan, Nahen, Schmidt and Vogel2001) represent the results for a single bubble near a solid boundary (
 $\unicode[STIX]{x0394}\unicode[STIX]{x1D703}^{\ast }=0$
) and

 $\unicode[STIX]{x1D6FE}=0.94$
) (Robinson et al.
Reference Robinson, Blake, Kodama, Shima and Tomita2001) and

 $\unicode[STIX]{x1D6FE}=0.82$
) (Kodama Reference Kodama1992) correspond to experiments for a single bubble near a free surface (
 $\unicode[STIX]{x0394}\unicode[STIX]{x1D703}^{\ast }=0.5$
).

Considering the calculated result obtained by Pearson (Reference Pearson2002) and the data of
 $V_{j,A}^{\ast }$
designating a negative value for a relatively wide range of
 $\unicode[STIX]{x0394}\unicode[STIX]{x1D703}^{\ast }$
, exceeding the data point of 0.12, it is reasonable to estimate that the direction of a jet must change sign from positive to negative in the range of
 $0.027<\unicode[STIX]{x0394}\unicode[STIX]{x1D703}_{c}^{\ast }<0.12$
. Within this range, the condition
 $V_{j,A}^{\ast }=0$
would be satisfied for the critical birth-time difference,
 $\unicode[STIX]{x0394}\unicode[STIX]{x1D703}_{c}^{\ast }$
, although no data for exact values of
 $\unicode[STIX]{x0394}\unicode[STIX]{x1D703}_{c}^{\ast }$
have been reported. It would be interesting to know whether the existence of
 $\unicode[STIX]{x0394}\unicode[STIX]{x1D703}_{c}^{\ast }$
implies the zero conditional state of a Kelvin impulse (Blake, Leppinen & Wang Reference Blake, Leppinen and Wang2015), which allows short-duration changes in the liquid mass and momentum, induced by the motion of each laser-produced vapour bubble. The Kelvin impulse is considered an important indicator for determining the direction of bubble motion along the symmetric axis. Therefore, it is estimated that, in the range for small birth-time differences of the two bubbles, i.e.
 $0<\unicode[STIX]{x0394}\unicode[STIX]{x1D703}^{\ast }<\unicode[STIX]{x0394}\unicode[STIX]{x1D703}_{c}^{\ast }$
, the jet directed upward forms late in the collapse of bubble A because the water sandwiched between the two bubbles is subjected to great pressure from the inertia of the water driven by the high-pressure gases inside the two bubbles during their earlier growth periods. In fact, we observed an upward-directed jet produced during the collapse of bubble A when the birth-time difference of the two bubbles,
 $\unicode[STIX]{x0394}T$
, was 20
 $\unicode[STIX]{x03BC}\text{s}$
, although we could not determine the parameter values,
 $\unicode[STIX]{x1D709}$
,
 $l_{0}^{\ast }$
and
 $\unicode[STIX]{x0394}\unicode[STIX]{x1D703}^{\ast }$
, because we could not calculate the exact values of the maximum bubble radii for bubble A and bubble B.
On the other hand, for the case of
 $\unicode[STIX]{x0394}\unicode[STIX]{x1D703}^{\ast }>\unicode[STIX]{x0394}\unicode[STIX]{x1D703}_{c}^{\ast }$
, when the gas pressure inside the growing bubble A is reduced to a value below the hydrostatic pressure at the instant of the generation of bubble B, the pressure gradient in the water near the upper surface of bubble A would overcome the inertia of the water driven by the growth of bubble A. This would produce a jet directed downward during the growth period of bubble A. As
 $\unicode[STIX]{x0394}\unicode[STIX]{x1D703}^{\ast }$
increases up to
 $\unicode[STIX]{x0394}\unicode[STIX]{x1D703}^{\ast }=0.5$
, the gas pressure within bubble A decreases to a level significantly lower than the hydrostatic pressure; for instance, the dimensionless gas pressure inside bubble A is less than 0.01 when
 $\unicode[STIX]{x0394}\unicode[STIX]{x1D703}^{\ast }=0.3$
. Therefore, when the upper surface of bubble A, regarded as a curved free surface, is subjected to pressure from the rapid growth of bubble B, a water spike is produced to form a conical jet directed downward into the low-pressure gas within bubble A.
As is well known, when an isolated vapour bubble grows near a free surface, the surface becomes elevated and evolves to form a water spike with a conical tip (Blake & Gibson Reference Blake and Gibson1981; Longuet-Higgins Reference Longuet-Higgins1983). The motion of this water spike strongly depends on the Kelvin impulse, whose absolute value is known to increase as the stand-off parameter
 $\unicode[STIX]{x1D6FE}$
is decreased for the case of a single bubble (Blake et al.
Reference Blake, Leppinen and Wang2015). Pearson et al. (Reference Pearson, Cox, Blake and Otto2004) investigated bubble interactions near a free surface and elucidated that the maximum Kelvin impulse was attained not during final collapse, but as the bubble became entrained in the raised free surface. They also demonstrated that the Kelvin impulse was almost constant with less variation in time for the dimensionless times
 $t^{\ast }$
from 0.458 to 0.915 in the range of
 $0.8<\unicode[STIX]{x1D6FE}<1.3$
(i.e.
 $0.8<l_{0}^{\ast }<1.3$
for the present study employing two tandem bubbles with
 $\unicode[STIX]{x0394}\unicode[STIX]{x1D703}^{\ast }=0.5$
). A similar physical situation may occur when two tandem bubbles are produced at different times,
 $0.25<\unicode[STIX]{x0394}\unicode[STIX]{x1D703}^{\ast }<0.5$
(corresponding to
 $0.458<t^{\ast }<0.915$
), under the bubble distances of
 $0.8<l_{0}^{\ast }<1$
. At
 $t^{\ast }=0.458$
, the radius of bubble A reaches
 $R_{A}^{\ast }=0.885$
; using (3.1), we obtain the corresponding gas pressure inside bubble A as 0.011 (
 ${<}1$
). Therefore, if bubble B is generated very close to bubble A, the upper surface of bubble A could deform notably because of the large pressure difference between the inside and outside of the bubble, as well as the increasing stagnation pressure. Consequently, pulsed jets with almost the same values of
 $V_{j,A}^{\ast }$
were generated (see figure 10). On the other hand, in the range of
 $\unicode[STIX]{x0394}\unicode[STIX]{x1D703}^{\ast }>0.5$
, flow superposition occurs because of the radial flow induced by the explosive growth of bubble B coupled with the inward flow from the collapse motion of bubble A, forming a so-called liquid jet instead of a pulsed jet. Therefore, the absolute values of the jet velocities in these regions are somewhat larger than those generated in the region
 $0.25<\unicode[STIX]{x0394}\unicode[STIX]{x1D703}^{\ast }<0.5$
. Meanwhile, for smaller bubble distances (i.e.
 $l_{0}^{\ast }=0.75$
), the absolute value of water velocity becomes larger than the case of
 $l_{0}^{\ast }=1$
; the resultant stagnation pressure would act on the surface of the large, low-pressure bubble A, thereby producing jet impact velocities higher than those for
 $l_{0}^{\ast }=1$
, as clearly seen in figure 10.
Effect of the dimensionless bubble distance,
 $l_{0}^{\ast }$
, on the velocity of a jet impacting the lower surface of bubble A,
 $-V_{j,A}^{\ast }$
, denoted by ● for the parameter combination
 $\unicode[STIX]{x1D709}=1.0$
and
 $\unicode[STIX]{x0394}\unicode[STIX]{x1D703}^{\ast }=0.3$
. Three data points, denoted by ▵, are numerically obtained for two bubbles at
 $\unicode[STIX]{x0394}\unicode[STIX]{x1D703}^{\ast }=0.5$
(Han et al.
Reference Han, Köhler, Jungnickel, Mettin, Lauterborn and Vogel2015), and one data point (○) indicates the case
 $\unicode[STIX]{x0394}\unicode[STIX]{x1D703}^{\ast }=0.27$
(Pearson Reference Pearson2002). Furthermore, two data points for a single bubble near a free surface (
 $\unicode[STIX]{x0394}\unicode[STIX]{x1D703}^{\ast }=0.5$
) are added for comparison;


Figure 11 shows the relationship between the value of the dimensionless jet impact velocity,
 $-V_{j,A}^{\ast }$
, and the dimensionless bubble distance,
 $l_{0}^{\ast }$
, for a specified parameter,
 $\unicode[STIX]{x0394}\unicode[STIX]{x1D703}^{\ast }=0.3$
, where the direction of
 $V_{j,A}^{\ast }$
, is negative as shown in figure 10. As defined in (2.1),
 $l_{0}^{\ast }$
depends on
 $\unicode[STIX]{x1D709}$
. Therefore, we investigated the effect of
 $l_{0}^{\ast }$
on
 $V_{j,A}^{\ast }$
for a fixed bubble size ratio
 $\unicode[STIX]{x1D709}=1.0\pm 0.2$
; six data points denoted by (●) are available to plot in the figure. To compare our experiments with calculations, one available result (○) obtained for
 $\unicode[STIX]{x0394}\unicode[STIX]{x1D703}^{\ast }=0.27$
(Pearson Reference Pearson2002) is included. Three data points numerically obtained for
 $\unicode[STIX]{x0394}\unicode[STIX]{x1D703}^{\ast }=0.5$
, denoted by (▵) (Han et al.
Reference Han, Köhler, Jungnickel, Mettin, Lauterborn and Vogel2015) are included for comparison. Two data points for the jet impact velocities obtained for single bubbles collapsing near free surfaces, which can create flow fields similar to those induced by the motion of two bubbles generated with
 $\unicode[STIX]{x0394}\unicode[STIX]{x1D703}^{\ast }=0.5$
, are also added for reference. One of the two is an experimental value (Robinson et al.
Reference Robinson, Blake, Kodama, Shima and Tomita2001), denoted by (


 $l_{0}^{\ast }\leqslant 1.1$
, it is apparent that
 $V_{j,A}^{\ast }$
strongly depends on
 $l_{0}^{\ast }$
, and its absolute value increases as
 $l_{0}^{\ast }$
decreases in the range
 $l_{0}^{\ast }<1.0$
. When
 $l_{0}^{\ast }=0.5$
, the absolute jet velocity can reach approximately twice its value at
 $l_{0}^{\ast }=1.0$
, and the minimum value of
 $-V_{j,A}^{\ast }$
is achieved at
 $l_{0}^{\ast }\sim 1.0$
. Good agreement obtained for
 $\unicode[STIX]{x0394}\unicode[STIX]{x1D703}^{\ast }\sim 0.3$
is found between the calculated result obtained by (○) for
 $l_{0}^{\ast }=0.8$
(Pearson Reference Pearson2002) and our experimental result at the same
 $l_{0}^{\ast }$
value. As seen in figure 4(a,c), in this region of
 $l_{0}^{\ast }<1.0$
, a pulsed jet is created by the accelerated increase in momentum of a quasi-confined water mass located ahead of the lower tip of bubble B, predominantly resulting from the increase in the lower tip velocity of bubble B. As
 $l_{0}^{\ast }$
decreases, a confined water mass is accelerated significantly to reach a much higher downward velocity. Meanwhile, when
 $l_{0}^{\ast }=1.0$
, less difference occurs in the values of
 $V_{j,A}^{\ast }$
between the two cases of
 $\unicode[STIX]{x0394}\unicode[STIX]{x1D703}^{\ast }=0.3$
, as denoted by (●), for the present experimental value, and
 $\unicode[STIX]{x0394}\unicode[STIX]{x1D703}^{\ast }=0.5$
, denoted by (▵), for the numerically calculated result obtained by Han et al. (Reference Han, Köhler, Jungnickel, Mettin, Lauterborn and Vogel2015). For these parameter ranges, the bubble pressures drop sufficiently below the hydrodynamic pressure, namely less than 0.01, and the distances from the birth point of bubble B to the upper surface of bubble A are almost the same for the two cases; subsequently a certain rate of change of water momentum is imposed on the upper surface of bubble A, thereby producing jets with similar impact velocity magnitudes for a specified
 $l_{0}^{\ast }$
, such as
 $l_{0}^{\ast }=1.0$
. In contrast, for a region
 $l_{0}^{\ast }>1.0$
, the so-called jet, instead of a pulsed jet, now forms inside bubble A; its velocity,
 $V_{j,A}^{\ast }$
, becomes higher in the negative direction with increasing
 $l_{0}^{\ast }$
. The flow field around bubble A can form because of the superimposition of the flow field induced by the motion of bubble B on that induced by the motion of bubble A. The existence of bubble B may block the flow induced by the motion of bubble A. For shorter
 $l_{0}^{\ast }$
in the region
 $l_{0}^{\ast }>1.0$
, the blockage effect increases and more water particles are blocked, especially during the collapse process of bubble A. Subsequently, a small mass of water creates a jet with a relatively low velocity. However, when
 $l_{0}^{\ast }$
becomes larger, the blockage effect decreases; the water mass accumulated near the upper portion of bubble A may be adequate to produce a jet of higher velocity during the collapse process, although a weak flow effect from the growth motion of bubble B exists because the radial flow velocity decreases with proportionality inverse to the square of the distance.
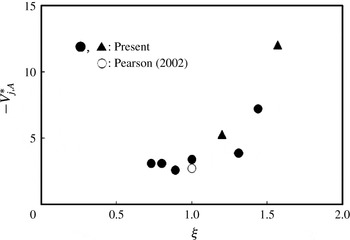
Effect of the bubble size ratio,
 $\unicode[STIX]{x1D709}$
, on the velocity of a jet impacting the lower surface of bubble A,
 $-V_{j,A}^{\ast }$
, for two parameter combinations; ●:
 $l_{0}^{\ast }=0.75$
,
 $\unicode[STIX]{x0394}\unicode[STIX]{x1D703}^{\ast }=0.3$
; ▲:
 $l_{0}^{\ast }=0.6$
,
 $\unicode[STIX]{x0394}\unicode[STIX]{x1D703}^{\ast }=0.5$
. ○ denotes the calculated result for
 $l_{0}^{\ast }=0.8$
and
 $\unicode[STIX]{x0394}\unicode[STIX]{x1D703}^{\ast }=0.27$
(Pearson Reference Pearson2002).

Regarding applications of tandem-bubble sonoporation, an example concerning two tandem bubbles on the micrometre scale is worth considering. Sankin et al. (Reference Sankin, Yuan and Zhong2010) performed an experiment using these two-dimensional bubbles. For the parameter combination of bubble size ratio
 $\unicode[STIX]{x1D709}\approx 1$
(
 $R_{max}=25~\unicode[STIX]{x03BC}\text{m}$
), dimensionless bubble distance
 $l_{0}^{\ast }=0.87$
(
 $l_{0}=40~\unicode[STIX]{x03BC}\text{m}$
) and birth-time difference between the two bubbles
 $\unicode[STIX]{x0394}\unicode[STIX]{x1D703}^{\ast }=0.31$
(
 $\unicode[STIX]{x0394}T=4~\unicode[STIX]{x03BC}\text{s}$
), they obtained a maximum flow velocity
 $V_{B1}$
of 10
 $\text{m}~\text{s}^{-1}$
near the jet tip. According to Hsiao et al. (Reference Hsiao, Choi, Singh, Chahine, Hay, Ilinskii, Zabolotskaya, Hamilton, Sankin, Yuan and Zhong2013), the three-dimensional jet velocity can be estimated by multiplying the two-dimensional jet velocity by a two-dimensional correction factor, such as
 $\{\log (R_{D}/R_{max})\}^{1/2}$
, in which
 $R_{D}$
is the disk size (
 $=\,0.75$
mm). From this estimation, we obtain a three-dimensional jet velocity of
 $-18.4~\text{m}~\text{s}^{-1}$
, corresponding to
 $V_{j,A}^{\ast }=-1.8$
. As seen from figure 11, this value is slightly lower than the lower edge of the
 $-V_{j,A}^{\ast }$
versus
 $l_{0}^{\ast }$
relationship for
 $\unicode[STIX]{x0394}\unicode[STIX]{x1D703}^{\ast }=0.3$
.
Figure 12 indicates the value of the dimensionless jet impact velocity
 $-V_{j,A}^{\ast }$
as a function of the bubble size ratio
 $\unicode[STIX]{x1D709}$
for two parameter combinations (
 $l_{0}^{\ast }$
,
 $\unicode[STIX]{x0394}\unicode[STIX]{x1D703}^{\ast }$
), i.e. (0.75, 0.3) denoted by (●) and (0.6, 0.5) denoted by (▴), although only two data points are used for the latter. It is obvious that the magnitude of
 $V_{j,A}^{\ast }$
increases with increasing
 $\unicode[STIX]{x1D709}$
, especially in the range of
 $\unicode[STIX]{x1D709}>1.0$
. For instance, when we examine the case of
 $\unicode[STIX]{x1D709}=1.4$
under the same parameter combination,
 $l_{0}^{\ast }=0.75$
and
 $\unicode[STIX]{x0394}\unicode[STIX]{x1D703}^{\ast }=0.3$
, corresponding to the dimensionless time at
 $t^{\ast }=0.549$
, the lower surface of bubble B was exceedingly elongated along the symmetric axis due to the shortness of the distance between the two bubbles, as well as the presence of the nearby bubble A, whose internal pressure is low; subsequently, the bubble B’s lower tip velocity of
 $-5.7$
was reached. Under this situation, the pressure produced inside bubble A has a little effect on the velocity of a conical jet. Consequently, the water located between the two bubbles was accelerated more strongly to move downward, producing a pulsed jet with the impact velocity of
 $-7.2$
, which is approximately twice the velocity for the case of
 $\unicode[STIX]{x1D709}=1.0$
(i.e.
 $V_{j,A}^{\ast }=-3.4\rightarrow -7.2$
), as previously explained for figure 4. This trend becomes more remarkable for the shorter bubble distance cases, e.g.
 $l_{0}^{\ast }=0.6$
, because
 $V_{j,A}^{\ast }$
varies with approximately the same value for the two cases,
 $\unicode[STIX]{x0394}\unicode[STIX]{x1D703}^{\ast }=0.3$
and
 $\unicode[STIX]{x0394}\unicode[STIX]{x1D703}^{\ast }=0.5$
, as clearly seen in figure 10. Pearson (Reference Pearson2002) calculated the evolutions of bubble shapes for two bubbles with the parameter combination,
 $l_{0}^{\ast }=0.8$
,
 $\unicode[STIX]{x0394}\unicode[STIX]{x1D703}^{\ast }=0.27$
, and
 $\unicode[STIX]{x1D709}=1.0$
, from which the value of
 $V_{j,A}^{\ast }$
can be determined as
 $-2.7$
. This value denoted by (○) falls inside the range of our experiments, ranging from
 $-2.6$
to
 $-3.4$
for the parameter range
 $0.7<\unicode[STIX]{x1D709}\leqslant 1$
. It is noted that for larger values of
 $\unicode[STIX]{x1D709}$
, such as
 $\unicode[STIX]{x1D709}>1.5$
, the impact jet velocity becomes high; however, the conical water mass consisting of the jet will be completely transformed into mist before impacting the lower surface of bubble A.
3.2.1.3 Jet impact time and jet impact pressure
The jet impact time,
 $t_{imp}^{\ast }$
, is an important indicator for evaluating the effectiveness of perforation in the cell membrane during tandem-bubble sonoporation. As described in §§ 3.1.1 and 3.1.2, the lower surface of bubble A behaved similarly to a Rayleigh bubble until jet impact occurred. Naturally, a desirable jet impact must be achieved at
 $t_{imp}^{\ast }=0.915$
: if a cell is present, the lower surface might be in contact with the membrane surface when bubble A reaches its maximum volume.
With this limit, we explore the dimensionless time difference between the jet impact time and the time at which bubble A reaches its maximum volume,
 $\unicode[STIX]{x0394}t_{imp}^{\ast }$
, defined as
 $$\begin{eqnarray}\displaystyle \unicode[STIX]{x0394}t_{imp}^{\ast }=\frac{t_{imp}^{\ast }}{0.915}-1. & & \displaystyle\end{eqnarray}$$
Therefore, an optimum jet impact occurs when
 $\unicode[STIX]{x0394}t_{imp}^{\ast }=0$
.
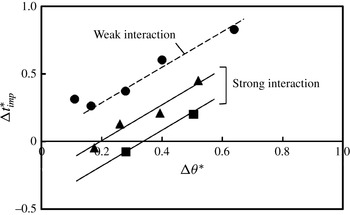
Figure 13 shows the relationship between
 $\unicode[STIX]{x0394}t_{imp}^{\ast }$
and
 $\unicode[STIX]{x0394}\unicode[STIX]{x1D703}^{\ast }$
for three selected parameter combinations with uncertainties of 15 % in all cases. The parameters for the first data group, denoted by a solid circle (●), are
 $\unicode[STIX]{x1D709}=1.0$
and
 $l_{0}^{\ast }=1.0$
; those for the second data group, indicated by a solid triangle (▴), are
 $\unicode[STIX]{x1D709}=1.0$
and
 $l_{0}^{\ast }=0.75$
; those for the third data group, denoted by a solid square (▪), are
 $\unicode[STIX]{x1D709}=1.5$
and
 $l_{0}^{\ast }=0.5$
. We note that the jets produced in bubble A for
 $\unicode[STIX]{x1D709}=1.0$
and
 $l_{0}^{\ast }=1.0$
are not pulsed jets but instead jets induced by the weak interaction of two bubbles, as shown in figure 3. Under these conditions,
 $\unicode[STIX]{x0394}t_{imp}^{\ast }$
is always positive and varies linearly with respect to
 $\unicode[STIX]{x0394}\unicode[STIX]{x1D703}^{\ast }$
in a range of
 $0.15<\unicode[STIX]{x0394}\unicode[STIX]{x1D703}^{\ast }<0.7$
, as denoted by the broken line. Thus, the jet impact never occurs before bubble A reaches its maximum volume. As
 $l_{0}^{\ast }$
decreases for a constant bubble size ratio
 $\unicode[STIX]{x1D709}=1.0$
, bubble interaction increases in strength, as was clearly shown in figures 4 and 11. Accordingly, pulsed jets are created by the pronounced growth of the lower surface of bubble B. In the case where
 $l_{0}^{\ast }=0.75$
,
 $\unicode[STIX]{x0394}t_{imp}^{\ast }$
increases linearly with respect to
 $\unicode[STIX]{x0394}\unicode[STIX]{x1D703}^{\ast }$
according to the function
 $\unicode[STIX]{x0394}t_{imp}^{\ast }=1.3\unicode[STIX]{x0394}\unicode[STIX]{x1D703}^{\ast }-0.26$
, as determined by applying the least squares method. This expression suggests that, if a cell is present, an optimum jet impact time satisfying the condition
 $\unicode[STIX]{x0394}t_{imp}^{\ast }=0$
occurs at the dimensionless time difference of
 $\unicode[STIX]{x0394}\unicode[STIX]{x1D703}^{\ast }=0.2$
. For larger bubble size ratios
 $\unicode[STIX]{x1D709}>1$
, the optimum condition of
 $\unicode[STIX]{x0394}\unicode[STIX]{x1D703}^{\ast }$
is shifted to values exceeding 0.2. In fact, we obtain the optimum
 $\unicode[STIX]{x0394}\unicode[STIX]{x1D703}^{\ast }$
of 0.34 when
 $\unicode[STIX]{x1D709}=1.5$
and
 $l_{0}^{\ast }=0.5$
, although this value is estimated using only two data points.
Dimensionless time difference between the jet impact time and the time at which bubble A reaches its maximum volume,
 $\unicode[STIX]{x0394}t_{imp}^{\ast }$
, versus dimensionless time difference between the two bubble generations,
 $\unicode[STIX]{x0394}\unicode[STIX]{x1D703}^{\ast }$
. ●:
 $\unicode[STIX]{x1D709}=1.0$
and
 $l_{0}^{\ast }=1.0$
; ▴:
 $\unicode[STIX]{x1D709}=1.0$
and
 $l_{0}^{\ast }=0.75$
; ▪:
 $\unicode[STIX]{x1D709}=1.5$
and
 $l_{0}^{\ast }=0.5$
. The two solid lines, linearly approximated by the least squares method, correspond to cases of pulsed jets produced by strong interactions of the two bubbles. The dashed line indicates the cases of jets caused by weak interactions.

In general, when a water jet impacts the boundary surface, the impact occurs with the water hammer pressure of
 $p_{wh}$
. This pressure forms because of the action of compression waves from the compressibility of water. The water hammer pressure can be defined as follows (Heymann Reference Heymann1968):
 $$\begin{eqnarray}\displaystyle p_{wh}=\unicode[STIX]{x1D70C}c\unicode[STIX]{x1D70C}_{m}c_{m}V_{j}/(\unicode[STIX]{x1D70C}_{m}c_{m}+\unicode[STIX]{x1D70C}c), & & \displaystyle\end{eqnarray}$$
where
 $c$
: sound velocity in water,
 $c_{m}$
: sound velocity in medium,
 $V_{j}$
: impact velocity of a jet and
 $\unicode[STIX]{x1D70C}_{m}$
: density of the medium. In the case where a jet with the velocity of
 $V_{j,A}$
impacts the lower surface of bubble A, which moves with the velocity of
 $V_{ls,A}$
, the water hammer pressure becomes (Johnsen & Colonius Reference Johnsen and Colonius2009; Kobayashi, Kodama & Takahira Reference Kobayashi, Kodama and Takahira2011):
 $$\begin{eqnarray}\displaystyle p_{wh}=\unicode[STIX]{x1D70C}c|V_{j,A}-V_{ls,A}|/2. & & \displaystyle\end{eqnarray}$$
Immediately after the jet impact, the jet flow stops instantaneously at the surface, creating the stagnation pressure,
 $p_{s}$
. Thus, the full waveform of the pressure resulting from jet impact exhibits a sharp impulse from
 $p_{wh}$
followed by a lower level stagnation pressure of
 $p_{s}$
with a relatively broad pulse width. We can calculate the water hammer pressures for two parameter combinations, corresponding to figure 4(a,b), such as (
 $a$
)
 $\unicode[STIX]{x1D709}=1.0$
,
 $l_{0}^{\ast }=0.74$
,
 $\unicode[STIX]{x0394}\unicode[STIX]{x1D703}^{\ast }=0.26$
and (
 $b$
)
 $\unicode[STIX]{x1D709}=1.4$
,
 $l_{0}^{\ast }=0.6$
,
 $\unicode[STIX]{x0394}\unicode[STIX]{x1D703}^{\ast }=0.28$
, both of which lead to results close to the optimum jet impact conditions, as clearly seen in figure 13. We obtain
 $p_{wh}=27$
MPa for (
 $a$
), where
 $V_{j,A}=-34~\text{m}~\text{s}^{-1}$
and
 $V_{ls,A}=2~\text{m}~\text{s}^{-1}$
and
 $p_{wh}=55$
MPa for (
 $b$
), where
 $V_{j,A}=-72~\text{m}~\text{s}^{-1}$
and
 $V_{ls,A}=2.4~\text{m}~\text{s}^{-1}$
. The duration of the water hammer pressure,
 $t_{d,wh}$
, can be roughly evaluated by the expression
 $d_{j}/2c$
, with
 $d_{j}$
being the jet diameter of approximately one-tenth of the bubble diameter, namely
 $2R_{max,A}$
(Tomita & Shima Reference Tomita and Shima1986). Thus, we obtain the duration
 $t_{d,wh}$
of approximately 0.1
 $\unicode[STIX]{x03BC}\text{s}$
for both cases, in which
 $R_{max,A}$
is determined as 1.7 mm for (
 $a$
) and 1.6 mm for (
 $b$
). Of course, the water hammer pressure
 $p_{wh}$
approaches
 $\unicode[STIX]{x1D70C}c|V_{j,A}|/2$
when jet impact occurs at the condition that exactly satisfies
 $\unicode[STIX]{x0394}t_{imp}^{\ast }=0$
, in which
 $V_{ls,A}$
is zero. The stagnation pressure,
 $p_{s}=\unicode[STIX]{x1D70C}V_{j,A}^{2}/2$
, is inevitably followed by the water hammer pressure and can be calculated as (
 $a$
) 0.6 MPa and (
 $b$
) 2.6 MPa for the same parameter conditions. If a cell or tissue is present near the first produced bubble, the water hammer pressure due to jet impact is slightly greater than that generated when a jet impacts the lower surface of the bubble without any boundary, because the acoustic impedances of the bio-surfaces should be slightly larger than that of a water surface. Cell membrane failure occurs at approximately 3 kPa for red blood cells (Rotsch, Jacobson & Radmacher Reference Rotsch, Jacobson and Radmacher1999; Prentice et al.
Reference Prentice, Cuschieri, Dholakia, Prausnitz and Campbell2005); if the membrane surface is subject to a micro-streaming induced by bubble oscillation, the surface could be destroyed at the critical shear stress. The water hammer pressures from jet impact can easily penetrate the cell membrane, despite the very short duration of the water hammer pressure for small bubbles. For instance, when the bubble diameter is 10
 $\unicode[STIX]{x03BC}\text{m}$
, the pressure duration is of the order of 0.1 ns.
In general, it is true that the jet velocity formed inside the bubble first produced in a system of tandem bubbles tends to be smaller than that produced from a single bubble for the same bubble distance condition. Nevertheless, the impact pressure of a jet with the velocity of several tens of metres per second seems sufficiently large to make a small hole in a cell membrane. One merit of using a jet produced in the bubble first produced, like that in the present system of two tandem bubbles with different birth times, is the ability to create a jet at a definite position and time by controlling the three parameters
 $\unicode[STIX]{x1D709}$
,
 $l_{0}^{\ast }$
, and
 $\unicode[STIX]{x0394}\unicode[STIX]{x1D703}^{\ast }$
. This permits the determination of the optimum jet impact condition where the jet impact occurs. Ideally, this would occur as bubble A reaches its maximum volume with its lower surface in contact with the membrane surface of a cell.
3.2.2 Jets formed in the second produced bubble
Two specified examples of bubble topologies. Panel (
 $a$
) contains four images obtained immediately before and after the collapse of the toroidal bubble A, with the first frame corresponding to the dimensionless time 1.44 (i.e. 260
 $\unicode[STIX]{x03BC}\text{s}$
) after the generation of bubble A, and depicts a nearly critical state of bubble B, whose lower edge is located just below the lower surface of bubble A at 1.49, where
 $\unicode[STIX]{x1D709}=1.0$
(
 $R_{max,A}=1.8$
mm,
 $R_{max,B}=1.8$
mm),
 $l_{0}^{\ast }=0.81$
(
 $l_{0}=2.9$
mm) and
 $\unicode[STIX]{x0394}\unicode[STIX]{x1D703}^{\ast }=0.4$
(
 $T_{A}=331~\unicode[STIX]{x03BC}\text{s}$
,
 $\unicode[STIX]{x0394}T=130~\unicode[STIX]{x03BC}\text{s}$
). Panel (
 $b$
) shows a pronounced compression of bubble B, resulting in a splitting phenomenon, with
 $\unicode[STIX]{x1D709}=1.0$
(
 $R_{max,A}=2.2$
mm,
 $R_{max,B}=2.1$
mm),
 $l_{0}^{\ast }=0.72$
(
 $l_{0}=3.1$
mm) and
 $\unicode[STIX]{x0394}\unicode[STIX]{x1D703}^{\ast }=0.5$
(
 $T_{A}=400~\unicode[STIX]{x03BC}\text{s}$
,
 $\unicode[STIX]{x0394}T=200~\unicode[STIX]{x03BC}\text{s}$
), where the first frame is taken at the dimensionless time 1.56 (i.e. 340
 $\unicode[STIX]{x03BC}\text{s}$
) after the generation of bubble A. The white scale bars denote 1 mm.

As explained for strong interactions between two bubbles in figure 6, a fine jet can be formed in bubble B. However, FJ can also form under weak interactions between two bubbles, as demonstrated in § 3.1.1. This suggests that two mechanisms may be possible for FJ formation. Recently, FJ formation in the second bubble was investigated by Han et al. (Reference Han, Köhler, Jungnickel, Mettin, Lauterborn and Vogel2015) in detail. They elucidated the jet characteristics for the specified parameter combinations of
 $\unicode[STIX]{x1D709}=1.0$
and
 $\unicode[STIX]{x0394}\unicode[STIX]{x1D703}^{\ast }=0.5$
. In this section, we discuss the formation mechanisms of two types of FJs.
First, we refer to jet formation caused by weak interactions between two bubbles. As observed in figure 3, no bubble penetration occurs in this situation, and no bubble separation occurs in bubble B. An FJ is formed inside bubble B during the rebound process of the toroidal bubble A. Therefore, the lower surface of bubble B reacts to the combined flow effects of the radial flow induced by the rebound of the toroidal bubble A and that induced by the shock waves emitted from the rebound of the toroidal bubble A. Once the convex lower surface of bubble B interacts with this combined flow, a local high-pressure region may be created at the lowest surface of bubble B, because the distance from the rebounding bubble A is the shortest there. As a result of the shaped charge effect (Tulin Reference Tulin1969; Dear & Field Reference Dear and Field1988), a fine jet is formed inside the bubble B.
Next, we consider jets produced in the case of strong interactions between two bubbles. As schematically shown in figure 6, bubble penetration inevitably occurs. Two types of shape change can occur for the lower part of bubble B. Figure 14 shows two typical examples of this bubble topology. Panel (
 $a$
) represents a case approaching a critical situation for bubble B, in which the bubble never separates, but bubble penetration occurs. The lower part of bubble B becomes greatly stretched by the flow involved in the collapse of the toroidal bubble A. The bottom of the lower part of bubble B is located slightly below the lower surface of bubble A, as indicated at 1.49, where the surface of the toroidal bubble A is smooth because the disturbances originating from the jet impact point are not fully spread over the surface of the collapsing toroidal bubble A. As the toroidal bubble A expands quickly, the surface becomes rougher; subsequently, light is scattered on the bubble surface. Consequently, the motion of the tip of bubble B is suddenly directed upward between 1.49 and 1.55. This change in direction is caused by the combined effect of the stagnation pressure, induced by the flow produced during the toroidal bubble A’s rebound, and an upward force from the Laplace pressure at the lower tip of bubble B, whose radius of curvature is measured as approximately 0.06 mm, yielding 2.4 kPa. A very fine jet can be seen inside bubble B. In panel (
 $b$
), with
 $l_{0}^{\ast }=0.72$
, the two bubbles are closer compared to those in case (
 $a$
), and they begin to interact soon after bubble A reaches its maximum volume. Obviously, the surface shape of bubble A becomes complicated after the jet impact, and the subsequent penetration makes the surface significantly rougher. Looking at the most constricted part of bubble B in panel (
 $b$
), we notice that it is located at the central part of the toroidal bubble A, as seen at 1.61. Clearly, the cross-sectional diameter of bubble B increases as distance increases from the thinnest part of the bubble in both upward and downward directions. Thus, the thinnest part of bubble B becomes separated into two parts during the rebound of toroidal bubble A, i.e. between 1.61 and 1.65. A very fine jet can be observed inside bubble B at 1.65, directed upward.
Similar physical phenomena occur during the splitting of the bubble into two smaller parts, the formation of fine high-speed jets from both parts, and the rapid contraction of these jets. For instance, when two simultaneously generated cavitation bubbles of different sizes collapse near a solid boundary, pinch-off occurs during the collapse if a smaller bubble is located nearer to the boundary (Blake et al. Reference Blake, Robinson, Shima and Tomita1993). Another example of the pinch-off phenomenon is associated with the impact of a drop on a free surface under specific conditions in the so-called irregular region (Pumphrey & Elmore Reference Pumphrey and Elmore1990). An isolated air bubble containing a fine jet is created and oscillates in water to generate a sound, which contributes to the sound of the traditional Japanese music device called a suikinkutsu (Tomita, Saito & Ganbara Reference Tomita, Saito and Ganbara2007). The other separated part, located at the centre of the dented free surface moves upward very quickly accompanied by a high-speed Worthington jet (Gekle & Gordillo Reference Gekle and Gordillo2010; Gordillo & Gekle Reference Gordillo and Gekle2010).
Finally, we note that methods using pulsed jets formed in bubble A would be more effective for tandem-bubble sonoporation because the jet impact point and time could be accurately obtained by employing an adequate combination of the three parameters
 $\unicode[STIX]{x1D709}$
,
 $l_{0}^{\ast }$
, and
 $\unicode[STIX]{x0394}\unicode[STIX]{x1D703}^{\ast }$
. In contrast, a jet formed in bubble B, moving in the direction opposite that of the jet formed in bubble A, has a much higher velocity. However, in medical applications, a bubble is likely to be surrounded by various boundaries. Jet deflection may be caused by the influence of the dynamic natures of the bio-material boundaries, as well as the distances from the bubble to each boundary surface. Therefore, it is difficult to determine an accurate jet impact position by studying a jet obtained only in an unbounded state.
4 Conclusions
For two tandem bubbles produced at different times, a strong interaction occurred for the bubble distance
 $l_{0}^{\ast }<1$
, followed by a series of phenomena including bubble penetration, jet formation, toroidal bubble collapse and high-speed fine jet formation. We observed the phenomenon of bubble penetration for parameter conditions of the birth-time difference range
 $0.1<\unicode[STIX]{x0394}\unicode[STIX]{x1D703}^{\ast }<0.6$
and the bubble size ratio values within the range
 $1<\unicode[STIX]{x1D709}<1.7$
, although bubble penetration also occurred in the range of
 $\unicode[STIX]{x0394}\unicode[STIX]{x1D703}^{\ast }>0.2$
for
 $\unicode[STIX]{x1D709}\leqslant 1$
.
A conical pulsed jet formed within the bubble that was generated first (bubble A); the jet was driven by the accelerated water motion induced by significant growth of the delayed-generation bubble (bubble B). This mechanism of pulsed jet formation seemed similar to that of a water spike developing from a deformed free surface when a single bubble is grown near the free surface, although the gas pressures around the jets are different: the gas pressure inside bubble A is lower than the atmospheric pressure for the case of two bubbles, but is equal to the atmospheric pressure for the case of a single bubble near a free surface. Pulsed jets with initially conical tip shapes, consisting of confined volumes of water, were generated in a range of parameters, i.e.
 $0.7<\unicode[STIX]{x1D709}\leqslant 1.6$
,
 $0.6\leqslant l_{0}^{\ast }<1$
, and
 $\unicode[STIX]{x0394}\unicode[STIX]{x1D703}_{c}^{\ast }<\unicode[STIX]{x0394}\unicode[STIX]{x1D703}^{\ast }<0.6$
(
 $\unicode[STIX]{x0394}\unicode[STIX]{x1D703}_{c}^{\ast }$
being the critical birth-time difference, estimated to be in the range of
 $0.027<\unicode[STIX]{x0394}\unicode[STIX]{x1D703}_{c}^{\ast }<0.12$
). The jet velocity was predominantly influenced by the interaction parameters
 $l_{0}^{\ast }$
and
 $\unicode[STIX]{x1D709}$
. For larger values of
 $\unicode[STIX]{x1D709}$
or smaller values of
 $l_{0}^{\ast }$
, quasi-confined water regions were attained earlier. The jet velocity was weakly affected by
 $\unicode[STIX]{x0394}\unicode[STIX]{x1D703}^{\ast }$
in the range of
 $\unicode[STIX]{x0394}\unicode[STIX]{x1D703}^{\ast }>\unicode[STIX]{x0394}\unicode[STIX]{x1D703}_{c}^{\ast }$
, but the jet impact time showed a strong dependence on
 $\unicode[STIX]{x0394}\unicode[STIX]{x1D703}^{\ast }$
. The interaction parameters could be selected to determine the optimum jet impact time
 $t_{imp}^{\ast }=0.915$
, corresponding to
 $\unicode[STIX]{x0394}t_{imp}^{\ast }=$
0, at which a jet could impact the lower surface of bubble A exactly when bubble A reached its maximum volume; if a cell is present, the lowest surface of bubble A might be in contact with the membrane surface. We obtained the optimum condition of
 $\unicode[STIX]{x0394}\unicode[STIX]{x1D703}^{\ast }=0.2$
for the parameter combination
 $\unicode[STIX]{x1D709}=1$
and
 $l_{0}^{\ast }=0.75$
. If
 $\unicode[STIX]{x1D709}>1$
, the optimum value of
 $\unicode[STIX]{x0394}\unicode[STIX]{x1D703}^{\ast }$
shifted to a value greater than 0.2.
Wide jets were formed when two equal-sized bubbles were generated with
 $\unicode[STIX]{x0394}\unicode[STIX]{x1D703}^{\ast }=0.5$
. The same shape was created when the parameter combinations satisfied the conditions
 $\unicode[STIX]{x1D709}\geqslant 1.6$
and
 $l_{0}^{\ast }\leqslant 0.5$
. In these cases, small volumes of water, initially drawn into the narrower regions between the lower surfaces of the delayed bubbles and the upper surfaces of the first generated bubbles, were entirely transformed into mist.
In conclusion, various properties of fluid jets driven by two cavitation bubbles can be controlled by changing the interaction parameters
 $\unicode[STIX]{x1D709}$
,
 $l_{0}^{\ast }$
and
 $\unicode[STIX]{x0394}\unicode[STIX]{x1D703}^{\ast }$
of the bubbles. A jet produced in the first of a pair of tandem bubbles could be accurately created at a defined position and time, thus enabling optimal jet impact conditions. Pulsed jets could be useful in the application of tandem-bubble sonoporation.
Acknowledgements
The authors would like to express their thanks to the referees for their enduring and constructive criticisms. They also express their gratitude to Professor E. A. Shima of Tohoku University for his encouragement while conducting this study. K.S. acknowledges funding support from MEXT (MEXT-Supported Program for the Strategic Research Foundation at Private Universities, Functional Microstructured Surfaces Research Centre of Kogakuin University) and Grant-in-Aid for Scientific Research 15K05807.
Appendix
Because the duration of plasma luminescence was very short, i.e. less than 1
 $\unicode[STIX]{x03BC}\text{s}$
(Tomita, Tsubota & An-Naka Reference Tomita, Tsubota and An-Naka2003), for the bubble radii (0.83–3.4 mm) employed in the present experiment, we considered the appearance of emitted light in a frame as indicative of the instant of bubble generation. Here, we define that the maximum radius,
 $R_{max,i}$
(
 $i=\text{A}$
or B), of the two bubbles is similar to that of a single bubble attained without the influence of a nearby bubble generated by the supplied laser energy. To confirm the periodic features of single laser-induced bubbles, we tried to record the time history of bubble motion precisely, from the birth of the bubble to its minimum volume passing through the maximum state. We obtained many high-speed photographs, each of which captured plasma luminescence within a certain frame; hence, we could fix the birth time of each bubble. As a result, we generated a
 $R_{10}$
–
 $R_{max}$
diagram, where
 $R_{10}$
is the bubble radius at 10
 $\unicode[STIX]{x03BC}\text{s}$
after the occurrence of plasma luminescence. This time period corresponds to the inter-frame time at the framing rate of 100 000 f.p.s. It should be noted that the maximum bubble radius must be related to the laser energy. When two bubbles are generated within a short distance, interaction is observed between them, including notable bubble deformation. However, Hsiao et al. (Reference Hsiao, Choi, Singh, Chahine, Hay, Ilinskii, Zabolotskaya, Hamilton, Sankin, Yuan and Zhong2013) numerically calculated the deformation for two tandem bubbles, observing an increment of 0.1 %–5 % in the bubble radius at the maximum bubble volume for a wide range of initial gas pressures in the range of 2–886 atm. (202.7 kPa–89.8 MPa). Therefore, several data sets from two-bubble experiments were also included to create the diagram of the
 $R_{10}$
–
 $R_{max}$
relation. Figure 15 shows the result obtained by employing 26 data points (16 data samples from single-bubble experiments and 10 data samples from those with two bubbles), where the value of
 $R_{max}$
ranges from 0.33 to 1.6 mm. White circles (○) denote the data for the single-bubble experiments, while solid circles (●) indicate the data for one bubble selected from the two-bubble experiments. The solid line denotes the numerical result of the
 $R_{10}$
–
 $R_{max}$
relationship, for which the Rayleigh solution (Rayleigh Reference Rayleigh1917) during the collapse phase is inversely applied to the growth period. The Rayleigh solution is terminated at the maximum radius of 0.11 mm. This limited radius,
 $R_{max,c}$
, is necessarily related to the temporal restriction of the frame interval, 10
 $\unicode[STIX]{x03BC}\text{s}$
, obtained as
 $R_{max,c}=R_{10,c}$
. The corresponding linear velocity
 $V_{0,c}$
is 11
 $\text{m}~\text{s}^{-1}$
.
Relationship between the maximum bubble radius,
 $R_{max}$
, and the bubble radius 10
 $\unicode[STIX]{x03BC}\text{s}$
after plasma luminescence,
 $R_{10}$
. ○: single bubble; ●: one of two bubbles; ——: theoretical result (Rayleigh bubble).

The experimental data are spread around the solid line with some uncertainty; it may be true that the laser-induced bubbles behave almost identically to Rayleigh bubbles. The maximum deviation in
 $R_{max}$
between the Rayleigh bubbles and the experimental values is 10 %, although this is reduced to less than 8 % when the conditions are limited to
 $R_{max}\geqslant 0.8$
mm, as employed in the present experiment. Thus, for a known birth time of bubble A and bubble radius at
 $t=\unicode[STIX]{x0394}T$
, where
 $t$
is the time measured from the instance of bubble generation and
 $\unicode[STIX]{x0394}T$
is the time difference between the two bubble generation times, the time history of bubble A as a Rayleigh bubble can be traced. This allows us to obtain the maximum bubble radius
 $R_{max,A}$
. In cases where the instant of plasma luminescence corresponding to bubble B could not be captured in any of the frames, we took the three frames beginning with the frame in which bubble B first appears to accurately decide its birth time by extrapolation. Then, knowing the time difference
 $\unicode[STIX]{x0394}T$
, we estimated the birth time of bubble A and its radius at time
 $t$
. Although there are two possible time solutions for a given radius
 $R(t)$
during the period of a Rayleigh bubble, we can choose the correct dimensionless time in the region either
 ${<}0.5$
or
 ${>}0.5$
by considering values such as the time difference
 $\unicode[STIX]{x0394}T$
and the supplied laser energy. In addition, we can set the maximum radius,
 $R_{max,B}$
, by assuming that the bubble B grows considerably without the influence of the nearby bubble A during the first 10
 $\unicode[STIX]{x03BC}\text{s}$
after its birth.