Introduction
In his widely cited chapter, ‘East Asia: The Limits of Productivist Regimes’, Ian Gough (Reference Gough, Gough and Wood2004) argued that the critical feature of social policy in the region is its emphasis on social investment rather than social protection, but also that this specific policy focus is increasingly challenged in the aftermath of the 1997 Asian financial crisis. More precisely, Gough (Reference Gough, Gough and Wood2004) highlighted declines in East Asian corporate welfare, the challenges to familial welfare posed by ageing societies, and the widening gap between the rich and poor, which he posited, would lead to two possible trajectories of welfare development: first, a market-centred and workfarist path towards more privatisation and informalisation of service provision, or second, a path towards higher public investment into individuals’ and households’ productive assets, but also higher degrees of redistribution, and a more equitable market system.
Following Gough (Reference Gough, Gough and Wood2004), the burgeoning interest in the dynamics and determinants of social policy change across East Asia has triggered a move away from the static ‘welfare modelling business’ towards more dynamic approaches to studying East Asian welfare models (for early examples see, e.g. Holliday, Reference Holliday2005; Wilding, Reference Wilding2008). Thereby, the questions whether, and to what extent, East Asian governments have moved beyond the productivist paradigm are essentially about how we might best establish the direction and depth of contemporary reform processes. Indeed, comparative social policy analysis, more generally, has often suffered from the so-called ‘dependent variable problem’, which comprises two key issues: how best to conceptualise processes of welfare state development, and how to adequately measure them (Green-Pedersen, Reference Green-Pedersen2004; Kühner, Reference Kühner, Irving, Fenger and Hudson2015). Qualitative small-N studies have tended to focus on the theoretical definition of welfare development but have struggled to incorporate robust synchronic and diachronic quantitative measurements of welfare development. In contrast, quantitatively-informed medium-N research has often been forced to make use of second-best input and outcome measures, and to limit analysis to specific social policy areas, e.g. social security (Hudson and Kühner, Reference Hudson and Kühner2012).
In order to examine the welfare development of six East Asian societies, Mainland China (henceforth: China), Hong Kong SAR (henceforth: Hong Kong), Japan, South Korea (henceforth: Korea), Singapore, and Taiwan ROC (henceforth: Taiwan), this article directly builds on the conceptual East Asian welfare models previously discussed elsewhere (Yang, Reference Yang2017). Given the vast literature stressing the multidimensional nature of welfare state development, we employ fuzzy-set ideal type analysis (FSITA) since it has a particular strength in dealing with case diversity in comparative research designs (Hudson and Kühner, Reference Hudson and Kühner2010). More specifically, we employ FSITA to conceptually distinguish between distinct types of welfare state development, namely quantitative, type-specific, and radical, across East Asia over the last three decades (1990–2016).
Conceptualising the East Asian welfare regime
Most studies agree that what sets the productivist East Asian welfare regime apart is a growth-oriented strategy, in which social policies – alongside public economic and industrial policy – are designed to achieve the overarching goals of securing economic development and international competitiveness (Hudson et al., Reference Hudson, Kühner and Yang2014). While this does not necessarily manifest as a minimisation of social protection policy in each concrete case (Holliday, Reference Holliday2005), East Asian productivism has generally been summarised as being concerned – first and foremost – with providing flexible labour markets, a sufficient labour supply via investment in human capital and skills production, and social and political stability (Wilding, Reference Wilding2008). It is in this context that Ian Gough (Reference Gough, Gough and Wood2004) argued that the critical feature of social policy in the region is its emphasis on social investment rather than social protection.
Drawing on these discussions, Yang (Reference Yang2017) employed FSITA to identify ideal-types of East Asian welfare models. In distinguishing broadly between the ‘productive’ and ‘protective’ dimensions of welfare (see also: Holliday, Reference Holliday2000; Hudson and Kühner, Reference Hudson and Kühner2012), Yang’s (Reference Yang2017) contribution is to our knowledge the most encompassing empirical study to date, since it includes six welfare policy fields: three productive – i.e. education (E), health care (H), and family policy (F) – and three protective – i.e. old age income protection (I), public rental housing (P), and passive labour market policy (LMP) (L). These six policy areas result in a total of 26 = 64 logically possible ideal types, which cluster into four aggregated welfare models and fifteen welfare sub-models (see Appendix Table 1).
As such, the productive welfare model denotes that a case has significant ‘productive’ features, while its ‘protective’ features are underdeveloped or non-existing. Three sub-models are identified under the ‘productive’ welfare model: the ‘ultimate productive’ and ‘weak productive’ types are purely productive welfare models, both with strong productive features and non-membership of any protective policy areas (∼I∼P∼L); the difference between the two is that the ‘ultimate productive’ type has membership of all ‘productive’ policy areas (EHF), whilst the ‘weak productive’ type only has membership of two productive policy areas (e.g. EH∼F, E∼HF, ∼EHF). Moreover, the ‘hybrid productive model’ has a membership to all three ‘productive’ policy areas, in addition to membership of one ‘protective’ policy domain (I, P, or L). The ‘protective’ welfare model and its three sub-models follow the same principle, albeit emphasising membership within the ‘protective’ rather than the ‘productive’ policy areas. For instance, the ‘ultimate protective’ welfare model is similar to the ‘ultimate productive’ model, in that is has a membership of all protective sets (IPL) and non-membership of any of the productive sets (∼E∼H∼F).
The ‘balanced’ welfare model generally combines membership of the ‘productive’ and ‘protective’ dimensions. The ‘ultimate balanced’ model is the extreme version of the balanced model with a membership of all the six policy areas (EHFIPL). The ‘weak balanced’ model is a downgraded version with a membership of two out of the three ‘productive’ and two out of three ‘protective’ sets. The ‘elementary balanced’ model is a downgraded version of the ‘weak balanced’ model with a membership of only one out of three ‘productive’ and one out of three ‘protective’ sets. Moreover, the ‘productive balanced’ and ‘weak productive balanced’ models have membership of more ‘productive’ than ‘protective’ sets: the ‘productive balanced’ type is characterised by membership of three ‘productive’ and two ‘protective’ policy areas; whereas the ‘weak productive balanced’ model features membership of two out of three ‘productive’ and one out of three ‘protective’ policy areas. Once more, the ‘protective balanced’ and the ‘weak protective balanced’ models follow the same logic. Finally, the ‘underdeveloped’ welfare model denotes cases, which feature membership in merely one or none of the six ‘productive’ and ‘protective’ policy areas.
Operationalising the fuzzy sets
Before researchers can classify cases within the East Asian welfare regime with fuzzy sets, calibration of raw data is essential to determine the degrees of set membership to each policy domain. Three qualitative breakpoints, i.e. ‘1.00’, ‘.50’, and ‘.00’, refer to whether a case is ‘fully-in’, ‘neither in nor out’ or ‘fully-out’ of a set, respectively. For instance, if a case scores ‘1.00’ in the education set (E), it means this case has a comparatively ‘strong’ education policy; if a case scores ‘.00’ in the health care set (H), it means this case has a comparatively ‘weak’ health care provision. FSITA researchers have to decide the benchmark for a ‘strong’ or ‘weak’ welfare provision not merely based on sample characteristics, but according to theoretical and substantive case knowledge (Ragin, Reference Ragin2000). However, since in most cases, there is no clear guidebook for what can be understood as a ‘strong’ or ‘weak’ welfare service, this benchmarking exercise is not always straightforward.
Here again, Yang (Reference Yang2017) determined forty-six cut-off points in total for full membership (‘1.00’), full non-membership (‘.00’), and the crossover point between membership and non-membership (‘.50’) for the six policy areas (E, H, F, I, P, and L). She thereby used three main strategies to achieve robust calibrations of sets: (i) a comparison and combination of raw indicators taken from statistical databases published by the OECD, the World Bank, and the Asian Development Bank; (ii) conventions of international organisations, such as the International Labour Organisation; and (iii) case knowledge. More detailed explanations of all calibration decisions, including the selection of indicators, are available in supplementary material for this article.
Finally, different rules exist to combine fuzzy-set scores of various indicators into a single conjunction. In the present article, the set membership to four out of the six policy areas was conceptualised using the so-called ‘intersection rule’. In other words, a ‘strong’ education policy, for instance, is expressed as the ideal-typical location of SPENDING * GENEROSITY * ACCESSIBILITY – or in plain English, by high public spending on education, a generous mandatory education service, and easy access to higher education. Thereby, a strong performance for one of these indicators cannot compensate for weak performance in one or all other indicators. Consequently, we argue it would be problematic to label as ‘strong’ an education system that invests considerable public funds into education (SPENDING), and offers free compulsory education at primary and secondary level (GENEROSITY), only to prevent a large share of young people to study at undergraduate level or beyond, due to high tuition fees and a lack of sufficient student loans (∼ACCESSIBILITY). The same rationale was used to justify the use of the ‘intersection rule’ for the health, old-age income protection, and passive LMP policy areas, respectively.
By contrast, for family policy (F) the ‘average function’ across the dimensions GENEROSITY * DURATION * ACCESSIBILITY of maternity leave structures was used to determine the overall fuzzy membership score. In other words, the set membership score of the ‘strong’ family policy (F) set was computed as the mean score of the three family policy indicators. Given the regional importance of filial piety and the role of familistic welfare across East Asian societies (Abrahamson, Reference Abrahamson2017; Papadopoulos and Roumpakis, Reference Papadopoulos and Roumpakis2017), a more ‘generous’ consideration – since it allows for compensation effects and therefore more likely results in higher membership scores in the combined set – seemed justifiable. Finally, due to the dearth of systematic time-series data, set membership scores about the public housing (P) domain were determined entirely based on case knowledge and distinguished between different levels of development of the public rental housing sector across East Asian cases. We encourage readers to keep these differences in mind for the subsequent interpretation of findings.
Examining East Asian welfare development with fuzzy sets
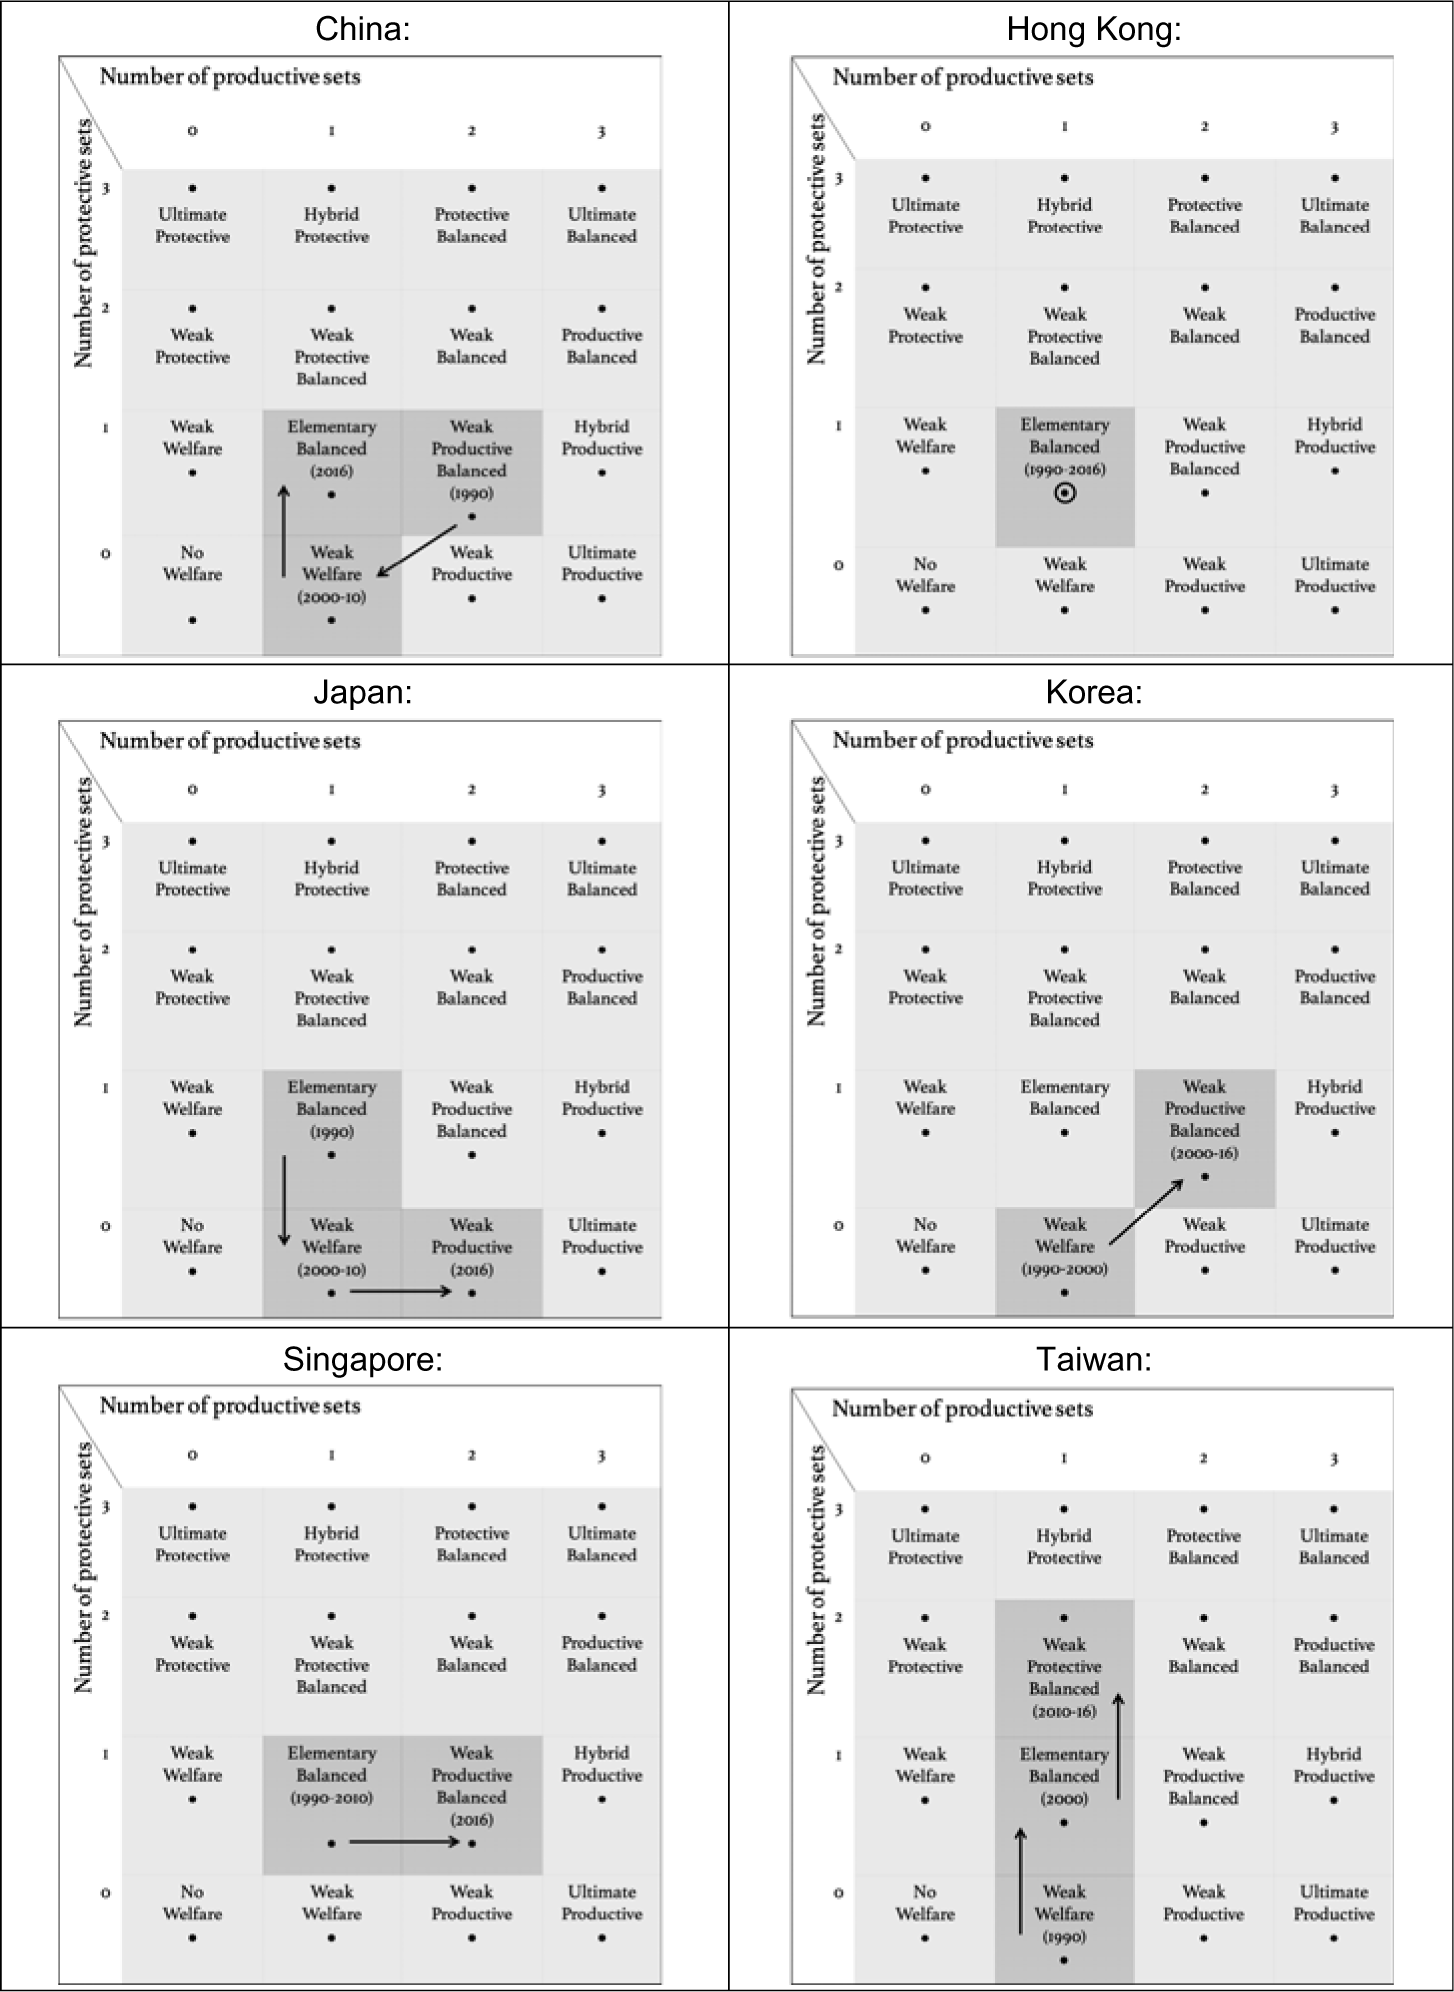
Comparative welfare research has been preoccupied with devising ways to distinguish quantitative, incremental welfare state changes from more qualitative, structural ones (see, e.g. Vis, Reference Vis2008). In this article, we identify three distinct types of welfare state development, which are determined via changing membership to the welfare models or sub-models within the conceptual East Asian welfare regime outlined above. First, a quantitative change refers to expansion or retrenchment of welfare policy that leads to a change in a case’s membership of a welfare sub-model, but not to a change of the welfare sub-model. Second, a case moving from one welfare model to another (e.g. from ‘underdeveloped’ to ‘balanced’; or from ‘productive’ to ‘protective’) defines a radical change. Third, a type-specific change is occurring when a case moves from one welfare sub-model to another but remains within the same model of welfare (e.g. from ‘weak protective’ to ‘hybrid protective’; or from ‘productive balanced’ to ‘protective balanced’). In the following, we consider each East Asian case individually to determine the direction and depth of the comparative East Asian welfare trajectories using these distinct types of welfare development (Figure 1).
China
China shifted from a ‘weak productive balanced’ model (E∼HF∼IP∼L) in 1990 to a ‘weak welfare’ model (∼E∼HF∼I∼P∼L) in 2010 and then reverted to an ‘elementary balanced model’ (∼E∼HF∼IP∼L) in 2016. These two radical shifts in the Chinese welfare model can be explained by retrenchments of the overall fuzzy membership scores for education (from ‘.75’ to ‘.45’) and public housing (from ‘1.00’ to ‘.48’) during 1990–2000, followed by an expansion of old-age income protection (‘.00’ to ‘.80’) after 2010. Quantitative expansions of passive LMP during the observed period suggest this domain is at the cusp of fuzzy set membership (‘.49’) and a further type-specific shift towards a ‘weak protective balanced’ welfare model is achievable with only moderate extensions of the COVERAGE in this policy domain.
A series of reforms, which enhanced the prominence of fee-charging and the internal competition among educational institutions, have marketised China’s education service (Mok, Reference Mok2000). Changes in higher education financing affected the ACCESSIBILITY of tertiary institutions, which went from being ‘fully in’ (‘1.00’) the education set in 1990 to ‘fairly out’ (‘.40’) in 2000. Similarly, public expenditure on education policy decreased from 19.36 per cent of total public spending in 1990 to 14.95 per cent in 2016 (China National Bureau of Statistics, 2019), which resulted in the SPENDING membership score changing from ‘.93’ (‘almost fully in’) in 1990 to ‘.49’ (‘fairly out’) in 2010.
Before the reform of the housing system in China, the public sector owned almost 90 per cent of the urban housing stock, including state work units, municipal housing bureaus and urban collectives. The work units stopped supplying housing to employers, and house prices increased dramatically; at the same time, the development of public rental housing proved to be extremely slow during the 2000s (Wang, Reference Wang, Groves, Murie and Watson2007). The Chinese Communist Party (CCP) responded to this challenge by introducing a Rental Housing Guarantee Plan (2009), which has since resulted in a gradual increase in the supply of public rental housing.
China launched significant reforms to replace the old work-unit based pension system with a new insurance-based one. This reform resulted in an increase in the COVERAGE of mandatory pensions from merely 10 per cent in 1990 (‘fully out’) to 89 per cent in 2016 (‘almost fully in’). This increase was accompanied with fairly robust average net replacement rates of old-age pensions, while the basic pension scheme expanded coverage to 88,777 million individuals in 2016, which was roughly 88 per cent of the total working-age population. Overall, the Chinese old-age income protection went from being ‘almost fully out’ (‘.09’) of the ‘strong old-age pension’ fuzzy set in 1990 to ‘almost fully in’ (‘.80’) in 2016.
Despite high scores of the GENEROSITY and DURATION of the passive LMP, the relatively low COVERAGE meant that the combined passive LMP (L) remained ‘fairly out’ (‘.49’) of fuzzy set membership according to our analysis. There is an important caveat, in that the latest available coverage data included in our analysis is for the year 2012; we cannot rule out that further improvements might have already resulted in China joining the cases with relatively ‘strong’ passive LMP, and, thus, the ‘weak protective balanced’ model (∼E∼HF∼IPL) in 2016.
Finally, in December 2015, the Chinese government made changes to maternity leave structures in responding to the implementation of the universal, two-child policy a few months earlier that year. While maintaining the GENEROSITY (‘fully in’) and ACCESSIBILITY (‘more or less in’) of previous decades, the length of maternity leave was extended resulting in most provinces granting more than eighteen weeks of paid leave for female employees (up to 158 days in, e.g. Hebei, Shanxi, Inner Mongolia, Jilin, Anhui, Jiangxi; and one year in Tibet). While just meeting the minimum maternity leave standards stipulated by the International Labour Organisation (ILO), these policy measures implemented by the different local governments to extend the DURATION of maternity leave meant that, by 2016, China reached the highest overall fuzzy-set membership score of all East Asian cases observed in this article (‘.72’ – ‘fairly in the set’).
East Asian welfare development trajectory, 1990–2016

Hong Kong
Hong Kong is the only case in our analysis that was characterised by the same welfare model throughout the past three decades: namely, the ‘elementary balanced’ model (E∼H∼F∼IP∼L). As such, the welfare development in Hong Kong featured modest quantitative increases in spending on education and health care services primarily, alongside modest quantitative expansions of social rights in old-age income protection during the period 1990–2016. In other words, although there has been substantial social policy activity in Hong Kong, the overall impact of those changes to the status quo has been muted.
For instance, while tuition fees for tertiary education increased dramatically from HK$8,700 to HK$42,100 at the end of the 1990s, the Hong Kong government started to offer student loans to cover fees and living costs, which buffered the adverse effects on the ACCESSIBILITY of tertiary education, which might otherwise have occurred. As a consequence, the overall fuzzy set score for the education policy domain did not change significantly between 1990 and 2016 (from ‘.75’ to ‘.73’ – ‘fairly in the set’). Similarly, despite a great deal of policy innovation in the fields of old-age income protection and passive LMP, the Hong Kong welfare model is still widely characterised by a predominantly residual approach to social security, and relatively low fuzzy-set membership scores accordingly (‘.28’ and ‘.00’, respectively).
For the former, the introduction of the contributory Mandatory Provident Fund during the 2000s led to an increase of old age pension UNIVERSALITY (‘almost fully in’), but not its GENEROSITY (‘mostly out’); for the latter, GENEROSITY, DURATION, and COVERAGE scores have remained ‘almost fully out’ or ‘fully out’ of the respective fuzzy sets. Similarly, the AFFORDABILITY of health services (‘almost fully out’) and the DURATION of maternity leave (‘fully out’) continue to present critical challenges for Hong Kong policymakers. Private health expenditure continued to make up roughly 50 per cent of the total health expenditure – i.e. ‘almost fully out’ of the AFFORDABILITY set – despite a heavily subsidised public health care system in Hong Kong.
Japan
Japan’s welfare model initially featured ‘elementary balanced’ (∼EH∼F∼IP∼L) characteristics with relatively strong health care and housing services; between 2000 and 2010 Japan experienced a radical welfare state change as it moved towards a ‘weak welfare’ (∼EH∼F∼I∼P∼L) model due to retrenchment of the public housing system (from ‘.53’ to ‘.45’). However, recent changes in parental leave legislation suggest that Japan has, yet again, left her overall ‘underdeveloped’ welfare model, and in doing so sharpened the ‘productive’ elements of welfare policy despite a continuing comparative weakness in education services (∼EHF∼I∼P∼L).
Japan’s low ACCESSIBILITY scores (from ‘.00’ in 1990 to ‘.17’ in 2000) of higher education services are the result of high tertiary tuition fees, a high level of funding for tertiary education coming from private households, and a highly-selective system of financial aid for students. Recent reforms in Japan to introduce a grant-type scholarship scheme, more interest-free student loans, and an income-based repayment system, helped to alleviate these pressures, but Japan remained ‘more or less out’ of the ACCESSIBILITY (‘.45’). Public investment in education services reduced drastically from 16 per cent of total government expenditure in 1990 to 8 per cent in 2016, which meant Japan had fallen significantly behind the other East Asian societies observed in this article.
Japan experienced privatisation of public housing provision from the 1990s onwards, while the requirements for applying for public housing became stricter (Hirayama, Reference Hirayama, Groves, Murie and Watson2007). The resulting fall in the ratio of PUBLIC HOUSING is reflected in the reduction of the fuzzy set score from ‘.53’ (‘more or less in’) in 1990 to ‘.45’ (‘fairly out’) in 2016. A revision of the Safety Net Law was passed in 2017 to facilitate access to public rental housing, but the effect of this legislative change is not yet reflected in our data. As for the other ‘protective’ dimensions of welfare policy, strict eligibility criteria of passive LMP (‘0.13’- ‘almost fully out’), and low GENEROSITY of old-age income protection (‘.33’ – ‘mostly out’) limit the social rights in both policy areas in different ways.
Japan’s public health care system is the most advanced compared to all other East Asian societies observed in this article. Japan had experienced a continuing increase of SPENDING on health care from 16 per cent of total government expenditure in 1990 to 23 per cent in 2016 (‘fully in’). At the same time, the share of private health expenditure in Japan was generally below 20 per cent of the total health expenditure between 1990 and 2016, which made the Japanese health care system considerably more AFFORDABLE than in other East Asian societies.
The replacement income during maternity leave in Japan increased to two-thirds in 2007 (albeit for a relatively short duration of 14 weeks), but the real significant change in family policy in Japan was the increase in parental leave provision particularly for fathers during the 2010s (OECD, 2019a). By 2016, Japan had the most substantial full-rate equivalent of paid parental and home care leave reserved for fathers of any OECD country (30.4 weeks). The issue of non-take up is well documented, and the fuzzy set membership merely considers the formal rights to parental leave. Given that sole consideration of maternity leave provision would misrepresent the changes in family policy intent, we assigned a fuzzy set score of ‘.55’ (‘more or less in’) to reflect the overall trajectory of the Japanese family policies.
Korea
Korea’s welfare system moved from a ‘weak welfare’ (∼E∼HF∼I∼P∼L) to a ‘weak productive balanced’ model (E∼HF∼IP∼L) between 1990 and 2016. This shift was caused by a series of significant expansions in social provision mainly during the 2000s. Four out of six welfare dimensions raised their overall fuzzy-set scores throughout the last three decades resulting in education, family, and public rental housing policy indicating relatively strong characteristics with fuzzy scores between ‘.54’ and ‘.60’ (‘more or less in’), respectively. Further moderate improvements of old-age income protection and passive LMP – both were ‘just out of’ their respective sets with scores of ‘.46’ and ‘.48’ – might result in the Korean welfare model further shifting towards a ‘weak balanced’ or ‘protective balanced’ model.
Both the GENEROSITY (‘.32’ in 1990 to ‘.82’ in 2016) and ACCESSIBILITY (‘.15’ in 1990 to ‘.85’ in 2016) scores of the Korean education system increased through the extension of mandatory education from six years to nine years in 2004, the introduction of income-contingent student loans in 2010, and the introduction of national scholarships in 2012. Several public rental programmes were introduced between 1990 and 2010, which pushed the membership score for Korea’s PUBLIC HOUSING past the ‘.50’-threshold in 2010 (Brhane et al., Reference Brhane, Mason and Payne2014). Maternity leave in Korea has been comparatively GENEROUS (‘1.00’) and ACCESSIBLE (‘.70’), but the real policy innovation was the recent expansion of parental leave, especially for fathers. Together with Japan, Korea has become a leader in the rich world in this regard – at least on paper (OECD, 2019a).
The introduction of the Employment Insurance System in 1997 increased the COVERAGE of passive LMP (from 26 per cent in 1998 to 47 per cent by 2010), its GENEROSITY (the initial net replacement rate is generally >90 per cent of the minimum wage for most family-types) and DURATION (90 days for those contributing for less than one year) (Kim, Reference Kim2010; OECD, 2019c). Moreover, Korea introduced a non-contributory pension programme, which resulted in an increase of old-age income protection UNIVERSALITY from ‘.15’ (‘almost fully out’) in 1990 to ‘.94’ (‘almost fully in’) in 2016 (Kim, Reference Kim and Park2012). Although our data suggest that improvements in health care services are lagging, this result is mainly caused by a persistently high – albeit diminishing – level of private health care expenditures. Korea almost doubled public investment in health care services from 7 per cent of all government expenditures in the 1990s to 13 per cent in 2016. This investment resulted in an increase in the fuzzy set score for health care SPENDING from ‘.06’ (‘almost fully out’) to ‘.90’ (‘almost fully in’).
Singapore
The welfare model in Singapore shares many similarities with Hong Kong. However, recent expansions in the duration of maternity leave suggest a type-specific shift away from the ‘elementary balanced’ (E∼H∼F∼IP∼L) towards a ‘weak productive balanced’ (E∼HF∼IP∼L) model of welfare. The duration of the maternity leave policy was extended to sixteen weeks in 2008, while Singapore maintained the replacement rate of 100 per cent throughout the 1990s–2010s and extended maternity leave to single mothers in 2017 (Ministry of Manpower Singapore, 2019). Paid maternity leave was available for more than two children with the abolishment of the two-children policy in 2001. Taken together, these changes resulted in an increase of the family policy fuzzy set membership score from ‘.40’ (‘fairly out’) to ‘.58’ (‘more or less in’).
Other welfare developments in Singapore include a notable increase in public health care spending from 9 per cent of total government expenditure in 1990 to 14 per cent in 2016. At the same time, Singapore has maintained some of the highest shares of private health care spending (around 60 per cent in 2000 and 2010) in the region. Tuition fees for higher education increased dramatically during the 1990s, but continued to be heavily subsidised, which buffered the potential negative impact on the ACCESSIBILITY of education services. The implementation of the Compulsory Education Act in 2003 further enhanced the GENEROSITY of primary and secondary education (‘.78’ – ‘fairly in the set’), while the level SPENDING remained largely robust at a high level (‘.83’ – ‘almost fully in’). Besides the strong PUBLIC HOUSING sector (‘1.00’ – ‘fully in’), Singapore remained the least ‘protective’ welfare system regarding passive LMP (‘.00’ – ‘fully out’) and old-age income protection (‘.00’ – ‘fully out’). The former is explained by the absence of a separate unemployment benefit scheme (although a workfare income supplement scheme exists), while the latter is due to a comparatively weak zero pillar and a non-existent first pillar pensions for the elderly (Lee and Qian, Reference Lee and Qian2017).
Taiwan
Taiwan underwent two significant changes of its welfare model: the first was a radical change from a ‘weak welfare’ (E∼H∼F∼I∼P∼L) to an ‘elementary balanced’ welfare model (E∼H∼F∼I∼PL) in 2000; the second was a type-specific change towards ‘weak protective balanced’ model (E∼H∼FI∼PL) in 2010. Unlike the other cases discussed in this article, successive governments in Taiwan have more clearly emphasised the expansion of ‘protective’ welfare policies, while maintaining relatively strong education service provision.
The official implementation of unemployment benefits in 1999 increased the GENEROSITY (net replacement of 60 per cent of the average wage), DURATION (6 months), and COVERAGE (around 60 per cent of unemployed) of the passive LMP in Taiwan (‘.60’ - ‘more or less in’) (Lee, Reference Lee2000). Moreover, the establishment of a New Labour Pension System in 2005 and the National Pension in 2008 raised the GENEROSITY of the mandatory pension system, which increased the membership of Taiwan’s old-age income protection set (‘.70’ – ‘fairly in the set’). The membership score of Taiwan’s education system increased from ‘.51’ (‘more or less in’) in 1990 to ‘.72’ (‘fairly in’) in 2016 due to ACCESSIBILITY improvements in higher education. More subsidy programmes and student loans were introduced, and the gross tertiary enrolment in Taiwan reached 84 per cent (89 per cent for females) in 2016.
Taiwan’s health care system underwent a major reform with the introduction of the National Health Insurance in 1995. This policy change increased the UNIVERSALITY of the health care system (‘1.00’ – ‘fully in’), while private health expenditures remained comparatively high (AFFORDABILITY: ‘.41’) even in 2016. Finally, the public housing system also improved slightly with the establishment of the Social Housing Promotion Alliance in 2010, but the development of public rental housing units has so far failed to reach the modest goals set by policymakers. Compared to the other policy areas, PUBLIC HOUSING is lagging in relative terms.
Conclusion
Many scholars have continued to question whether it is (still) correct to cluster East Asian societies into one homogeneous welfare regime. The findings of our FSITA suggest that there are essential differences between the welfare systems of East Asian societies, but more importantly that governments have implemented reforms that stress multiple trajectories of welfare development throughout the last three decades. All East Asian societies, except Hong Kong and Singapore, underwent at least one radical change and as a consequence switched between different models of welfare. China, Japan, and Taiwan experienced radical reforms in the period 1990–2000, whereas Korea underwent a radical change of her welfare model in the period 2000–2010; Singapore and Taiwan experienced type-specific changes during the same period. For the latter three countries, further changes in the period 2010–2016 were merely quantitative, i.e. did not result in any further changes of welfare model or sub-model membership, whereas China and Japan experienced further radical welfare reforms during 2010–2016.
We commenced this article by briefly summarising Gough’s (Reference Gough, Gough and Wood2004) prediction that the observed ‘limits of the productivist regimes’ will result in two possible welfare reform trajectories across East Asia, a first path emphasising privatisation and informalisation of welfare services versus a second path that focusses on universalist social investment. The specific welfare development dynamics observed in our FSITA do not suggest any apparent convergence on either of those two policy pathways. Instead, our approach emphasises diversity within and across East Asia societies. Our analysis therefore carries important substantive as well as more methodological implications.
Policymakers in some East Asian societies, such as China and Taiwan, have predominantly focussed social policy expansions on the ‘protective’ welfare areas. This is not to say that investment into ‘productive’ welfare policies did not occur, but these remained mainly quantitative, and therefore not extensive enough to result in a shift of the respective welfare models or welfare sub-models. Moreover, China has experienced considerable retrenchment of education and housing services, suggesting that aggregate evaluations of welfare development in East Asia should be considered with caution.
Some East Asian societies, such as Singapore and Japan, have enhanced their family policies, and in doing so, further developed the ‘productive’ features of their respective welfare models in a radical or type-specific manner. We identified Singapore as having one of the most extensive education services, while Japan continues to stand out in terms of the quality of the health care services. Singapore and Japan are unusual cases since the expansions of family policies are in stark contrast of significant retrenchments (Japan: education and housing) or the maintenance of strictly residual social protection (Singapore: old age and passive LMP) in other areas of welfare. One might suggest that the issues of low fertility and gender inequality have reached a level of pertinence among East Asian policymakers that it trumps existing welfare paradigms, but much more research needs to be done to understand policy choices fully.
Of all the East Asian cases included in this article, it was Korea that managed to ‘balance’ expansions of both ‘productive’ and ‘protective’ policies most successfully. Our findings also indicate that relatively moderate further expansions of several welfare areas will enable further type-specific shifts towards a ‘weak balanced’ or ‘protective balanced’ welfare model in the Korean case. Our findings similarly suggest that Korea has not only managed to balance ‘productive’ and ‘protective’ welfare domains most successfully since the 1990s but also because it quantitatively covered the longest distance in doing so (i.e. the increase in fuzzy-set scores across all domains was most extensive in Korea). The only other cases where such a trajectory seems likely in the short or medium-term are China and Taiwan where several ‘productive’ policy areas (China: education, housing, and passive LMP; Taiwan: health and family) have been approaching the ‘.50’ threshold of fuzzy-set membership. Singapore is seemingly successful in combining ‘productive’ and ‘protective’ elements of welfare policy, but the very residual nature of old age income protection and passive LMP, together with the considerable private expenditure on health care, make it less likely that Singapore will experience further radical welfare development in the near future. Positive lesson drawing might potentially trigger a re-thinking of social policymaking in Singapore and elsewhere in East Asia. Our findings largely concur with the Asian Development Bank (ADB, 2013) and its notion that Korea should be considered the ‘best practice’ case for policymakers in the region.
Finally, although Japan remains the biggest gross and net spender on social protection in East Asia – almost double the amount of Korea if measured as a share of GDP (OECD, 2019b) – the dynamics of social expenditure on its own is an insufficient analytical yardstick to assess welfare development across East Asia. The absence of readily available social rights statistics will, for the time being, remain a crucial challenge for social policy researchers interested in East Asian cases. If anything, our analysis of welfare development in East Asia in this article made this clear once again.
Supplementary material
To view supplementary material for this article, please visit https://doi.org/10.1017/S147474641900054X.
Appendix Table 1 The East Asian welfare model