Implications
Regression analyses between the apparent ileal digestible and the total dietary amino acid (AA) content in barley samples have proven to be superior over the calculation of standardized ileal digestibility (SID) by correcting apparent ileal digestibility (AID) values for their ileal endogenous amino acid (IAAend). According to regression analysis, SID of most AA in barley was >80%, whereas SID of most AA obtained by correcting AID values for IAAend was below 80%. In particular, lower SID of Lys, Thr and Trp in comparison to other indispensable AA need to be compensated for, for example, through supplementation with crystalline AA in barley diets for pigs.
Introduction
The world production of barley amounts to over 134 million tons annually (FAOSTAT, 2011), therefore, and due to its low purchase cost, barley is the most important crop in diets for livestock after wheat and maize (Leterme et al., Reference Leterme, Souffrant and Théwis2000; Hennig et al., Reference Hennig, Kuhla, Souffrant, Tuchscherer and Metges2006; FAOSTAT, 2011). The protein content of cereal grains including barley is considerably lower than that of protein supplements such as soya bean meal, but due to their high dietary inclusion level, cereal grains can supply up to 60% of pigs’ requirements for CP and amino acids (AA) (Myrie et al., Reference Myrie, Bertolo, Sauer and Ball2008). The protein value of feed ingredients for pigs is commonly based on their ileal digestibility of AA. In the past, numerous experiments on the determination of apparent ileal digestibility (AID) of AA in barley have been conducted, but only few studies with pigs on standardized ileal digestibility (SID) of AA in barley have been performed so far. This is crucial, as many feed tables on ileal digestibility of AA in feed ingredients for pigs are based on SID (previously also referred to as true ileal digestibility, e.g., Stein et al., Reference Stein, Sève, Fuller, Moughan and de Lange2007; NRC, 2010) rather than AID values (AFZ et al., 2000; GfE, 2006; NRC, 2012). These SID coefficients were obtained by correcting AID values for basal ileal endogenous AA losses (IAAend), assuming a constant AA profile of endogenous gut protein determined from pigs fed, for example, protein-free diets. However, there is a considerable variation in the SID of AA among different barley samples as indicated, for example, by large variation coefficients of 19.3, 7.5 and 14 percentage units for Lys, Met and Thr, respectively (GfE, 2006), which correspond well with high standard deviations reported in other feed tables (AFZ et al., 2000; NRC, 2012), ranging between 4.3 and 8.7, 4.3 and 5.6 and 6.2 and 9.6 percentage units for Lys, Met and Thr, respectively. Besides variations in nutrient content between barley samples such as variable fibre levels, primarily differences in IAAend between studies have been held responsible for the observed variation in SID of AA between studies (Fan and Sauer, Reference Fan and Sauer1995; Fan et al., Reference Fan, Sauer and McBurney1995; Eklund et al., Reference Eklund, Mosenthin, Piepho and Rademacher2008b). As an alternative method to the calculation of SID by correcting AID values for their IAAend, regression analysis between the apparent ileal digestible and total dietary AA content has been proposed to obtain direct estimates of SID of AA in feed ingredients (Fan et al., Reference Fan, Sauer and McBurney1995). In addition, reliable estimates of IAAend, can be obtained by extrapolating the dietary AA intakes of the assay diets containing, for example, barley to zero intake (Taverner et al., Reference Taverner, Hume and Farell1981a; Fan and Sauer, Reference Fan and Sauer2002; Eklund et al., Reference Eklund, Mosenthin, Piepho and Rademacher2008b).
This study aimed to collect data from peer-reviewed papers on AID of AA in barley for pigs, and to use these data to obtain SID of AA by two different approaches: (1) by regression analysis between the apparent ileal digestible and the total dietary AA content in these barley samples, which allows for estimating the total amount and the composition of IAAend in pigs; (2) by correcting the collected literature data on AID values of AA in barley for IAAend as proposed by Jansman et al. (Reference Jansman, Smink, van Leeuwen and Rademacher2002). Based on the results of this comparative study for calculating SID of AA in barley, choices can be made which method to use to further optimize the accuracy in diet formulation for pigs in terms of digestible AA supply.
Material and methods
The database
A database containing AID of CP and AA in 38 barley samples for pigs was extracted from a total of 26 peer-reviewed papers with data on AID of CP and AA in barley including studies of Baidoo and Liu (Reference Baidoo and Liu1998) (3); De Lange et al. (Reference De Lange, Souffrant and Sauer1990) (1); Fan et al. (Reference Fan, Sauer and Li1993) (1); Fan and Sauer (Reference Fan and Sauer1995) (1); Fan and Sauer (Reference Fan and Sauer2002) (6); Fernández-Fígares et al. (Reference Fernández-Fígares, García, Ruiz and Rubio2008) (1); Fuller et al. (Reference Fuller, Darcy-Vrillon, Laplace, Picard, Cadenhead, Jung, Brown and Franklin1994) (1); Furuya and Kaji (Reference Furuya and Kaji1991) (1); Green et al. (Reference Green, Bertrand, Duron and Maillard1987) (1); Ige et al. (Reference Ige, Kiarie, Akinremi, Rossnagel, Flatten and Nyachoti2010) (2); Jørgensen et al. (Reference Jørgensen, Gabert and Eggum1997) (2); Lin et al. (Reference Lin, Knabe and Tanksley1987) (1); Nitrayová et al. (Reference Nitrayová, Patráš, Sommer and Heger2006) (1); Nyachoti et al. (Reference Nyachoti, de Lange and Schulze1997) (1); Pedersen et al. (Reference Pedersen, Boersma and Stein2007) (1); Perttilä et al. (Reference Perttilä, Siljander-Rasi, Partanen, Alaviuhkola and Suomi2002) (1); Reverter and Lindberg (Reference Reverter and Lindberg1998) (1); Rowan and Lawrence (Reference Rowan and Lawrence1986) (1); Sauer et al. (Reference Sauer, Stothers and Phillips1977) (1); Sauer et al. (Reference Sauer, Kennelly, Aherne and Cichon1981) (4); Schröder et al. (Reference Schröder, Schulz and Oslage1989) (1); Stein et al. (Reference Stein, Trottier, Bellaver and Easter1999) (1); Taverner et al. (Reference Taverner, Hume and Farell1981b) (1); Yin et al. (Reference Yin, Huang, Zhang, Chen, Li and Pan1993) (1); Yin et al. (Reference Yin, Baidoo, Lin, Liu, Schulze and Simmins2001a) (1) and Yin et al. (Reference Yin, Huang, Zhong, Li, Souffrant and de Lange2002) (1) (number of barley samples per study is given in brackets). The selection of these peer-reviewed papers was based on several criteria including (1) complete information on diet composition; (2) complete information on CP and AA contents of the diet and (or) barley; (3) use of barley as the only source of protein in the diet; (4) diets being devoid of feed additives. Furthermore, if available, information on initial BW, sex and breed of the pigs, feeding level, particle size of the barley sample, barley type, method of digesta collection, year and origin country of the experiment, and type of indigestible marker were recorded as well.
Calculations
The apparent ileal digestible CP and AA contents in the experimental diets were calculated using the following equation:
 $$D_{{Ai}} \,=\,A_{{Di}} \,{\times}\,D_{{AID}} $$
where D Ai is the apparent ileal digestible contents of CP or AA in the ith experimental diet (g/kg dry matter intake (DMI)); A Di the total contents of CP or AA in the experimental diets (g/kg DMI) and D AID the AID of CP or AA in the ith experimental diet (%).
SID values were calculated using two different approaches, that is (1) by correcting the AID values of AA for IAAend according to Jansman et al. (Reference Jansman, Smink, van Leeuwen and Rademacher2002) (equation (2)); and (2) by the regression analysis method (Furuya et al., Reference Furuya, Nagano and Kaji1986; Fan and Sauer, Reference Fan and Sauer2002; Eklund et al., Reference Eklund, Mosenthin, Piepho and Rademacher2008b). For regression analysis, a simple linear regression model was used. The relationship between SID and AID of AA in the assay diet can either be expressed by equation (3) or, after further mathematical derivation, by equation (4):
 $$D_{S} =D_{{AID}} {\plus}(A_{L} /A_{{Di}} ){\times}100\,\%\,$$
 $$D_{S} =[(D_{{Ai}} /A_{{Di}} ){\plus}(A_{L} /A_{{Di}} )]{\times}100\,\%\,$$
 $$D_{{Ai}} ={\minus}A_{L} {\plus}[(D_{S} /100){\times}A_{{Di}} ]$$
where D S is the SID of CP and AA (%), D AID the AID of CP or AA in the ith experimental diet, D Ai the apparent ileal digestible content of CP or AA in the ith experimental diet (g/kg DMI), determined using equation (1), A Di the total contents of CP or AA in the ith experimental diet (g/kg DMI), A L the IAAend or basal ileal endogenous CP loss (g/kg DMI). In this model, D Ai are dependent and A Di are independent variables (Fan et al., Reference Fan, Sauer and McBurney1995). A L and D S are regression coefficients and estimated by fitting the linear regression model. If there are linear relationships between total dietary contents of AA and apparent ileal digestible content of AA, IAAend can be determined by extrapolating the dietary AA intakes to zero intake, where SID of AA is represented by the slope of the linear regression model (Fan et al., Reference Fan, Sauer and McBurney1995; Eklund et al., Reference Eklund, Mosenthin, Piepho and Rademacher2008b).
Statistical model
The experimental unit was the barley sample. SID values obtained by correction of AID values for IAAend were subjected to the univariate procedure of SAS (2008) to test homogeneity of variances and normal distribution of the data by analysis of the studentized residuals. Thereafter, linear regression analysis was performed, using the mixed procedure of SAS (SAS, 2008). Linear and quadratic regression analysis was also conducted between the content of CP and AID or SID of CP and AA. Effects of initial BW, feeding level (in relation to animals’ BW), digesta collection technique, type of indigestible marker and year and origin of publication on SID of AA were tested before linear regression analysis between the apparent ileal digestible AA contents and total dietary contents of AA was conducted. NDF content, sex and breed of pigs, barley type, and particle size were not included in the statistical model, either due to the low number of reports (nine, 12 and 14 studies for NDF, barley type, and particle size, respectively) or imbalanced data (sex and breed). For all linear regression analyses, a lack-of-fit test for departure from linearity was performed. For all Wald-type F-tests the significance level was set at α=0.05, and trends were discussed at 0.05<α⩽0.10.
Results
General observations
Publication year of the 26 peer-reviewed papers ranged between 1977 and 2010; eight of them were published after 2000. The papers originated from European research centers (nine papers), from the United States and Canada (12 papers), and Asia and Australia (five papers). Information on the type of barley used in these studies was rather limited. In three and nine out of the 26 studies hulless and hulled barley cultivars were used, respectively, whereas in the remaining studies the type of barley has not been disclosed. Average NDF content in barley was 15.9 g/kg DM, ranging between 12.1 and 22.6 g/kg DM (10 studies). In the selected 26 peer-reviewed papers, initial BW of the pigs averaged 41 kg and ranged from 14 to 104 kg. In 20 out of the 26 peer-reviewed papers, barrows were used, the remaining publications used gilts or gave no information on sex of the pigs. The daily feed intake level averaged 34 g/kg (as fed) of average BW, but ranged from 15 to 55 g/kg (as fed) of average BW. Barley samples were ground to an average of 4.0 mm mesh screen, with variations from 0.5 to 6.4 mm mesh screen. In most studies, chromic oxide was used as an indigestible marker. Digesta collection methods described in the 26 papers included simple T-cannula cannulation technique (used in 16 papers), re-entrant cannulation technique (used in four papers), post valve T-caecum cannulation (used in two papers), steered ileocaecal valve cannulation (used in two papers), and the ileo-rectal anastomosis technique (used in two papers).
Chemical composition of the barley samples
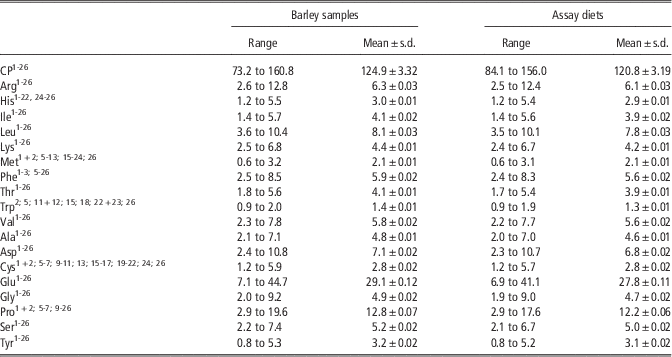
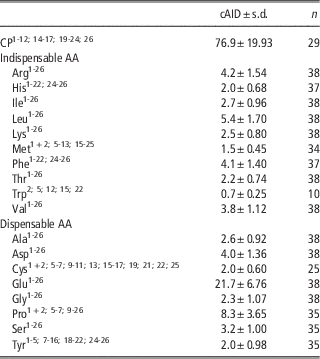
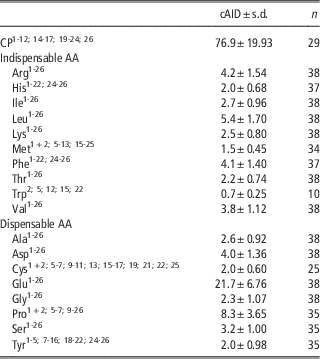
The average contents of CP and AA in the barley samples and in the assay diets used in the 26 studies are presented in Table 1. The inclusion level of barley in the assay diets ranged from 732to 985 g/kg (as fed). On average, the CP content amounted to 125 g/kg DM in the barley samples, ranging between 73 and 161 g/kg DM. In the assay diets, CP content averaged 121 g/kg DM and ranged from 84 to 156 g/kg DM, with corresponding variations in AA concentrations. For most AA, the AA patterns among barley samples were similar, with average contents of the four most limiting AA Lys, Met, Thr and Trp of 4.4, 2.1, 4.1 and 1.4 g/kg DM, respectively. Contents of apparent ileal digestible CP and AA (g/kg DMI) are presented in Table 2.
Contents of CP and AA in barley samples and in the assay diets (g/kg DM)

AA=amino acids.
1Baidoo and Liu (Reference Baidoo and Liu1998); 2de Lange et al. (Reference De Lange, Souffrant and Sauer1990); 3Fan et al. (Reference Fan, Sauer and Li1993); 4Fan and Sauer (Reference Fan and Sauer1995); 5Fan and Sauer (Reference Fan and Sauer2002); 6Fernández-Fígares et al. (Reference Fernández-Fígares, García, Ruiz and Rubio2008); 7Fuller et al. (Reference Fuller, Darcy-Vrillon, Laplace, Picard, Cadenhead, Jung, Brown and Franklin1994); 8Furuya and Kaji (Reference Furuya and Kaji1991); 9Green et al. (Reference Green, Bertrand, Duron and Maillard1987); 10Ige et al. (Reference Ige, Kiarie, Akinremi, Rossnagel, Flatten and Nyachoti2010); 11Jørgensen et al. (Reference Jørgensen, Gabert and Eggum1997); 12Lin et al. (Reference Lin, Knabe and Tanksley1987); 13Nitrayová et al. (Reference Nitrayová, Patráš, Sommer and Heger2006); 14Nyachoti et al. (Reference Nyachoti, de Lange and Schulze1997); 15Pedersen et al. (Reference Pedersen, Boersma and Stein2007); 16Perttilä et al. (Reference Perttilä, Siljander-Rasi, Partanen, Alaviuhkola and Suomi2002); 17Reverter and Lindberg (Reference Reverter and Lindberg1998); 18Rowan and Lawrence (Reference Rowan and Lawrence1986); 19Sauer et al. (Reference Sauer, Stothers and Phillips1977); 20Sauer et al. (Reference Sauer, Kennelly, Aherne and Cichon1981); 21Schröder et al. (Reference Schröder, Schulz and Oslage1989); 22Stein et al. (Reference Stein, Trottier, Bellaver and Easter1999); 23Taverner et al. (Reference Taverner, Hume and Farell1981b); 24Yin et al. (Reference Yin, Huang, Zhang, Chen, Li and Pan1993); 25Yin et al. (Reference Yin, Baidoo, Lin, Liu, Schulze and Simmins2001a); 26Yin et al. (Reference Yin, Huang, Zhong, Li, Souffrant and de Lange2002).
Contents of apparent ileal digestible (cAID) CP and AA (g/kg DMI) in the assay diets
AA=amino acids.
n=number of observations.
1Baidoo and Liu (Reference Baidoo and Liu1998); 2de Lange et al. (Reference De Lange, Souffrant and Sauer1990); 3Fan et al. (Reference Fan, Sauer and Li1993); 4Fan and Sauer (Reference Fan and Sauer1995); 5Fan and Sauer (Reference Fan and Sauer2002); 6Fernández-Fígares et al. (Reference Fernández-Fígares, García, Ruiz and Rubio2008); 7Fuller et al. (Reference Fuller, Darcy-Vrillon, Laplace, Picard, Cadenhead, Jung, Brown and Franklin1994); 8Furuya and Kaji (Reference Furuya and Kaji1991); 9Green et al. (Reference Green, Bertrand, Duron and Maillard1987); 10Ige et al. (Reference Ige, Kiarie, Akinremi, Rossnagel, Flatten and Nyachoti2010); 11Jørgensen et al. (Reference Jørgensen, Gabert and Eggum1997); 12Lin et al. (Reference Lin, Knabe and Tanksley1987); 13Nitrayová et al. (Reference Nitrayová, Patráš, Sommer and Heger2006); 14Nyachoti et al. (Reference Nyachoti, de Lange and Schulze1997); 15Pedersen et al. (Reference Pedersen, Boersma and Stein2007); 16Perttilä et al. (Reference Perttilä, Siljander-Rasi, Partanen, Alaviuhkola and Suomi2002); 17Reverter and Lindberg (Reference Reverter and Lindberg1998); 18Rowan and Lawrence (Reference Rowan and Lawrence1986); 19Sauer et al. (Reference Sauer, Stothers and Phillips1977); 20Sauer et al. (Reference Sauer, Kennelly, Aherne and Cichon1981); 21Schröder et al. (Reference Schröder, Schulz and Oslage1989); 22Stein et al. (Reference Stein, Trottier, Bellaver and Easter1999); 23Taverner et al. (Reference Taverner, Hume and Farell1981b); 24Yin et al. (Reference Yin, Huang, Zhang, Chen, Li and Pan1993); 25Yin et al. (Reference Yin, Baidoo, Lin, Liu, Schulze and Simmins2001a); 26Yin et al. (Reference Yin, Huang, Zhong, Li, Souffrant and de Lange2002).
Determination of SID by correcting AID for IAAend
Body weight of pigs, country of origin of the study, feeding level, method for digesta collection, publication year, and the use of different indigestible markers did not affect SID of AA (P>0.05). Furthermore, NDF content, sex and breed, particle size of the barley sample, and the barley type were not included in the statistical model, as these data sets were incomplete or strongly imbalanced (e.g. the ratio between barrows and gilts).
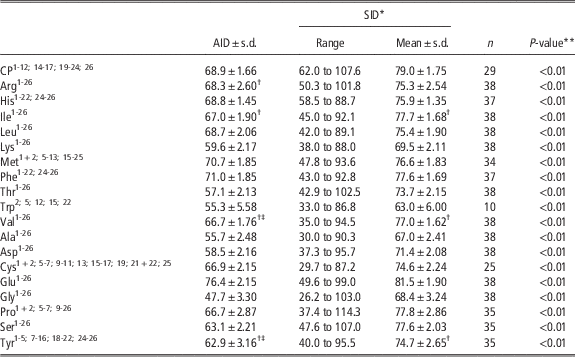
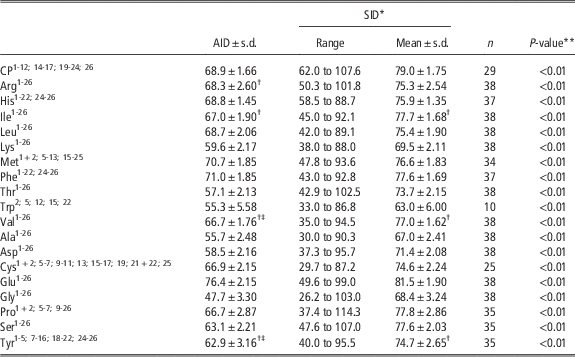
The average AID of CP and AA in the experimental diets and the corresponding SID values in the barley samples, obtained by correcting AID values in the experimental diets for IAAend according to Jansman et al. (Reference Jansman, Smink, van Leeuwen and Rademacher2002), are shown in Table 3. The AID of CP in the experimental diets averaged 69%, with average AID of indispensable and dispensable AA ranging from 55% for Trp to 71% for Phe, and from 48% for Gly to 76% for Glu, respectively. The AID of most AA did not show linear increases with increasing CP contents of the diet, except for Arg, Ile, Val, Tyr. For some AA (Lys, Thr, Ala, Gly), however, trends (P⩽0.1) towards a linear increase were obtained. Similarly, there were quadratic increases (P<0.05) with increasing CP contents for Val, Glu and Tyr, whereas Arg, His, Ala and Glu showed trends (P⩽0.1) towards quadratic increases.
Apparent ileal digestibility (AID) of CP and AA in the assay diets (%) and standardized ileal digestibilities (SID) in barley samples calculated by correcting AID of AA in the assay diets for basal ileal endogenous losses (Jansman et al., Reference Jansman, Smink, van Leeuwen and Rademacher2002)
AA=amino acids.
n=number of observations.
1Baidoo and Liu (Reference Baidoo and Liu1998); 2de Lange et al. (Reference De Lange, Souffrant and Sauer1990); 3Fan et al. (Reference Fan, Sauer and Li1993); 4Fan and Sauer (Reference Fan and Sauer1995); 5Fan and Sauer (Reference Fan and Sauer2002); 6Fernández-Fígares et al. (Reference Fernández-Fígares, García, Ruiz and Rubio2008); 7Fuller et al. (Reference Fuller, Darcy-Vrillon, Laplace, Picard, Cadenhead, Jung, Brown and Franklin1994); 8Furuya and Kaji (Reference Furuya and Kaji1991); 9Green et al. (Reference Green, Bertrand, Duron and Maillard1987); 10Ige et al. (Reference Ige, Kiarie, Akinremi, Rossnagel, Flatten and Nyachoti2010); 11Jørgensen et al. (Reference Jørgensen, Gabert and Eggum1997); 12Lin et al. (Reference Lin, Knabe and Tanksley1987); 13Nitrayová et al. (Reference Nitrayová, Patráš, Sommer and Heger2006); 14Nyachoti et al. (Reference Nyachoti, de Lange and Schulze1997); 15Pedersen et al. (Reference Pedersen, Boersma and Stein2007); 16Perttilä et al. (Reference Perttilä, Siljander-Rasi, Partanen, Alaviuhkola and Suomi2002); 17Reverter and Lindberg (Reference Reverter and Lindberg1998); 18Rowan and Lawrence (Reference Rowan and Lawrence1986); 19Sauer et al. (Reference Sauer, Stothers and Phillips1977); 20Sauer et al. (Reference Sauer, Kennelly, Aherne and Cichon1981); 21Schröder et al. (Reference Schröder, Schulz and Oslage1989); 22Stein et al. (Reference Stein, Trottier, Bellaver and Easter1999); 23Taverner et al. (Reference Taverner, Hume and Farell1981b); 24Yin et al. (Reference Yin, Huang, Zhang, Chen, Li and Pan1993); 25Yin et al. (Reference Yin, Baidoo, Lin, Liu, Schulze and Simmins2001a); 26Yin et al. (Reference Yin, Huang, Zhong, Li, Souffrant and de Lange2002).
*Values for IAAend: CP: 11.82, Arg: 0.39, His: 0.20, Ile: 0.40, Leu: 0.50, Lys: 0.40, Met: 0.11, Phe: 0.34, Thr: 0.61, Trp: 0.14, Val: 0.50, Ala: 0.50, Asp: 0.82, Cys: 0.21, Glu: 1.27, Gly: 0.92, Pro: 1.14, Ser: 0.68, Tyr: 0.30, Jansman et al. Reference Jansman, Smink, van Leeuwen and Rademacher2002.
**P-values for SID and AID of CP and AA.
†Linear effect of CP-level (P<0.05).
‡Quadratic effect of CP-level (P<0.05).
When SID of AA were obtained by correcting AID values for IAAend, variation in ileal digestibility of individual AA was partially reduced, as indicated by smaller standard errors compared to AID values. Average SID of CP in the barley samples was 79%, whereas average SID of indispensable and dispensable AA ranged from 63% for Trp to 78% for Phe and from 67% for Ala to 82% for Glu, respectively. The SID values of most AA did not show linear increases with increasing CP contents. Furthermore, no quadratic effects of CP content on SID of AA were observed.
Determination of SID and IAAend by regression analysis
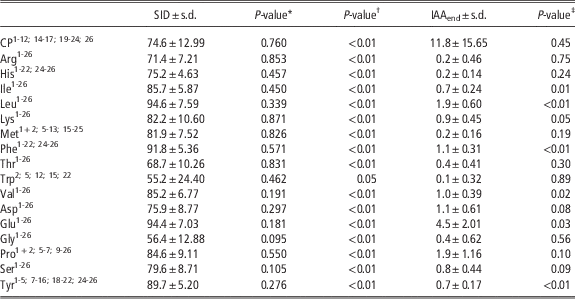
For CP and most AA, there was linearity between AID and total dietary contents of CP and AA. The corresponding P-values of the lack-of-fit test for departure of linearity ranged between 0.095 for Gly and 0.871 for Lys, except of Ala and Cys, where the relationship could not be described with a linear model. As there was a large range in dietary CP content, with corresponding variations in dietary AA contents of the barley samples used in the 26 peer-reviewed papers, SID values could also be estimated by regression analysis from graded dietary levels of apparent ileal digestible and total CP and AA contents. Moreover, there were significant linear relationships between the content of apparent ileal digestible and total dietary CP and AA contents (P⩽0.05 for CP and all AA, Table 4). The slopes of these linear regression equations, representing estimates for SID of CP and AA in barley samples, revealed 75% for CP, and varied for indispensable and dispensable AA from 55% for Trp to 95% for Leu and from 55% for Trp to 94% for Glu, respectively. By extrapolating the dietary AA levels to zero intake, estimates of IAAend can be obtained, from the intercepts of the linear relationships between dietary contents of apparent ileal digestible and total AA (Table 4). Estimates of basal ileal endogenous CP loss amounted to 11.8 g CP/kg DMI, and ranged for IAAend of indispensable and dispensable AA from 0.1 g Trp to 1.9 g Leu/kg DMI and from 0.4 g Gly to 4.5 g Glu/kg DMI, respectively, although some of these estimates were not significantly different from zero.
Standardized ileal digestibilities (SID) of CP and AA (%) and basal ileal endogenous losses (IAAend) in barley samples estimated by regression analysis between the apparent ileal digestible and total dietary AA contents (g/kg DMI)

AA=amino acids.
1Baidoo and Liu (Reference Baidoo and Liu1998); 2de Lange et al. (Reference De Lange, Souffrant and Sauer1990); 3Fan et al. (Reference Fan, Sauer and Li1993); 4Fan and Sauer (Reference Fan and Sauer1995); 5Fan and Sauer (Reference Fan and Sauer2002); 6Fernández-Fígares et al. (Reference Fernández-Fígares, García, Ruiz and Rubio2008); 7Fuller et al. (Reference Fuller, Darcy-Vrillon, Laplace, Picard, Cadenhead, Jung, Brown and Franklin1994); 8Furuya and Kaji (Reference Furuya and Kaji1991); 9Green et al. (Reference Green, Bertrand, Duron and Maillard1987); 10Ige et al. (Reference Ige, Kiarie, Akinremi, Rossnagel, Flatten and Nyachoti2010); 11Jørgensen et al. (Reference Jørgensen, Gabert and Eggum1997); 12Lin et al. (Reference Lin, Knabe and Tanksley1987); 13Nitrayová et al. (Reference Nitrayová, Patráš, Sommer and Heger2006); 14Nyachoti et al. (Reference Nyachoti, de Lange and Schulze1997); 15Pedersen et al. (Reference Pedersen, Boersma and Stein2007); 16Perttilä et al. (Reference Perttilä, Siljander-Rasi, Partanen, Alaviuhkola and Suomi2002); 17Reverter and Lindberg (Reference Reverter and Lindberg1998); 18Rowan and Lawrence (Reference Rowan and Lawrence1986); 19Sauer et al. (Reference Sauer, Stothers and Phillips1977); 20Sauer et al. (Reference Sauer, Kennelly, Aherne and Cichon1981); 21Schröder et al. (Reference Schröder, Schulz and Oslage1989); 22Stein et al. (Reference Stein, Trottier, Bellaver and Easter1999); 23Taverner et al. (Reference Taverner, Hume and Farell1981b); 24Yin et al. (Reference Yin, Huang, Zhang, Chen, Li and Pan1993); 25Yin et al. (Reference Yin, Baidoo, Lin, Liu, Schulze and Simmins2001a); 26Yin et al. (Reference Yin, Huang, Zhong, Li, Souffrant and de Lange2002).
*P-values of the lack-of-fit test for departure of linearity.
† P-values of the estimates for the slope of the regression equations.
‡ P-values of the estimates for the intercepts of the regression equations.
Discussion
The present meta-analysis revealed a large variation, both in CP and AA contents, in barley between the selected studies, but the reported CP contents in the samples were within the range of previously reported variations for barley in currently used feed tables (e.g. Degussa, 2010; NRC, 2012). Although information on the type of barley was incomplete and therefore not included in the statistical analysis, it cannot be completely ruled out that part of this variation has to be attributed to the use of hulled v. hulless barley varieties, as hulless barley varieties can contain more CP (up to 38 g/kg DM) and AA due to the absence of the hull, which is poor in CP content but contains a large proportion of crude fibre (Mitchall et al., Reference Mitchall, Bell and Sosulski1976; Baidoo and Liu, Reference Baidoo and Liu1998; Yin et al., Reference Yin, Baidoo, Schulze and Simmins2001b). Even though the results of this meta-analysis did not show any effect of publication year or origin of publication on contents of CP and AA in barley, period effects can be assumed. The use of nitrogen (N) fertilizer at a particular time during the growing season of barley, for example, has been shown to affect CP content in barley (Peers and Taylor, Reference Peers and Taylor1977). As the global application of N fertilizer has increased over the last decades, and the application rates differ between countries (e.g. annual N application rate in Asia exceeded that of the European Union in the year 2002 by 29 kg N/ha), both year of harvest and country of origin of the grains could have affected CP content in the barley samples (Bach Knudsen et al., Reference Bach Knudsen, Åman and Eggum1987; van Egmond et al., Reference Van Egmond, Bresser and Bouwman2002; Kindred et al., Reference Kindred, Verhoeven, Weightman, Swanston, Agu, Brosnan and Sylvester-Bradley2008).
Both, AID and SID of AA, obtained by correction of AID for IAAend, were consistently between 3 and 18 percentage units lower than previously reported values in feed tables for pigs (AFZ et al., 2000; Degussa, 2010; NRC, 2012). The larger variation in AID values compared to SID values, together with the linear increase or trends to linear increases in AID values with increasing dietary CP confirms, that AID, in contrast to SID values, are curvilinear dependent on the contents of CP and AA in the assay diets, due to the decrease in the relative contribution of IAAend in ileal digesta with increasing dietary CP and AA content (Furuya and Kaji, Reference Furuya and Kaji1989; Fan et al., Reference Fan, Sauer and McBurney1995; Fan and Sauer, Reference Fan and Sauer2002). The CP content of the experimental diets included in the present meta-analysis ranged from 84 to 156 g/kg DM. In this range of graded dietary CP levels, Fan et al. (Reference Fan, Sauer and McBurney1995) obtained a 12 percentage units increase in AID of CP in grower pigs fed graded levels of soya bean meal. Similarly, Eklund et al. (Reference Eklund, Mosenthin, Piepho and Rademacher2008b) determined a 4 percentage units increase in AID of CP in piglets fed graded levels of casein.
According to the results of the present meta-analysis, there is no effect of year of publication, origin of publication or type of marker or digesta collection technique on SID of AA, likely due to the limited number of barley treatments. Moreover, due to the low number of reports or imbalanced data, barley type, particle size, NDF, sex and breed were not included in the statistical model. Yet, it cannot be completely ruled out that these factors affect the SID of AA in barley (Sauer and Ozimek, Reference Sauer and Ozimek1986; Sauer et al., Reference Sauer, Fan, Mosenthin, Drochner and Mello2000 and Reference Sauer, He, Fan, Cervantes, Kies and Caine2001). For example, Lahaye et al. (Reference Lahaye, Garnier, Thibault and Sève2004) observed a significantly higher AID and SID of CP and AA in pigs fed a wheat-sunflower meal based diet due to a decrease in particle size from 1.0 to 0.5 mm. Therefore, differences in particle size among barley samples used in the studies of the present meta-analysis, could also have influenced the digestibility values of CP and AA. Moreover, part of the variation in SID and AID values between studies can be attributed to the use of different barley varieties. Hulless barley cultivars have a higher ileal CP and AA digestibility compared with hulled barley cultivars, primarily due to lower contents of non-starch polysaccharides such as NDF (76 g/kg DM in hulless v. 134 g/kg DM in hulled barley) (Pettersson and Lindberg, Reference Pettersson and Lindberg1997). Additionally, proportions of the major seed proteins (albumins, globulins, glutelins and prolamins) may differ between barley varieties, thus affecting AA digestibilities differently, for example, higher glutelin concentrations resulted in lower AID of CP (Gabert et al., Reference Gabert, Jørgensen, Brunsgaard, Eggum and Jensen1996). Furthermore, water soluble albumins are better digestible than insoluble globulins (Sauer and Ozimek, Reference Sauer and Ozimek1986; Evers et al., Reference Evers, Blakeney and O’Brien1999). Moreover, this meta-analysis revealed a great variation between the SID of individual AA in barley samples, with higher digestibility values for Ile, Leu, Phe, Val, Glu and Tyr, whereas the digestibility values of Thr, Trp and Gly were considerably low. These differences in digestibility of individual AA in barley could also be attributed to the unbalanced distribution of AA in grains (Fernández-Fígares et al., Reference Fernández-Fígares, García, Ruiz and Rubio2008). Amino acids such as Lys occur mainly in the aleurone cells which are poorly digestible, as they have solid cellulosic cell walls, hardly accessible for digestive enzymes. On the other hand, those AA (e.g. Glu) which are mainly located in storage proteins (prolamins and glutelins) of the highly digestible endosperm fractions are better digestible (Sauer et al., Reference Sauer, Giovannetti and Stothers1974; Fernández-Fígares et al., Reference Fernández-Fígares, García, Ruiz and Rubio2008).
Another reason for the variation in SID and AID values between studies can be attributed to different contents of anti-nutritional factors present in barley, including β-glucans (mixed-linked non-starch polysaccharides) and NDF (Yin et al., Reference Yin, Baidoo, Schulze and Simmins2001b; Fan and Sauer, Reference Fan and Sauer2002; Lynch et al., Reference Lynch, Sweeney, Callan and O’Doherty2007). For example, there are large differences in β-glucan content among barley samples, ranging between 30 and 110 g/kg (Skendi et al., Reference Skendi, Biliaderis, Lazaridou and Izydorczyk2003), partly due to the higher β-glucan contents in hulless than in hulled barley (Baidoo et al., Reference Baidoo, Liu and Yungblut1998). High β-glucan contents may cause a higher digesta viscosity, hence allowing less interaction between the diet and digestive enzymes in the small intestine (O’Connell et al., Reference O’Connell, Callan and O’Doherty2006). Thus, nutrient digestibility of barley in pigs can be substantially reduced (O’Connell et al., Reference O’Connell, Sweeney, Callan and O’Doherty2005). Moreover, less interaction between diet and digestive enzymes may result in increased specific ileal endogenous losses of CP and AA, as digesta viscosity inhibits sufficient interaction between endogenous protein and digestive enzymes (Chesson, Reference Chesson1993; Nyachoti et al., Reference Nyachoti, de Lange, McBride, Leeson and Gabert2000; Jansman et al., Reference Jansman, Smink, van Leeuwen and Rademacher2002).
The SID of CP and most AA estimated by regression analysis were in the range of SID values in barley reported in other studies (Hennig et al., Reference Hennig, Kuhla, Souffrant, Tuchscherer and Metges2006; Ige et al., Reference Ige, Kiarie, Akinremi, Rossnagel, Flatten and Nyachoti2010), and corresponded (95% confidence intervals) to SID values reported by NRC (2012) and AFZ et al. (2000). Additionally, SID values of Trp were lower than their AID values, eventually due to the limited data available for Trp. However, although not significantly different, SID values of most AA estimated by regression analysis were up to 19 percentage units higher compared with mean SID values obtained by correcting AID values for IAAend, as indicated by comparison of the 95%-confidence intervals (data not shown). These differences between SID values based on the regression method and those obtained by correction of AID for IAAend can be mainly attributed to variations in IAAend. Especially at lower dietary protein levels, SID values obtained by correction of AID for IAAend can be easily over- or underestimated, as this correction is largely affected by IAAend, which can vary considerably between and within animals (Eklund, Reference Eklund2006). Therefore, estimates of SID of CP and AA based on regression analysis are more accurate, as there is no need for consideration of IAAend values. Consequently, the estimation errors, resulting from the determination of IAAend, are excluded (Kluth et al., Reference Kluth, Mantei, Elwert and Rodehutscord2005).
In accordance with Fan and Sauer (Reference Fan and Sauer2002), mean IAAend, estimated by the regression method using barley as protein source, were in most cases higher than those obtained by feeding high digestible, purified diets, including N-free diets, casein/wheat gluten diets, diets with graded inclusion levels of protein sources other than barley for regression analysis, or diets based on enzymatic hydrolyzed casein (Jansman et al., Reference Jansman, Smink, van Leeuwen and Rademacher2002). Depending on the CP content of the diet and the type of feed ingredient used for regression analysis, IAAend can vary considerably (Fan et al., Reference Fan, Sauer and McBurney1995; Eklund et al., Reference Eklund, Mosenthin, Piepho and Rademacher2008a). There is evidence that IAAend may be underestimated when highly digestible diets are used, including N-free diets, casein/wheat gluten diets, or diets based on enzymatic hydrolyzed casein (Eklund et al., Reference Eklund, Mosenthin, Piepho and Rademacher2008b). Higher IAAend were obtained, however, when less digestible feed ingredients were included in the assay diet such as barley in the present study and in the study of Fan and Sauer (Reference Fan and Sauer2002). Fan and Sauer (Reference Fan and Sauer2002) reported even significantly higher (95% confidence intervals) IAAend values for Arg, Ile, Met, Thr, Val, Asp, Gly and Pro compared with those of the present study. On the other hand, Stein et al. (Reference Stein, Trottier, Bellaver and Easter1999) and Jansman et al. (Reference Jansman, Smink, van Leeuwen and Rademacher2002) found significantly lower (95% confidence intervals) IAAend values for Leu, Phe and Trp than those determined in this analysis. Furthermore, mean IAAend values (except for Arg, Thr, Trp, Gly) in the present study where higher compared with the corresponding IAAend in the studies of Stein et al. (Reference Stein, Trottier, Bellaver and Easter1999) and Dolešová et al. (Reference Dolešová, Nitrayová, Patráš and Heger2009). In conclusion, large standard deviations for IAAend obtained in the present study reflect considerable variation in IAAend between the studies included in the meta-analysis.
Although the present meta-analysis did not show any effect of BW, feeding level or indigestible marker on IAAend, there is evidence from individual literature reports that these factors contribute, at least in part, to the large variation in IAAend (Fan and Sauer, Reference Fan and Sauer2002; Leterme and Théwis, Reference Leterme and Théwis2004; Moter and Stein, Reference Moter and Stein2004; Høøk Presto et al., Reference Høøk Presto, Lyberg and Lindberg2010). According to Hess and Sève (Reference Hess and Sève1999), IAAend may decrease with increasing BW of pigs in the weight range from 45 to 80 kg. As BW of pigs varied between 14 and 104 kg in the present meta-analysis, potential effects of BW on IAAend are not unlikely. Furthermore, the level of feed intake influences the IAAend of CP and AA, as they decrease with increasing DMI (Moter and Stein, Reference Moter and Stein2004). Since the daily feed intake level in the 26 peer-reviewed papers varied between 15 and 55 g per kg BW, a possible impact on variations in IAAend can be assumed. Finally, based on a literature review, Fan and Sauer (Reference Fan and Sauer2002) recommend the use of dual rather than single indigestible markers to measure IAAend, in particular in high fibre feedstuffs, such as barley.
In conclusion, the contents of CP and AA in barley of different origins vary considerably. The SID of AA, obtained from correction of AID for IAAend were for most AA below 80% and therefore lower than those previously reported in feed tables for pigs. In contrast, SID coefficients calculated by regression analysis correspond to tabulated SID values, and were for most AA >80%. Furthermore, high variations for IAAend were observed, which may result in inaccurate calculation of SID of AA, based on correction of AID for IAAend. Given all these disadvantages of the correction method, the regression method should be preferred to calculate SID of AA based on literature data, as there is no need for a separate consideration of IAAend, which is crucial, especially in low-protein feed ingredients such as barley.
Acknowledgements
The project was supported in the framework of GrainUp by funds of the Federal Ministry of Food, Agriculture and Consumer Protection (BMELV) based on a decision of the Parliament of the Federal Republic of Germany via the Federal Office for Agriculture and Food (BLE) under the innovation support program.