Do election results have long-term consequences for representation? If so, how long do these consequences persist, and what factors determine the duration of these effects? The study of representation and polarization typically focuses on immediate effects or effects in the aggregate. Likewise, the incumbency advantage literature focuses on near-term effects – that is, the effect of incumbency in the next election cycle. In this article, we connect these literatures and estimate the long-term consequences of election results, which are surprisingly persistent. Incumbents do not appear to adapt their roll-call votes over time, and voters do not appear to punish them for this behavior. Indeed, we find that election results produce discernible and divergent changes in roll-call voting behavior for more than a decade in the US House and upper chambers of state legislatures and for more than two decades in the US Senate and lower chambers of state legislatures.
First, we quantify the effects of elections for policy representation by incorporating the analysis of legislative roll-call data into a regression discontinuity (RD) design. For Congress and state legislatures, the election of a Republican instead of a Democrat increases the probability of conservative roll-call votes by approximately 40 percentage points. Next, we assess the long-term effects of one election on subsequent elections. The results of one election influence the results of subsequent elections for at least a decade. That is to say, a district that randomly receives a representative from one party rather than the other in an election today is more likely than not to still be represented by that party a decade later. In the case of the Senate and lower chambers of state legislatures, this is still the case three decades after the initial election. Finally, we combine these two strands of evidence to assess the long-term consequences of elections for roll-call representation. A single ‘coin-flip’ election in a moderate district will change the roll-call representation of that district for decades.
We also uncover several interesting sources of variation. The long-term consequences of election results are smaller in state legislatures with term limits and greater in open seat races, in which candidates are typically younger and have longer time horizons. This evidence suggests that the effects we observe result primarily from individual incumbents seeking re-election over long periods of time – a personal and non-partisan phenomenon. In addition, we find that even highly partisan districts display long-term ‘mismatches’ in representation. When a partisan district happens to elect a representative from the opposite party in a coin-flip election, the mismatched representative is expected to stay in office for several terms. Finally, we find that the effects of one election result on subsequent election results (and on subsequent roll-call representation) match one another in near-perfect proportion, suggesting that legislators do not adapt or moderate over time – even long periods of time – in the way they represent their constituents.
The evidence in this article identifies and illuminates the phenomenon of divergent and persistent representation in American legislatures. Representation is divergent because legislators do not converge to the preferences of the district – that is, Democratic and Republican legislators differ significantly in the way they represent the same district at the same time. Representation is persistent – at both the district and aggregate levels – because it can remain consistent over many electoral cycles even when the preferences of voters are far from those of their elected representatives.
Related Literature
This study builds upon and synthesizes several different scholarly traditions in political science. Following theoretical predictions that two office-motivated candidates will converge to the preferences of the median voter,Footnote 1 empirical researchers have repeatedly demonstrated the lack of convergence in American legislatures.Footnote 2 In light of these findings, new theories have been developed to explain the failure of the median voter prediction. For example, divergence could arise from policy-motivated politicians and uncertain electoral outcomes,Footnote 3 voter preferences for some other factor independent of policy positions,Footnote 4 the inability of candidates to credibly commit to deviate from their personal preferencesFootnote 5 or the strategic entry of a third-party candidate.Footnote 6
In estimating the effects of election results on subsequent representation, our study is naturally connected to the theoretical literature on divergence. The extent to which an election result influences representation in the next term is, by definition, the extent to which political candidates differ in their policy offerings to voters. The literature on divergence is also closely related to – but theoretically distinct from – those on legislative polarization,Footnote 7 party influence in legislaturesFootnote 8 and the effects of the news media on legislative voting.Footnote 9 Typically, the polarization literature focuses on the extent of partisan disagreement within legislatures, for which divergence is one of many sources. The party influence literature, in contrast, typically focuses on the extent to which party actors influence roll-call voting in legislatures, which is one of many different sources of divergence. In estimating divergence and the downstream consequences of elections, our results are consistent with previous accounts of party influence, but as discussed by Krehbiel,Footnote 10 evidence of divergence is not necessarily evidence of party influence. Numerous other factors, like those discussed in the divergence literature, could also explain our findings.
A separate and largely disjoint literature explores the electoral advantages of incumbency. Numerous empirical studies suggest that incumbent candidates receive significantly more votes simply because of their status as incumbents.Footnote 11 Explanations of this advantage are many, including institutional advantages,Footnote 12 increased campaign contributions,Footnote 13 the ability to scare off high quality challengers,Footnote 14 and a ‘personal vote’ resulting from an attachment between voters and their incumbents.Footnote 15 When combined, these literatures suggest that elections may have persistent, long-term effects on representation. Because of candidate divergence, election results have large effects on short-term representation, and because of incumbency advantages, these effects may persist for many years.
Cutting in the opposite direction are the important literatures on voter partisanship and ideological voting. If voters are predominantly partisans who consistently support the same party over time,Footnote 16 we should see little effect of one election result on subsequent elections. Further, voters appear to prefer moderate candidates over extremistsFootnote 17 and non-partisan candidates over partisans,Footnote 18 suggesting that extremist candidates should either converge over time or be replaced by more moderate candidates. These forces should mitigate the long-term effects of elections, and previous studies have not synthesized these disparate literatures, resolved these competing expectations or quantified the long-term effects of election results on future representation.
Regardless of the results, the subsequent analysis will shed light on the behavior of voters and legislators and on the nature of political representation. If voters tend to replace extremist incumbents, or if incumbent legislators converge over time, the effects of election results should dissipate quickly. However, if we detect large and persistent effects, we are left with a puzzle about why voters continue to re-elect incumbents, even when they fail to represent their preferences. We return to this discussion at the end of the article.
While our study, and most of the previous literature on these topics, focuses on the United States, the questions are relevant for a wide variety of democracies. Comparative politics scholars are increasingly studying questions about roll-call representationFootnote 19 and the effects of incumbency,Footnote 20 and our study builds upon and sheds light on this literature as well. Our empirical approach is generally applicable to any two-party system with single-member, plurality elections, so we hope that our results and methods will be of interest to scholars of elections and political institutions around the world. We see particular value in the extension and application of our approach across settings in which incumbency advantages, electoral rules, party platforms, party discipline and the internal dynamics of legislatures vary.
Data
We draw upon several data sources to assess the long-term consequences of election results. First, we employ election data for the US House and Senate from 1946 to 2010 and state legislatures from 1972 to 2010.Footnote 21 We also employ congressional roll-call data from 1947 to 2012 and state legislative roll-call data from 1999, 2000, 2011 and 2012. The Congressional roll-call data is from Keith Poole’s ‘Voteview’ website,Footnote 22 and the state legislative data is made publicly available by Gerald Wright (1999–2000)Footnote 23 and Project Vote Smart (2011–12).Footnote 24
Near-Term Consequences of Elections For Roll-Call Voting and Representation
Most evidence for the near-term effects of elections comes from the US House of Representatives, where congressional roll-call votes provide a readily observable measure of representation. Republican members of Congress are much more likely to vote conservatively than Democratic members even after controlling for district ideology.Footnote 25 The strength of such findings is consistent across different measures of roll-call voting (for example, DW-NOMINATE, Heckman-Snyder scores, Bayesian IRT Ideal Points, Americans for Democratic Action (ADA) scores) and different measures of district ideology (for example, presidential vote, demographic characteristics and survey responses). While a significant portion of representation is not observable – occurring through committees, backroom bargains and constituency service – roll-call votes reliably capture an important component of representation in legislatures.
Despite the strength of the existing evidence, two difficulties remain. First, even after controlling for various measures of district ideology, districts that elect Republicans may be systematically different from those that elect Democrats, potentially biasing estimates of the effect of elections. Second, previously used measures of roll-call votes provide little information about the substantive size of the relevant effect, presenting estimates on a latent dimension rather than a substantively interpretable scale. In the present context, the substantive magnitude is especially important. We overcome the first problem by implementing an RD design,Footnote 26 and we address the second problem by employing a more interpretable measure of roll-call voting.Footnote 27
Using an RD design, we compare districts in which a Republican barely won to those in which a Republican barely lost, assuming that these two sets of elections are, on average, similar in all respects except for the electoral outcome. This design accounts for heterogeneity across different districts and legislative agendas and isolates the direct effect of election results on political representation. Close elections provide a quasi-experiment in which the representative for certain districts is ‘as if’ randomly assigned (see Imbens and Lemieux for more details on RD designs, and see Lee for their application in electoral settings).Footnote 28 Our design most closely mirrors that of Lee, Moretti and Butler, who employ an RD design to assess the effect of an election result on the ADA score of a district’s representative.Footnote 29 Several recent articles criticize the use of RD in electoral settings and raise the possibility that strategic sorting biases RD estimates,Footnote 30 but readers should also see Eggers et al. for a defense of RD in electoral settings and for evidence that unusual patterns detected in the US House are not present in other settings including the Senate and state legislatures.Footnote 31 We are sensitive to these critiques, and we conduct numerous tests to address these concerns. The inclusion of covariates, alternative specifications and the implementation of ‘donut’ RD designsFootnote 32 suggest that strategic sorting does not pose a threat to our subsequent findings. See the Appendix for more details.
Our measure of roll-call behavior, Conservative Vote Probability (CVP), provides readily interpretable effect sizes. CVP indicates the probability that a particular legislator will vote conservatively relative to the median member of the legislature (or any other member of the legislature). For example, if legislator A has a CVP of 0.2 and legislator B has a CVP of −0.2, then legislator A is, on average, 40 percentage points more likely to vote conservatively than legislator B.Footnote 33 As we demonstrate in the Appendix, none of the subsequent results of this study changes if we use DW-NOMINATE,Footnote 34 Heckman-Snyder scoresFootnote 35 or Bayesian ideal point estimates,Footnote 36 because CVP correlates very highly with other measures and other measures correlate very highly with one another.Footnote 37 The advantage of CVP for the purposes of this article is substantive interpretability. CVP allows us to assess the extent to which election results change the probability that a district’s representative will vote conservatively.
We estimate the immediate consequences of election results by employing an OLS regression of the following form:
 $$CVP_{{it}} =\beta {\asterisk}RepublicanVictory_{{it}} {\plus}\gamma {\asterisk}f(RepublicanVoteShare_{{it}} ){\plus}\delta _{t} {\plus}{\varepsilon}_{{it}} .$$
When analyzing the US House, each observation is a district-congress.Footnote 38 We include all congressional sessions between the 80th and 112th Congresses, which followed the 1946 and 2010 elections, respectively. For example, California’s first district in the 112th Congress is one observation in the dataset. CVPit represents the proportion of bills for which a district’s representative voted conservatively relative to the median member for that particular two-year congressional session. In cases where multiple legislators represented the same district in the same session, we pool the votes from each representative to generate a single roll-call score for each district-congress. RepublicanVictoryit is a dummy variable indicating whether the district elected a Republican or Democrat for that particular session. We only include observations where a Democrat and Republican ran against one another. The regression also includes f(RepublicanVoteShareit), a high-order polynomial function of the Republican two-party vote share, and time fixed effects.
For our main analyses, we follow Lee and Lee, Moretti and Butler in presenting results for a fourth-order polynomial and include all observations in which the two-party vote share fell between 20 and 80 percent,Footnote 39 but as we show in the Appendix, the results are unchanged for other specifications. For example, the results are robust across different bandwidths, different polynomial orders, local linear specifications and specifications in which we simply compare means for small bins around the threshold. To be clear, our analysis does not assume that all elections from 20 to 80 percent are ‘as if’ randomly assigned. Even though the analysis includes many elections, the inferences are driven by very close elections, because the high-order polynomial allows us to estimate the limit of the outcome variable as we approach the electoral threshold from each side. β represents the effect of election results on representation for the hypothetical election right at the 50–50 threshold.Footnote 40 Specifically, it indicates how much more conservatively a barely elected Republican will vote in Congress relative to a barely elected Democrat. If legislators perfectly match their roll-call votes, the preferences of the median voter in their districts, β, should be zero.Footnote 41 However, given previous empirical work, we expect to see a discontinuity between barely elected Republicans and Democrats.
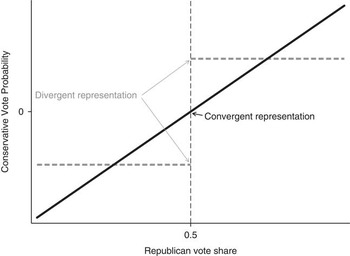
To illustrate the meaning of this test, Figure 1 presents two hypothetical results that we could obtain from this analysis. In a world of ‘convergent’ representation in which legislators converge to the median voter in the district, we would expect the roll-call votes of the legislator to be strongly correlated with the voting behavior and partisanship of the district. More importantly, we would expect to see no discontinuity or a sudden jump in roll-call representation as we move from districts that barely elected a Democrat to those that barely elected a Republican. Conversely, in a world of divergent representation in which legislators do not converge to the district median, we might expect little association between roll-call behavior and voting behavior on either side of the electoral threshold and a significant jump as a district switches from barely electing a Democrat to barely electing a Republican.
Convergent vs. divergent representation
Note: the figure illustrates the observational differences between divergent and convergent representation by plotting two hypothetical relationships between legislators’ roll-call behavior and their electoral support in the previous election. In a world of convergent representation in which legislators closely respond to the preferences of the median voter in their district, we might expect a strong correlation between the voting behavior of the district and the voting behavior of the legislator, but we should see no discontinuous jump in roll-call representation as a district switches from barely electing a Democrat to barely electing a Republican. Alternatively, in a world of divergent representation, we might find little correlation between roll-call behavior and voting behavior on either side of the 50 percent threshold, but we would expect a significant jump as a district switches from barely electing a Democrat to barely electing a Republican.

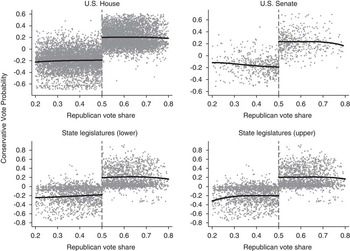
Figure 2 shows the results of this analysis for four different settings: the US House of Representatives, the US Senate, lower chambers of state legislatures and upper chambers of state legislatures. In every case, the figures mirror the model of divergent representation. As the Republican Party’s vote share in a district crosses the electoral threshold, the district’s representation changes dramatically. For the US House (shown in the top-left panel of Figure 2), we estimate a discontinuity of.391 with a standard error of .006 (t>60, p<10−18, district clustered). This indicates that a barely elected Republican is 39.1 percentage points more likely to vote conservatively, on average, than a Democrat barely elected from the same moderate district.Footnote 42 The near-term consequences of elections are massive. Close elections produce drastically different representational outcomes based solely on the vagaries of chance – the coin flip that determines the winning candidate.
Near-term consequences of elections on representation
Note: the figure plots the results of RD estimates of the effects of legislative elections on district-level representation in four different settings. The dependent variable is the CVP of a district’s representative in the immediate term after an election. In the case of the US Senate, the dependent variable is the combined CVP of both senators representing the state. The analyses of congressional elections include all elections from 1946 to 2010, and those of state legislative elections include only elections leading directly into the legislative sessions of 1999–2000 and 2011–12. In every case, the result of a coin flip election significantly changes the way that the district is represented in the next legislative session. The discontinuities of .391, .426, .376 and .410 at the 50 percent thresholds indicate that a Republican victory causes a district’s representative(s) to be 39.1, 42.6, 37.6 and 41.0 percentage points more likely to vote conservatively, on average, in the US House, the US Senate, lower chambers of state legislatures and upper chambers of state legislatures, respectively. In each case, the standard errors (clustered by electorate) associated with these estimates are so small (.006, .019, .011 and .018, respectively) that they cannot be shown graphically on the plot. The p-values resulting from tests of the null hypothesis of no discontinuity are all astronomically low (p<10−18, p<10−12, p<10−14 and p<10−12, respectively).

The top-right panel of Figure 2 presents the analogous test in the US Senate. The smaller number of legislators in the Senate (100 versus 435) and the infrequency of elections (every six years instead of every two) mean that our estimates in the Senate are slightly less precise than those in the House. Again, our analysis includes all elections between 1946 and 2010. As a Republican candidate’s vote share crosses the 50 percent threshold, the voters’ representation in the Senate becomes significantly more conservative. Specifically, we estimate an effect of.426 with a standard error of .019 (t>21, p<10−12, state clustered). A Republican senator is 42.6 percentage points more likely to vote conservatively, on average, than a Democrat elected by the same state at the same time.
The consequences of elections extend beyond Congress. In the bottom panels of Figure 2, we assess the near-term consequences of elections in state legislatures. We replicate the previous analyses for lower and upper houses, respectively, including state-chamber-year fixed effects for efficiency. The sample only includes chambers with single-member districts. Because roll-call data are only available for two, two-year periods – 1999–2000 and 2011–12 – we only include the elections leading directly into these periods. The election of a Republican in lower houses leads to a 37.6 percentage point increase in conservative roll-call behavior (standard error=1.1 percentage points; t>34; p<10−14; district clustered). This effect is 41.0 percentage points (standard error = 1.8 percentage points; t>22; p<10−12; district clustered) in upper houses. As in Congress, the result of a coin-flip election in a moderate district dramatically influences the roll-call representation received by that district in the near term. In each setting, Republicans vote more conservatively than Democrats representing the same electorate on approximately four out of ten bills.
Across American legislatures, elected representatives do not converge to the median voter in their constituency. If they did, there would be no difference in the roll-call behavior of Democrats and Republicans representing the same electorate. The wide gulf between the parties means that elections have immediate consequences for representation. At any point in time, legislators’ representation of constituents varies systematically based on the party elected to office, holding the district’s underlying preferences constant. In the next sections, we assess the effects of election results over longer periods of time and show that these consequences persist well into the future.
Long-Term Effects of One Election Result on Subsequent Election Results
Decades of research have demonstrated the electoral value of incumbency.Footnote 43 In short, political candidates appear to benefit electorally simply by virtue of being the incumbent. Lee employs an RD design in the US House to demonstrate that a Republican victory in a close election dramatically increases the chances of a Republican victory in the next election cycle, relative to the counterfactual scenario in which the Democratic candidate barely wins instead.Footnote 44 Here, we expand on Lee’s analysis to explore the effects of one election not just on the next election but on many elections downstream. A single election for a House, Senate or state legislative seat can influence the results of future elections for many terms. Because of the large and accumulating returns to incumbency, elections have long-term consequences for future elections.
In order to assess the long-term effects of a single election, we employ another RD design like that in the previous section:
 $$\eqalignno{ RepublicanVictory(t{\plus}k)_{{it}} =&\,\beta {\asterisk}RepublicanVictory(t)_{{it}} \cr & {\plus} \gamma {\asterisk}f(RepublicanVoteShare_{{it}} ){\plus}\delta _{t} {\plus}{\varepsilon}_{{it}} . $$
The only difference here is that the dependent variable has been replaced with a dummy variable indicating a Republican victory at time t+k. As a result, β indicates the effect of a Republican victory in one election on the probability of a Republican victory in another election k terms later.Footnote 45 For k=0, β is equal to 1 by convention. The present election perfectly predicts the party of the elected official. For k=1, we know that β is large and positive for the US House from Lee. The result of one election significantly influences the result of the next election. Across all offices studied, we find that the result of one election affects many further elections downstream. In other words, partisan representation is strongly persistent.
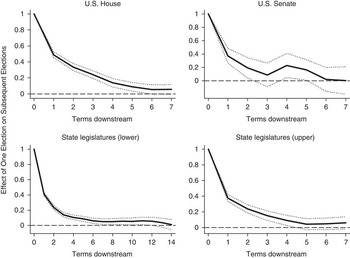
Figure 3 shows the results of this analysis for all four settings: the House, Senate, and lower and upper chambers of state legislatures. We plot the estimated effect of elections, β, along with its estimated 95 percent confidence interval across the number of elections downstream, k. As before, the sample for Congress includes all elections between 1946 and 2010. For k=1, our results are consistent with Lee. If the Republican Party wins a coin-flip election in the US House, it will be 49 percentage points more likely to win the next election as well. The effect of a Republican victory two elections downstream is 34 percentage points. Three elections downstream, the effect is 24 percentage points. Even five elections downstream, the effect is 9 percentage points and is strongly statistically significant (p=.001). This finding bears repeating. The election of a Republican in a House district today makes the district 9 percentage points more likely to elect a Republican ten years from now and therefore be represented by a Republican twelve years from now.
Effect of one election on subsequent elections
Note: the figure shows the long-term consequences of one election for subsequent election results in four different settings. Dotted lines indicate 95 percent confidence intervals (standard errors are clustered by constituency). Each data point on the graphs represents a separate RD estimate of the effect of one election on some downstream election. The estimate of .49 at the second term for the US House shows that a Republican victory in one election increases the probability of a Republican victory in the next election by 49 percentage points. Across all four settings, we see that the effects of one election persist for long periods of time. The election of a Republican or Democrat in one election exhibits a statistically significant effect on five terms downstream in the US House, five terms downstream in the US Senate, twelve terms downstream in the lower chambers of state legislatures and four terms downstream in the upper chambers. For Congress, we include all elections between 1948 and 2010, and for state legislatures, we include all elections from 1972 to 2010. US House terms are two years, Senate terms are six years, most lower chamber terms are two years and most upper chamber terms are four years. Therefore, the result of a single coin flip election influences the party representing a particular electorate for the next twelve years in the US House, thirty-six years in the US Senate, twenty-six years in lower chambers and twenty years in upper chambers.

The results are even more striking in the other settings. In the Senate, which has six-year terms, we detect a statistically significant effect in elections five terms downstream. For lower chambers of state legislatures, which typically have two-year terms, we detect effects through twelve elections downstream. For upper chambers, which typically have four-year terms, we detect effects through four elections downstream. In other words, a single election influences the party representing an electorate for thirty-six years in the Senate, twenty-six years in lower chambers and twenty years in upper chambers.
Not only are the findings in Figure 3 significantly larger than zero; they are significantly larger than would be predicted by a static incumbency advantage. Although previous studies of the returns to incumbency have focused exclusively on the effects of one election on the next election, a clear implication of this research is that the next election at time t+1 also exhibits an effect on the election at t+2 and so on. We can model these elections as a Markov chain in which the party of the incumbent is randomly chosen in each period according to probability weights determined by a known, constant incumbency advantage.Footnote 46 For example, if the Republicans win the election at time 1 with probability p, then we would expect them to win the election at time 2 with probability p×p or p 2. Since the literature suggests that p is large, we would expect to see long-term effects of one election on future elections in this Markov chain model. However, the effects that we find here are larger than would be predicted even by this model.
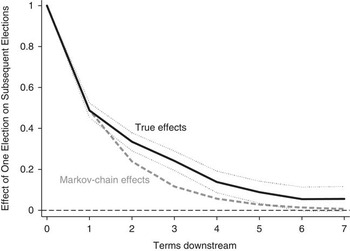
Figure 4 presents the same results shown in the top-left panel of Figure 3 in conjunction with the hypothetical effects predicted by a Markov chain model. For example, the model predicts an effect of 24 percentage points two terms downstream, but we observe a 34 percentage-point effect. This is consistent with the hypothesis that the returns to incumbency increase with seniority,Footnote 47 but it is distinct from analyses of how re-election rates or vote shares vary with terms of service. Our analysis speaks to the causal advantage that incumbency delivers downstream, removing other differences between senior and junior incumbents that affect their electoral performance. Because the returns to incumbency appear to accumulate, the downstream effects of elections are greater than expected.
Hypothetical versus actual returns to incumbency
Note: the black curve is identical to that in the top-left panel of Figure 3, showing the downstream effects of one election result on subsequent elections results in the US House. Long-term effects of elections are expected simply because one election influences the next election. However, the duration of effects that we observe is even greater than we would expect from a simple Markov chain model. The gray, dashed curve shows the hypothetical effects that we would expect to observe in a Markov chain model. The actual downstream effects of one election are even larger than we would have expected from a simple incumbency advantage model, showing that multiple terms of incumbency exhibit a larger effect on subsequent elections than just one term of incumbency.

The findings in Figures 3 and 4 are particularly striking in light of several factors that should mitigate the long-term returns to incumbency. Over the course of multiple terms, national partisan tides can rise and fall. The fact that some election years greatly benefit Republicans (for example, 1994) and others benefit Democrats (for example, 2006) should mitigate the persistent effects that we detect.Footnote 48 Similarly, trends and changes in the partisan preferences of districts over time should make it even harder for the same party to win re-election repeatedly. Similarly, the demographic characteristics of a district can change dramatically over the course of a decade,Footnote 49 which should further reduce the long-term consequences of elections. Finally, House districts are redrawn every ten years, further altering the composition of districts.Footnote 50 Even though a district’s composition and preference will change, and even though the political climate will certainly be different, an election today influences many election results in the distant future.
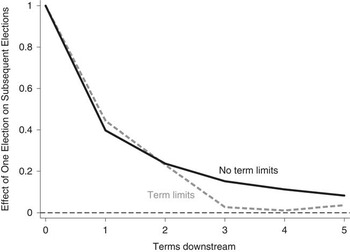
Previous research suggests that incumbent candidates receive a significant electoral benefit simply by virtue of being the incumbent, but that the incumbent party receives no separate benefit.Footnote 51 As a result, we suspect our results are explained by individual incumbents seeking re-election over a long period of time and not by the parties themselves receiving long-term electoral benefits. This hypothesis leads to several testable predictions in our data. First, we should see greater long-term effects in state legislatures without term limits compared to those with term limits. Term limits exogenously prevent individual incumbents from running for re-election,Footnote 52 thereby eliminating the personal effects of incumbency in certain elections while preserving any advantage the party receives for having held the seat. If the long-term effects we have documented stem from personal incumbency status, then this reduction in the frequency of incumbents running for re-election should curtail the long-term effects. Figure 5 tests this hypothesis explicitly by plotting the long-term effects of elections separately for state legislative settings with and without term limits. As expected, the effects of election results diminish much more quickly in state legislatures with term limits. When term limits force incumbents to retire, the persistent effects of election results vanish with them.
Effects are less persistent in state legislatures with term limits
Note: this figure tests whether the effects of election results over time are driven primarily by individual incumbents who continue to seek re-election over long periods of time by examining state legislative elections with and without term limits. In settings with term limits, the effects of election results are much less persistent than they are in settings without term limits, suggesting that the persistence observed in this study is driven primarily by personal incumbency advantages. Individual legislators continue to win re-election over long periods of time, even when they initially won in a coin flip. When term limits force incumbents to retire, the persistent effects of elections results diminish quickly.

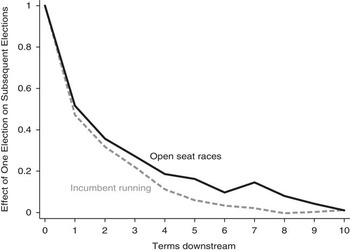
A second testable hypothesis is that the persistent effects of election results should be greater when candidates are young. Younger candidates have longer time horizons and therefore more opportunities to seek re-election in the future. To test this hypothesis, Figure 6 replicates the US House analysis separately for open-seat races, in which candidates are likely to be younger,Footnote 53 and those in which an incumbent sought re-election. For open-seat races, we see that the shadow of the current election extends even farther forward in time. The results from both Figures 5 and 6 are consistent with previous research and suggest that the long-term consequences of election results are a personal phenomenon, driven by individual incumbents who gain popularity with voters and continue to seek re-election over long periods of time.
Effects are more persistent in open seat races
Note: the figure separates open-seat US House races from those in which an incumbent seeks re-election at time 0. The curves show the downstream effects of one election result on subsequent elections for each set of elections. In the case of open seat races in which the candidates are typically younger and have longer time horizons, the effects of election results persist for nine to ten terms downstream, influencing the party of the district’s representative for the next twenty years, while the effects of elections results in which an incumbent seeks re-election persist for only six or seven terms, on average. This analysis further suggests that the long-term returns on incumbency arise from large personal incumbency advantages and the career goals of individual legislators.

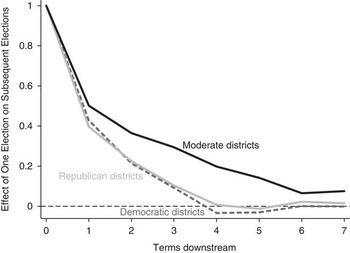
We can also explore variation in the persistent effects of election results across district partisanship. We might only expect to find long-term consequences of elections in moderate districts, which are evenly split between the parties, because partisan districts should revert to their normal partisan leanings even if they happen to elect a representative from the other party once. To test this hypothesis, we divide Congressional districts according to their normal partisan voting in presidential elections and replicate the analysis from the top-left panel of Figure 3 on each subset.Footnote 54 The results are shown in Figure 7. As expected, the effects of elections are most persistent in moderate districts. However, even in highly partisan districts, close elections have large and persistent consequences for the next three or four elections. If a partisan district happens to elect a representative from the other party in an unusually close election, it may not correct this mismatch for years. Even a fluke election in a highly partisan electorate influences the party representing the district for the next eight years.
Effects are even persistent (but less so) in highly partisan districts
Note: the figure extends the US House results from Figure 3 by subsetting congressional districts by partisanship. While the effects of elections are most persistent for moderate districts (as indicated by their normal presidential vote), we still see these effects in the most Democratic quarter and the most Republican quarter of districts. Even in these highly partisan districts, a single close election influences subsequent elections three terms downstream. This is evidence of significant ideological mismatches between legislators and constituents. When Republican districts happen to elect Democratic representatives by chance, they continue to re-elect them for several terms.

Long-Term Consequences of Elections for Roll-Call Voting and Representation
To assess the long-term consequences of election results for representation, we repeat our previous identification strategy, using the CVP of a district’s representative k terms downstream from the initial election.
 $$CVP(t{\plus}k)_{{it}} =\beta {\asterisk}RepublicanVictory(t)_{{it}} {\plus}\gamma {\asterisk}f(RepublicanVoteshare_{{it}} ){\plus}\delta _{t} {\plus}{\varepsilon}_{{it}} $$
We have already shown that elections have large consequences on representation for k=0. In this section, we show that these effects persist for many terms.
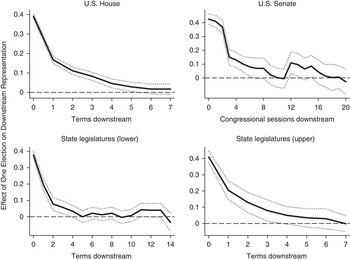
Figure 8 plots the results of this analysis for Congress and state legislatures with the top-left panel focusing on the US House. Figure 2 already shows these results for k=0; the election of a Republican in a coin-flip election in the US House causes the district’s representative to vote conservatively 39.1 percentage points more often. In the next term, the effect is 16.7 percentage points, then 11.1 percentage points, then 8.2 percentage points. Even five terms downstream, we see a statistically significant 2.8 percentage-point effect. In the US House, the result of one coin-flip election influences the representation received by the electorate for at least the next twelve years. Keep in mind that k=0 applies to the first two years after the election, k=1 applies to the third and fourth years, etc., so a statistically significant effect at k=5 means that an election result influences the way the district is represented in years eleven and twelve.
Long-term consequences of election results for legislative representation Note: the figure demonstrates the effect of coin-flip elections on the voting behavior of a district’s representative for many years downstream in four different settings. Each data point represents a separate RD estimate. Dotted lines indicate 95 percent confidence intervals (standard errors are clustered by constituency). For example, for the US House in the top-left panel, in the first term, close election results influence a district’s roll-call representation by 39.0 percentage points. Over the course of the next seven terms, this effect gradually decreases to 16.7, 11.1, 8.2, 4.6, 2.8, 1.7 and 1.7 percentage points. The effect of a single election persists for at least five terms downstream, meaning that a coin-flip election now will influence representation for the next twelve years, on average. There are similar patterns in upper chambers of state legislatures and even longer-term effects in the US Senate and lower chambers of state legislatures. For the Senate, these effects are plotted across two-year congressional sessions rather than six-year Senate terms. State legislative terms are typically four years for upper chambers and two years for lower chambers, meaning that the result of a single coin-flip election influences the way the district is represented in the legislature for well over a decade in all four settings.

The top-right panel of Figure 8 presents a similar analysis for the US Senate. Instead of analyzing six-year terms, we analyze two-year Congresses. For k=0, we focus on the two-year period immediately following an election. As we saw in Figure 2, a single election corresponds to a 42.6 percentage-point change in roll-call voting. Due to the long careers of senators, we detect a statistically significant effect of 8.4 percentage points even fifteen sessions downstream, more than three decades after the election.
The bottom panels of Figure 8 demonstrate the long-term representational consequences of elections in lower and upper chambers of state legislatures, respectively. Because we only have roll-call data for state legislators for two periods (1999–2000 and 2011–12), the dependent variable remains the same across different values of k, but the proximity of the election from this time period increases as k increases. For lower houses, we detect a significant effect as far as eleven terms downstream. For upper houses, we detect a statistically significant effect three terms downstream. Because lower chamber terms typically last two years and upper chamber terms typically last four years, the consequences of elections persist for at least twenty-four years in lower chambers and twelve years in upper chambers. These results are consistent with observations that state legislators – especially those in lower chambers – are often career politicians.Footnote 55 Even when they enter the legislature by barely winning a coin-flip election, they can remain in power for decades.
In all legislative settings analyzed, we find that elections have large and immediate consequences for roll-call representation, which is consistent with the literature on the effects of parties and the extent to which Democratic and Republican candidates diverge from one another. We further find that this phenomenon persists over long periods of time. Across the House, Senate and state legislatures, a single close election that arbitrarily selects a Democrat or Republican changes the district’s representation for decades.
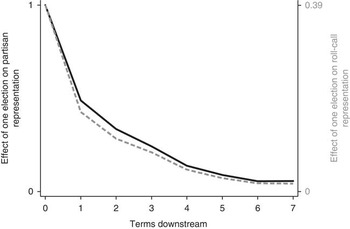
Combining our analyses of both election results and roll-call voting, we can also test whether legislators moderate or adapt their roll-call votes to the district over time. Perhaps one way that legislators keep themselves in power for long periods of time is by learning the district’s positions and adjusting accordingly. If legislators improve or moderate over time, then we should see the long-term consequences of election results for roll-call representation decay more quickly than the long-term consequences of election results for subsequent election results and partisan representation. We would expect this because Democratic and Republican legislators would represent the same districts more similarly over time, lessening the consequences of election results for roll-call representation. In other words, legislative improvement over time would mean that Figures 3 and 8 would look different – with the point estimates in Figure 8 falling to zero more quickly. Figure 9 essentially overlays the results from these two figures for the US House after stretching them so that they start at the same point in the first period.Footnote 56 The long-term consequences of election results for partisan representation and roll-call representation decay in almost exact proportion to one another, suggesting that legislators do not, on average, improve over time. Even when a legislator fails to closely match her district, and even when the district continues to re-elect her over the course of many terms, the legislator continues to cast roll-call votes in the same way without moderating to the positions of the district.
Do legislators improve over time?
Note: by essentially overlaying Figures 3 and 8, this figure tests whether legislators improve or moderate over time. Can the ability of legislators to learn about their districts and adapt over time explain the persistent effects of one election on subsequent elections? If legislators improve over time in adapting their roll-call behavior to the preferences of their districts, the gray, dashed curve (the persistent effect of one election on roll-call representation) should decrease faster than the black, solid curve (the persistent effect of one election on partisan representation). These two curves track one another in nearly perfect proportion, suggesting that legislators do not keep themselves in power by adapting their roll-call behavior to the district’s preferences. Instead, legislators continue to vote in the same way, on average, as when they were originally elected.

Taken together, these results paint a picture of divergent and persistent representation in American legislatures. At the district level, a single election result can change the way the district is represented in the legislature for decades. Moreover, this representational inertia at the district level leads to representational inertia at the aggregate level as well. Divergent and persistent representation at the district level means that there will be long stretches of time in which the median member of the legislature is consistently to the left or right of the median voter across all districts (or the median voter in the median district). Therefore, the long-term consequences of election results can help us understand why American history has witnessed long stretches of congressional rule by one party, even when the public has been relatively evenly divided between two parties.
Figures 3 and 8 present the average long-term consequences of election results for the entire period of analysis. However, previous research suggests that incumbency advantagesFootnote 57 and partisan polarizationFootnote 58 have changed significantly over time, suggesting that these long-term consequences may have changed as well. Figures A.7 and A.8 in the Appendix explore this variation and present estimates of these long-term consequences across different eras. Consistent with expectations, the consequences of elections increased in the last half of the twentieth century. Furthermore, consistent with recent evidence that incumbency advantage may be in decline,Footnote 59 these consequences appear to have declined in recent years, suggesting that the phenomena uncovered in this article may not apply as strongly in the future. Nonetheless, these changes over time are relatively small, and the consistency of our findings across eras is more striking than the small variations over time.
The divergence of Democratic and Republican candidates means that many electorates are unable to choose representatives that match their preferences and must choose between one extreme or the other,Footnote 60 even though the typical electorate appears to prefer moderate, non-partisan representatives.Footnote 61 What is more, the election of one extremist will rarely be counteracted in the next term through incumbent replacement or through the adaptation of roll-call voting to district preferences. When a moderate electorate happens to elect one partisan, even in a coin-flip election, it will continue to elect the same party and receive the same kind of representation for a long period of time.
Discussion and Conclusion
The results of this study leave us with an interesting puzzle about American voting behavior. Why do American voters re-elect their incumbents at such high rates and over such long periods of time, even when their representatives do not closely represent their preferences or converge to their preferences over time? Similarly, given citizens’ apparent preference for moderate representatives, why do opportunistic challengers fail to mitigate these effects by catering to the preferences of the electorate?
We can briefly rule out several potential explanations. Some citizens may be demobilized by mismatched representation, meaning that close election results change the partisan composition of the voting population in subsequent elections. Our own preliminary analysis of the turnout of party registrants following close elections suggests that the magnitude of this effect is not nearly large enough to explain the patterns observed in this article. Voter turnout may be a part of the explanation, but it can only be a small part. Another explanation is that close election results change the partisan composition of the district by either changing the attitudes of those living in the districtFootnote 62 or by changing the composition of citizens moving in and out of it. However, our own analysis – along with previous results – suggests that close election results do not change the voting behavior of the electorate in other races.Footnote 63
Perhaps incumbent legislators keep themselves in power, despite mismatched representation, because they bring significant benefits to their constituents aside from their roll-call record.Footnote 64 However, for the outcome that is most observable (and presumably most important) – federal spending – there is no evidence that experienced members of Congress are more effective than rookies,Footnote 65 suggesting that voters have no pork-based incentive to re-elect their mismatched incumbents. Alternatively, perhaps mismatched incumbents keep themselves in power by catering to their constituents on the particular roll-call votes that are most important. After all, our analyses average across all roll-call votes without paying special attention to those that might be most relevant to a particular set of constituents. However, additional research suggests that divergence is significant across virtually all policy domains, and does not decrease even when constituents have strong interests in a particular policy domain.Footnote 66
Another possibility, for which we offer no direct evidence, is that voters use incumbency and seniority as informational shortcuts. In a world of low and decreasing levels of political knowledge,Footnote 67 voters may increasingly look to crude indicators like incumbency to signal competence and quality. Some studies find that in low-information elections, vote choices are influenced by incumbency per se,Footnote 68 but other studies find no such effect.Footnote 69 Relatedly, voters may care about the way that their legislators cast roll-call votes,Footnote 70 but they may not know enough about their behavior to hold them accountable. We suspect that these informational stories play a crucial role in explaining the long-term consequences of election results, and we hope that future investigation will further our understanding of these phenomena. Future analyses and theories of incumbent advantages must grapple with the facts established in this study: the consequences of election results are greater than previously thought, span more than a decade and are consistent across different legislative contexts in the United States.
Supplementary Material
To view supplementary material for this article, please visit http://dx.doi.org/10.1017/S0007123415000241