





%20--%3e%3c!DOCTYPE%20svg%20PUBLIC%20'-//W3C//DTD%20SVG%201.0//EN'%20'http://www.w3.org/TR/2001/REC-SVG-20010904/DTD/svg10.dtd'%3e%3csvg%20version='1.0'%20id='Layer_1'%20xmlns='http://www.w3.org/2000/svg'%20xmlns:xlink='http://www.w3.org/1999/xlink'%20x='0px'%20y='0px'%20width='64px'%20height='64px'%20viewBox='5.5%20-3.5%2064%2064'%20enable-background='new%205.5%20-3.5%2064%2064'%20xml:space='preserve'%3e%3cg%3e%3ccircle%20fill='%23FFFFFF'%20fill-opacity='0'%20cx='37.785'%20cy='28.501'%20r='28.836'/%3e%3cpath%20fill='%23595959'%20d='M37.441-3.5c8.951,0,16.572,3.125,22.857,9.372c3.008,3.009,5.295,6.448,6.857,10.314%20c1.561,3.867,2.344,7.971,2.344,12.314c0,4.381-0.773,8.486-2.314,12.313c-1.543,3.828-3.82,7.21-6.828,10.143%20c-3.123,3.085-6.666,5.448-10.629,7.086c-3.961,1.638-8.057,2.457-12.285,2.457s-8.276-0.808-12.143-2.429%20c-3.866-1.618-7.333-3.961-10.4-7.027c-3.067-3.066-5.4-6.524-7-10.372S5.5,32.767,5.5,28.5c0-4.229,0.809-8.295,2.428-12.2%20c1.619-3.905,3.972-7.4,7.057-10.486C21.08-0.394,28.565-3.5,37.441-3.5z%20M37.557,2.272c-7.314,0-13.467,2.553-18.458,7.657%20c-2.515,2.553-4.448,5.419-5.8,8.6c-1.354,3.181-2.029,6.505-2.029,9.972c0,3.429,0.675,6.734,2.029,9.913%20c1.353,3.183,3.285,6.021,5.8,8.516c2.514,2.496,5.351,4.399,8.515,5.715c3.161,1.314,6.476,1.971,9.943,1.971%20c3.428,0,6.75-0.665,9.973-1.999c3.219-1.335,6.121-3.257,8.713-5.771c4.99-4.876,7.484-10.99,7.484-18.344%20c0-3.543-0.648-6.895-1.943-10.057c-1.293-3.162-3.18-5.98-5.654-8.458C50.984,4.844,44.795,2.272,37.557,2.272z%20M37.156,23.187%20l-4.287,2.229c-0.458-0.951-1.019-1.619-1.685-2c-0.667-0.38-1.286-0.571-1.858-0.571c-2.856,0-4.286,1.885-4.286,5.657%20c0,1.714,0.362,3.084,1.085,4.113c0.724,1.029,1.791,1.544,3.201,1.544c1.867,0,3.181-0.915,3.944-2.743l3.942,2%20c-0.838,1.563-2,2.791-3.486,3.686c-1.484,0.896-3.123,1.343-4.914,1.343c-2.857,0-5.163-0.875-6.915-2.629%20c-1.752-1.752-2.628-4.19-2.628-7.313c0-3.048,0.886-5.466,2.657-7.257c1.771-1.79,4.009-2.686,6.715-2.686%20C32.604,18.558,35.441,20.101,37.156,23.187z%20M55.613,23.187l-4.229,2.229c-0.457-0.951-1.02-1.619-1.686-2%20c-0.668-0.38-1.307-0.571-1.914-0.571c-2.857,0-4.287,1.885-4.287,5.657c0,1.714,0.363,3.084,1.086,4.113%20c0.723,1.029,1.789,1.544,3.201,1.544c1.865,0,3.18-0.915,3.941-2.743l4,2c-0.875,1.563-2.057,2.791-3.541,3.686%20c-1.486,0.896-3.105,1.343-4.857,1.343c-2.896,0-5.209-0.875-6.941-2.629c-1.736-1.752-2.602-4.19-2.602-7.313%20c0-3.048,0.885-5.466,2.658-7.257c1.77-1.79,4.008-2.686,6.713-2.686C51.117,18.558,53.938,20.101,55.613,23.187z'/%3e%3c/g%3e%3c/svg%3e)
%20--%3e%3c!DOCTYPE%20svg%20PUBLIC%20'-//W3C//DTD%20SVG%201.0//EN'%20'http://www.w3.org/TR/2001/REC-SVG-20010904/DTD/svg10.dtd'%3e%3csvg%20version='1.0'%20id='Layer_1'%20xmlns='http://www.w3.org/2000/svg'%20xmlns:xlink='http://www.w3.org/1999/xlink'%20x='0px'%20y='0px'%20width='64px'%20height='64px'%20viewBox='5.5%20-3.5%2064%2064'%20enable-background='new%205.5%20-3.5%2064%2064'%20xml:space='preserve'%3e%3cg%3e%3ccircle%20fill='%23FFFFFF'%20fill-opacity='0'%20cx='37.637'%20cy='28.806'%20r='28.276'/%3e%3cg%3e%3cpath%20fill='%23595959'%20d='M37.443-3.5c8.988,0,16.57,3.085,22.742,9.257C66.393,11.967,69.5,19.548,69.5,28.5c0,8.991-3.049,16.476-9.145,22.456%20C53.879,57.319,46.242,60.5,37.443,60.5c-8.649,0-16.153-3.144-22.514-9.43C8.644,44.784,5.5,37.262,5.5,28.5%20c0-8.761,3.144-16.342,9.429-22.742C21.101-0.415,28.604-3.5,37.443-3.5z%20M37.557,2.272c-7.276,0-13.428,2.553-18.457,7.657%20c-5.22,5.334-7.829,11.525-7.829,18.572c0,7.086,2.59,13.22,7.77,18.398c5.181,5.182,11.352,7.771,18.514,7.771%20c7.123,0,13.334-2.607,18.629-7.828c5.029-4.838,7.543-10.952,7.543-18.343c0-7.276-2.553-13.465-7.656-18.571%20C50.967,4.824,44.795,2.272,37.557,2.272z%20M46.129,20.557v13.085h-3.656v15.542h-9.944V33.643h-3.656V20.557%20c0-0.572,0.2-1.057,0.599-1.457c0.401-0.399,0.887-0.6,1.457-0.6h13.144c0.533,0,1.01,0.2,1.428,0.6%20C45.918,19.5,46.129,19.986,46.129,20.557z%20M33.042,12.329c0-3.008,1.485-4.514,4.458-4.514s4.457,1.504,4.457,4.514%20c0,2.971-1.486,4.457-4.457,4.457S33.042,15.3,33.042,12.329z'/%3e%3c/g%3e%3c/g%3e%3c/svg%3e)
1. Introduction
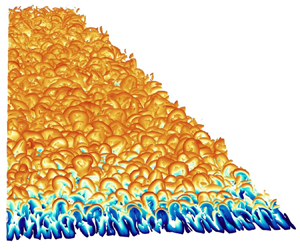
Wall-bounded turbulence is a phenomenon of huge technological importance in many industrial and environmental applications. Understanding and predicting the behaviour of turbulent flows are critical in various fields, such as energy production, environmental modelling and fluid-dynamics research. However, investigating turbulent flow in complex geometries poses considerable challenges from both numerical and experimental perspectives. For this reason, simpler geometries are chosen when the fundamental physics of the flow is studied. One canonical flow case widely used in the literature is the boundary layer developing on a flat surface (Spalart Reference Spalart1988; Schlatter et al. Reference Schlatter, Örlü, Li, Brethouwer, Fransson, Johansson, Alfredsson and Henningson2009). The spatially evolving fully turbulent boundary layer has been studied using different experimental techniques (Österlund Reference Österlund1999; Rahgozar, Maciel & Schlatter Reference Rahgozar, Maciel and Schlatter2013; Shehzad et al. Reference Shehzad, Sun, Jovic, Ostovan, Cuvier, Foucaut, Willert, Atkinson and Soria2021) with researchers constantly improving the measurement techniques (Örlü & Alfredsson Reference Örlü and Alfredsson2010; Bailey et al. Reference Bailey2013; Vinuesa & Nagib Reference Vinuesa and Nagib2016) to obtain reliable measurements at high Reynolds numbers (Samie et al. Reference Samie, Marusic, Hutchins, Fu, Fan, Hultmark and Smits2018). At the same time, direct numerical investigations of turbulent boundary layers have been performed in several studies (Spalart Reference Spalart1988; Ferrante & Elghobashi Reference Ferrante and Elghobashi2005; Wu & Moin Reference Wu and Moin2009; Simens et al. Reference Simens, Jiménez, Hoyas and Mizuno2009; Schlatter et al. Reference Schlatter, Li, Brethouwer, Johansson and Henningson2010) implementing different solution methods for an increasing range of Reynolds numbers. Given the resolution limitations of experimental techniques in capturing the near-wall region of boundary-layer flow, direct numerical simulations (DNSs) have emerged as a valuable tool for investigating the transport phenomena in turbulence (Araya & Castillo Reference Araya and Castillo2012). However, the applicability of DNS is currently constrained to low-Reynolds-number flows due to its significant computational costs. Despite this limitation, DNS has proven instrumental in the study of turbulent boundary layers. Further, not limited to canonical flows, DNSs have been extended to more complex geometries such as airfoils (Vinuesa et al. Reference Vinuesa, Hosseini, Hanifi, Henningson and Schlatter2017). These simulations have not only led to detailed insights into velocity profiles, turbulence statistics and the near-wall dynamics to name a few, but have also served as a validation to experiments and thereby they have contributed to refining turbulence models, establishing scaling laws and exploring turbulent coherent structures.
In practical engineering applications, the consideration of heat and mass transfer, turbulent mixing, combustion and other related phenomena is crucial for understanding and optimizing various systems (Kozuka, Seki & Kawamura Reference Kozuka, Seki and Kawamura2009). In these scenarios, scalar quantities such as temperature play a significant role and need to be accurately simulated. Additionally, understanding and predicting the dynamics of passive scalars like air and water pollutants play an important role in local and global environmental problems (Kasagi & Iida Reference Kasagi and Iida1999; Lazpita et al. Reference Lazpita, Martínez-Sánchez, Corrochano, Hoyas, Le Clainche and Vinuesa2022), as well as in the design of transport and energy systems (Straub et al. Reference Straub, Forooghi, Marocco, Wetzel, Vinuesa, Schlatter and Frohnapfel2019).
Several experimental studies (Kays Reference Kays1972; Perry & Hoffmann Reference Perry and Hoffmann1976; Simonich & Bradshaw Reference Simonich and Bradshaw1978; Subramanian & Antonia Reference Subramanian and Antonia1981; Krishnamoorthy & Antonia Reference Krishnamoorthy and Antonia1987) have analysed different aspects of heat transfer of passive scalars in turbulent boundary layers. The investigation by Kays (Reference Kays1972) presented the variation of skin-friction coefficient and Stanton number (which characterizes the ratio of the heat transfer into the fluid to the thermal capacity of the fluid) in the boundary layer over a transpiring wall, with different blowing and suction conditions for a constant free-stream velocity condition. They have also discussed and proposed theoretical models to enable the prediction of heat transfer in a turbulent boundary layer. A zero-pressure-gradient turbulent boundary layer with constant wall-temperature conditions was set up by Perry & Hoffmann (Reference Perry and Hoffmann1976), which enabled them to test similarity relations between instantaneous heat and momentum fluxes. Simonich & Bradshaw (Reference Simonich and Bradshaw1978) investigated the effects of free stream on heat transfer in a turbulent boundary layer and reported an increase in Stanton number with respect to free-stream turbulence. Subramanian & Antonia (Reference Subramanian and Antonia1981) studied the effects of Reynolds number in a turbulent boundary layer and reported the Kármán and additive constants in the logarithmic law for velocity and temperature to be independent of Reynolds number. Further, Krishnamoorthy & Antonia (Reference Krishnamoorthy and Antonia1987) were able to measure the three components of average temperature dissipation very close to the wall in a turbulent boundary layer, in the effort to model turbulence for the computation of temperature fields. Thereby, the heat-transfer behaviour has been a subject of continuous investigation from both engineering and numerical-modelling perspectives.
In numerical investigations, the fluid temperature can be considered as a passive scalar, provided that the buoyancy effects and the temperature dependence of fluid properties are considered as negligible (Chandrasekhar Reference Chandrasekhar1961; Monin & Yaglom Reference Monin and Yaglom1971). Note that the passive scalar as simulated in the DNS is a diffusive contaminant in the fluid flow. Due to its low concentration, it does not have an influence on the fluid but is influenced by the fluid motion. Although the discussion of passive scalars is in the context of a thermal boundary layer, it could very well be considered as a pollutant concentration, in which case the Schmidt number would be the mass transfer analogous to the Prandtl number. Considering the passive scalar to represent temperature, many DNS studies of turbulent scalar transport have been performed to analyse the convective heat transfer between the fluid and solid walls in spatially developing flows. Bell & Ferziger (Reference Bell and Ferziger1993) first performed the DNS for a turbulent thermal boundary layer. Later, Kong, Choi & Lee (Reference Kong, Choi and Lee2000) performed a DNS at a Prandtl number of  ${\textit {Pr}}=0.71$ with different boundary conditions including isothermal (Dirichlet) and isoflux (Neumann) conditions, for
 ${\textit {Re}}_\theta$ ranging between 300 and 420 (note that
 ${\textit {Re}}_{\theta }$ is the Reynolds number based on momentum thickness where the momentum thickness quantifies the loss in momentum due to the presence of a boundary layer). The Reynolds-number range was extended in the studies by Hattori, Houra & Nagano (Reference Hattori, Houra and Nagano2007), who simulated
 ${\textit {Re}}_\theta$ from
 $1000$ to
 $1200$, at
 ${\textit {Pr}} = 0.71$. At the same time, the numerical investigations for Prandtl numbers up to
 ${\textit {Pr}}=2$ were performed by Tohdoh, Iwamoto & Kawamura (Reference Tohdoh, Iwamoto and Kawamura2008) for a relatively lower Reynolds-number range, up to
 ${\textit {Re}}_\theta =420$. The effect of different boundary conditions at
 ${\textit {Pr}}=0.2,\, 0.71$ and
 $2.0$ in the Reynolds-number range of
 ${\textit {Re}}_\theta \in [350,830]$ was reported by Li et al. (Reference Li, Schlatter, Brandt and Henningson2009). The thermal channel-flow simulations have been conducted at higher Prandtl numbers of 49 and low
 ${\textit {Re}}$ by Schwertfirm & Manhart (Reference Schwertfirm and Manhart2007) and at a
 ${\textit {Pr}}$ of 10 and high Reynolds number by Alcántara-Ávila & Hoyas (Reference Alcántara-Ávila and Hoyas2021). However, the thermal turbulent boundary layers have been only partially explored at a medium Prandtl number of 2 by Li et al. (Reference Li, Schlatter, Brandt and Henningson2009) owing to the significant computational cost associated with higher
 ${\textit {Pr}}$. In this study, we consider higher Prandtl numbers in a turbulent thermal boundary layer, reporting analyses that are currently not available in the literature, according to the authors’ knowledge. Thereby, the passive scalars at
 ${\textit {Pr}} = 1,2,4$ and
 $6$ are simulated for
 ${\textit {Re}}_\theta$ up to 1080 in a zero-pressure-gradient turbulent boundary layer using an isothermal wall boundary condition.
The details of the simulation set-up are provided in § 2. The statistics obtained from the simulation at different Prandtl numbers are compared with the data available in the literature for the fully developed thermal turbulent boundary layer in § 3. Since the thermal channel flow and thermal boundary layer exhibit similar behaviours in the near-wall region, the statistical quantities of the channel flow reported in the literature are also compared with the thermal boundary layer quantities at similar Reynolds number. In § 4 we analyse the distribution of energy in different scales for the wall-heat-flux field and wall-parallel fields at  $y^+ = 15, 30$ and
 $50$ (where the superscript ‘+’ denotes scaling in terms of friction velocity
 $u_{\tau }$, see § 2.4). The premultiplied two-dimensional power-spectral density provides additional insight into the scalar transport at different Prandtl numbers. Finally, a short summary of the observations discussed in this work is reported in § 5.
2. Methodology
2.1. Governing equations
A DNS of the zero-pressure-gradient (ZPG) turbulent boundary layer (TBL) is performed using the pseudo-spectral code SIMSON (Chevalier et al. Reference Chevalier, Schlatter, Lundbladh and Henningson2007). The code solves the governing equations in non-dimensional form (here, written in index notation), in particular the flow and scalar variables are non-dimensionalized as
 \begin{equation} \tilde{x}_{j} = \frac{x_{j}}{\delta_{0}^{*}}, \quad \tilde{U}_{j} = \frac{U_{j}}{U_{\infty}},\quad \tilde{t} = \frac{tU_{\infty}}{\delta_{0}^{*}}, \quad \tilde{P} = \frac{P}{\rho U_{\infty}^2}, \quad \tilde{\varTheta}_{i} = \frac{\varTheta_{i}-\varTheta_{i,w}}{\varTheta_{i,\infty}-\varTheta_{i,w}}, \end{equation}
where  $(x_1,x_2,x_3) = (x,y,z)$ are the Cartesian coordinates in the streamwise, wall-normal and spanwise directions, respectively, and
 $t$ denotes the time. The length scale used for the non-dimensionalization is the displacement thickness at
 $x=0$ and
 $t=0$, denoted by
 $\delta _{0}^{*}$. The corresponding instantaneous velocity components are denoted by
 $(U_1,U_2,U_3)=(U,V,W)$ with the mean quantities identified by
 $(\left \langle U\right \rangle,\left \langle V\right \rangle,\left \langle W\right \rangle )$ and the fluctuations by
 $(u,v,w)$. Here
 $U_{\infty }$ is the undisturbed laminar free-stream velocity at
 $x=0$ and time
 $t=0$. The total pressure is denoted by
 $P$ and the density and kinematic viscosity of the fluid are represented by
 $\rho$ and
 $\nu$, respectively. In this study, four different passive scalars
 $(\varTheta _1,\varTheta _2,\varTheta _3,\varTheta _4)$ are simulated at different Prandtl numbers
 $(Pr=1,2,4,6)$, respectively. Here,
 $\varTheta _{i,\infty }, \varTheta _{i,w}$ correspond to the
 $i$th scalar concentration in the free stream and at the wall, respectively, with the mean quantities indicated by
 $\left \langle \varTheta _i\right \rangle$ and the corresponding fluctuations by
 $\theta _i$,
 $i\in [1,2,3,4]$. The superscript
 $\tilde {\cdot }$ introduced in (2.1a–e) identifies a non-dimensional variable and it shall be dropped in the non-dimensional quantities for the rest of the sections for simplicity.
The non-dimensional form of the incompressible Navier–Stokes equation and the transport equation for passive scalars are given by
 \begin{gather} \frac{\partial U_{j}}{\partial x_{j}} = 0, \end{gather}
 \begin{gather}\frac{\partial U_{j}}{\partial t} + U_{k}\frac{\partial U_{j}}{\partial x_{k}} ={-}\frac{\partial P}{\partial x_{j}} + \frac{1}{{\textit{Re}}_{\delta_0^*}}\frac{\partial^2U_{j}}{\partial x_{k}\partial x_{k}} + F_{j}, \end{gather}
 \begin{gather}\frac{\partial \varTheta_{i}}{\partial t} + U_{k}\frac{\partial \varTheta_{i}}{\partial x_{k}} = \frac{1}{{\textit{Re}}_{\delta_0^*}{\textit{Pr}}}\frac{\partial^2\varTheta_{i}}{\partial x_{k}\partial x_{k}} + F_{\varTheta_i}, \end{gather}
where  ${\textit {Re}}_{\delta _0^*}$ identifies the Reynolds number based on the free-stream velocity
 $(U_{\infty })$ and the displacement thickness at the inlet
 $(\delta _0^*)$. The product of the Reynolds number based on free-stream velocity and the Prandtl number results in another non-dimensional number, called the Péclet number (
 ${\textit {Pe}} = {\textit {Re}}_{\delta _0^*}Pr$), which measures the ratio between the scalar convective transport and the scalar molecular diffusion. Here,
 $F_{j}$ and
 $F_{\varTheta _i}$ correspond to the volume force terms for the velocity and passive scalars, respectively. The velocity–vorticity formulation of the incompressible Navier–Stokes equation is implemented in the solver as the divergence-free condition is implicitly satisfied by the formulation.
2.2. Boundary conditions
Having defined the governing equations, the problem definition is completed by providing appropriate boundary conditions. At the wall, the velocity of the fluid is the same as that of the solid surface and is given by the following no-slip and no-penetration boundary conditions:
 \begin{equation} U\rvert_{y=0} = 0,\quad V\rvert_{y=0} = 0, \quad W\rvert_{y=0} = 0. \end{equation}
From the continuity equation, we also obtain
 \begin{equation} \left. \frac{\partial V}{\partial y}\right\rvert_{y=0} = 0. \end{equation}
The flow is assumed to extend to an infinite distance perpendicular to the plate, but discretizing an infinite domain is not feasible. Hence, a finite domain has to be considered, for which artificial boundary conditions have to be applied. A simple Dirichlet condition can be considered; however, the desired flow solution generally contains a disturbance that would be forced to zero. This would introduce an error due to the increased damping of the disturbances in the boundary layer (Lundbladh et al. Reference Lundbladh, Berlin, Skote, Hildings, Choi, Kim and Henningson1999). An improvement to the aforementioned boundary condition can be made by using the Neumann boundary condition given by
 \begin{equation} \left.\frac{\partial U_{j}}{\partial y}\right\rvert_{y=y_{L}} = \left.\frac{\partial \mathcal{U}_{j}}{\partial y}\right\rvert_{y=y_{L}}, \end{equation}
where  $y_{L}$ is the height of the solution domain in the wall-normal direction in physical space and
 $\mathcal {U}_{i}$ is the laminar base flow that is chosen as the Blasius flow for the present study. For the passive scalars a constant (isothermal) wall boundary condition is applied, as given by
 \begin{equation} \varTheta_{i}\rvert_{y=0}= \varTheta_{i,w} = 0, \end{equation}
which corresponds to a vanishing thermal-activity ratio  $K$. The thermal-activity ratio defines the ratio between the fluid density, thermal conductivity and specific heat capacity and the same properties of the boundary surface as defined below
 \begin{equation} K = \sqrt{\frac{\rho k C_{p}}{\rho_{w} k_{w} C_{p,w}}}. \end{equation}
Here,  $\rho _{w}$,
 $k_{w}$ and
 $C_{p,w}$ correspond to the density, thermal conductivity and specific heat capacity of the wall. The isothermal wall boundary condition corresponds to the fluid that exchanges heat with the boundary surface, without modifying the wall temperature. The boundary condition in the free stream is given by
 \begin{equation} \varTheta_{i}\rvert_{y=y_{L}} = \varTheta_{i,\infty} = 1. \end{equation}
2.3. Numerical scheme
The DNS is performed with a pseudo-spectral method, where Fourier expansions are used in the streamwise and spanwise directions and Chebyshev polynomials  $T_{k} (\xi )$ (on
 $-1\le \xi \le 1$) are used in the wall-normal direction employing the Chebyshev-tau method for faster convergence rates. The time advancement is performed using the second-order Crank–Nicholson scheme for linear terms and the third-order Runge–Kutta method for nonlinear terms, with a constant time step
 $\Delta t$. The maximum Courant number is set to 0.6. The nonlinear terms are calculated in physical space and the aliasing errors in the evaluation of these terms are removed by the 3/2 rule.
Since the TBL is developing in  $x$, the periodic boundary condition cannot be directly used in this particular direction, which requires a specific numerical treatment. In this regard, one approach is to impose an appropriate instantaneous velocity and scalar profile at the inlet for every time step. Assuming self-similarity of the flow in the streamwise direction, Lund, Wu & Squires (Reference Lund, Wu and Squires1998) proposed a rescaling–recycling method to generate the required inlet profiles based on the solution downstream. An alternative approach is the addition of the fringe region downstream of the physical domain to retain the periodicity in the streamwise direction as described by Bertolotti, Herbert & Spalart (Reference Bertolotti, Herbert and Spalart1992); Nordström, Nordin & Henningson (Reference Nordström, Nordin and Henningson1999). In this method, the disturbances are damped, and the flow is forced from the outflow of the physical domain to the same profile as the inflow. The fringe technique is used in the present study, as the inflow conditions from a laminar profile followed by tripping produce natural instantaneous fluctuations for the velocity and the scalar fields (Araya & Castillo Reference Araya and Castillo2012). The fringe region is implemented by adding a volume force
 $(F_{j}; F_{\varTheta _i})$ to the momentum and scalar transport equations ((2.3) and (2.4)), respectively. The forcing term is given by
 \begin{gather} F_{j} = \lambda(x)\left(\mathcal{U}_{j} - U_{j}\right), \end{gather}
 \begin{gather}F_{\varTheta_i} = \lambda(x)\left(\breve{\varTheta}_{i} - \varTheta_{i}\right), \end{gather}
where  $\lambda (x)$ is the strength of the forcing, which is non-zero only in the fringe region. The flow field at the inlet is the laminar Blasius profile
 $\mathcal {U}_{j}$ and for the scalar
 $\varTheta _i$ it is the linear variation with
 $y$ ranging from 0 to 1, denoted by
 $\breve {\varTheta }_i$.
2.4. Computational domain and numerical set-up
The laminar base flow is tripped by a random volume force strip  $(\text {at }x/\delta _0^* = 10)$ to trigger the transition of the flow to a turbulent state. For this simulation, a three-dimensional cuboid is considered with length, height and width equal to
 $x_{L}, y_{L}, z_{L}$, respectively. The lower surface of the cuboid is considered as a flat plate with no-slip boundary conditions. The boundary layer grows in the considered computational domain with initial thickness denoted by
 $\delta _{0}^{*}$. In the streamwise direction, the computational domain terminates with the fringe region. The vertical extent of the computational domain includes the whole boundary layer and the domain height is chosen based on the free-stream boundary condition. In particular, the problem set-up in this work is similar to that studied by Li et al. (Reference Li, Schlatter, Brandt and Henningson2009).
The computational domain is discretized by  $N_{x}, N_{y}$ and
 $N_{z}$ grid points in the streamwise, wall-normal and spanwise directions, respectively. The grid spacing is uniform in the streamwise and spanwise directions. For the wall-normal direction, the collocation points follow the Gauss–Lobatto distribution given by
 \begin{equation} y_{c} = \cos\left({\rm \pi}\frac{c}{N_{y}}\right) \quad c = 0,1,2,\ldots,N_{y}. \end{equation}
The computational box has dimensions  $1000\delta _0^*\times 40\delta _0^*\times 50\delta _0^*$ in the streamwise, wall-normal and spanwise directions, respectively. The number of grid points in each direction is
 $3200\times 385\times 320$, correspondingly. Note that the smallest scale in the scalar fluctuations is inversely proportional to
 ${\textit {Pr}}^{1/2}$ (Tennekes & Lumley Reference Tennekes and Lumley1972) and, hence, the Batchelor length scale
 $\eta _{\varTheta _i}$ (which is analogous to the smallest scale in turbulent flow, the Kolmogorov scale
 $\eta$) is estimated as
 $\eta Pr^{-1/2}$ (Kozuka et al. Reference Kozuka, Seki and Kawamura2009). Similarly, the ratio of the largest to the smallest scales is proportional to
 $Re^{1.5}Pr^{0.5}$ at high
 ${\textit {Pr}}$ (Batchelor Reference Batchelor1959; Tennekes & Lumley Reference Tennekes and Lumley1972). In this study, an adequate grid resolution is adopted to resolve all the physically relevant scales. The Reynolds number based on free-stream velocity and displacement thickness at the inlet is
 ${\textit {Re}}_{\delta _0^*} = 450$ and the friction Reynolds number based on local friction velocity
 $(u_\tau )$ and boundary-layer thickness
 $(\delta _{99})$ is
 ${\textit {Re}}_\tau = 46$. At the outlet, the Reynolds number based on displacement thickness is
 ${\textit {Re}}_{\delta _0^*} = 1,580$ and
 ${\textit {Re}}_\tau = 396$.
Considering the friction velocity  $u_{\tau }$ at the middle of the computational domain
 $(x/\delta _0^*=500\text {, corresponding to }{\textit {Re}}_\theta =794)$, the grid resolution in viscous units is
 $\Delta x^+=6.6$ and
 $\Delta z^+=3.3$ in the wall-parallel directions. In the wall-normal direction, we have an irregular distribution of collocation points, hence
 $\Delta y^+$ varies between
 $0.01$ and
 $3.5$. The results discussed at a particular streamwise position are inner scaled with respect to the local friction velocity, whereas, when the data along the streamwise direction are considered, the reference quantity at
 $x/\delta _0^* = 500$ is considered for inner scaling. This indicates that if a particular wall-parallel plane (
 $x$–
 $z$ plane) is sampled at a wall-normal distance (for e.g.
 $y^+=y_s$), considering the friction velocity at
 $x/\delta _0^* = 500$, the actual inner-scaled location varies along the streamwise direction, which is within
 $\pm 0.1y_s$ for the range of Reynolds numbers simulated in this work.
In this study, five different realizations of ZPG TBL are performed by introducing different trip forcings through modification of the random seed parameter, to obtain an ensemble average of the statistical quantities. All the different realizations are run for approximately 2400 time units  $({\delta _{0}^{*}}/{U_{\infty }})$ after one flow through of initial transience, which corresponds to 1000 time units
 $({\delta _{0}^{*}}/{U_{\infty }})$. The converged statistics are obtained with the data corresponding to 12,000 time units
 $({\delta _{0}^{*}}/{U_{\infty }})$, equivalent to 600 eddy-turnover times.
3. Comparison with data in the literature
3.1. Integral quantities and non-dimensional numbers
The shape factor  $H_{12}$, which measures the ratio between the displacement thickness
 $\delta ^{*}$ and the momentum thickness
 $\theta$, is plotted in figure 1. The shape factor is lower in the turbulent region with increasing
 ${\textit {Re}}_{\theta }$ and agrees well with the experimental and numerical data for
 ${\textit {Re}}_{\theta } > 600$ where the TBL is fully developed.
Streamwise evolution of the shape factor  $H_{12}$. (——, blue) Present DNS, (
 $\square$, blue) Simens et al. (Reference Simens, Jiménez, Hoyas and Mizuno2009), experimental data by (
 $\circ$, blue) Roach & Brierly (Reference Roach and Brierly1992), (
 $\vartriangle$, blue) Erm & Joubert (Reference Erm and Joubert1991), (
 $\triangledown$, blue) Purtell, Klebanoff & Buckley (Reference Purtell, Klebanoff and Buckley1981).

Figure 2 depicts the streamwise variation of the skin-friction coefficient  $C_{f}$ for the present simulation and indicates that the obtained result is in good agreement with the turbulent skin-friction solution provided by Schoenherr (Reference Schoenherr1932), which is given by
 \begin{equation} C_{f} = 0.31\left[\ln^2{\left(2{\textit{Re}}_{\theta}\right)} + 2\ln{\left(2{\textit{Re}}_{\theta}\right)}\right]^{{-}1}. \end{equation}
The computed skin-friction coefficient is also in good agreement with the correlation proposed by Smits, Matheson & Joubert (Reference Smits, Matheson and Joubert1983), which is given as
 \begin{equation} C_{f} = 0.024 {\textit{Re}}_{\theta}^{{-}1/4}. \end{equation}
The trip location is at  $x/\delta _0^*=10$, with a strong peak in the skin-friction coefficient followed by the transition to turbulence before
 $x/\delta _0^*=200$. The experimental data provided by Erm & Joubert (Reference Erm and Joubert1991) with wire tripping also closely correspond to the calculated turbulent skin-friction coefficient. It should be noted that Erm & Joubert (Reference Erm and Joubert1991) also repeated the experiments with different tripping devices and found the influence of tripping to persist until
 ${\textit {Re}}_{\theta } \approx 1500$. Due to this, Jiménez et al. (Reference Jiménez, Hoyas, Simens and Mizuno2010) found the experimental data to be scattered for
 ${\textit {Re}}_{\theta } <1070$ and also showed the scatter to decrease with
 ${\textit {Re}}_{\theta } > 1600$.
Variation of skin-friction coefficient along the streamwise direction. (——, blue) Present DNS, ( $\cdots \cdots$, blue) theoretical laminar skin-friction solution, (- - -, blue) turbulent solution given by Schoenherr (Reference Schoenherr1932), (
 $\circ$, blue) experimental data by Erm & Joubert (Reference Erm and Joubert1991) with wire tripping.

The Stanton number measures the convective heat transfer into the fluid with respect to the thermal capacity of the fluid. The spatial evolution of the Stanton numbers for different passive scalars scaled with the square root of  ${\textit {Pr}}$ (as plotted in figure 3) is very similar to the skin-friction profiles plotted in figure 2. There is a difference observed in the laminar Stanton number at
 $x=0$ with the present scaling. However, the individual Stanton-number profiles correspond well to the laminar solution (not shown in the figure) given by Kays & Crawford (Reference Kays and Crawford1993), which is
 \begin{equation} {\textit{St}} = \frac{0.332}{\sqrt{{\textit{Re}}_{x}}{\textit{Pr}}^{2/3}}, \end{equation}
and to the turbulent solution obtained from the Reynolds–Colburn analogy as given by Lienhard & John (Reference Lienhard and John2005). For  $\varTheta _{1}$, due to the Reynolds analogy, the Stanton profile matches with the skin-friction profile scaled by a factor of two. For the passive scalars at higher Prandtl numbers, a generalization of the Reynolds–Colburn analogy can be obtained, as reported in the study by Lienhard (Reference Lienhard2020)
 \begin{equation} {\textit{St}} = \frac{Nu}{{\textit{Re}}_{x}{\textit{Pr}}} = \frac{C_{f}/2}{a_{1}+a_{2}\left({\textit{Pr}}^{a_{3}}-1\right)\sqrt{C_{f}/2}}, \end{equation}
with the values of  $a_{1}=1, a_{2} = 12.8$ and
 $a_{3}=0.68$ provided in Lienhard & John (Reference Lienhard and John2005) and
 $C_f$ being expressed as
 \begin{equation} C_{f} = \frac{0.455}{\ln^2{\left(0.06{\textit{Re}}_{x}\right)}}. \end{equation}
The Stanton-number plot for the passive scalar at  ${\textit {Pr}} = 6$ agrees well with the turbulent solution obtained from the Reynolds–Colburn analogy, as shown in figure 3. On the other hand, reference curves for Kays & Crawford and the Reynolds–Colburn analogy are only reported for
 $\varTheta _{4}$ for clarity.
Variation of Stanton number along the streamwise direction for different passive scalars. (——, orange)  $\varTheta _{1}\,$, (——, green)
 $\varTheta _{2}$, (——, red)
 $\varTheta _{3}$, (——, blue)
 $\varTheta _{4}$, (
 $\cdots \cdots$, blue) Kays & Crawford (Reference Kays and Crawford1993) correlation corresponding to
 $\varTheta _4$ and (- - -, blue) Reynolds–Colburn analogy as given by Lienhard & John (Reference Lienhard and John2005) plotted for
 $\varTheta _{4}$, (—
 $\cdot$, blue) interpolation developed by Hollingsworth (Reference Hollingsworth1989) plotted for
 $\varTheta _{4}$.

Using the data for water with  ${\textit {Pr}} = 5.9$, Hollingsworth (Reference Hollingsworth1989) developed an interpolation for Prandtl numbers from 0.7 to 5.9 assuming the critical thickness of the sub-layer to be a simple function of Prandtl number. The empirical expression is given by
 \begin{equation} {\textit{St}} = 0.02426 {\textit{Pr}}^{{-}0.895} {\textit{Re}}_{x}^{{-}0.1879 {\textit{Pr}}^{{-}0.18}}, \end{equation}
which is plotted for the scalar at  ${\textit {Pr}} = 6$ in figure 3. We find that the relationship proposed by Hollingsworth (Reference Hollingsworth1989) underpredicts the Stanton number at
 ${\textit {Pr}} = 6$. However, the interpolation relation provides a good match with the calculated Stanton number for
 $\varTheta _{1}$, better than the Reynolds–Colburn analogy, which is not indicated in the plot for clarity.
Using the data obtained in the present simulation, a correlation between the Nusselt, Prandtl and Reynolds numbers can be obtained as
 \begin{equation} {\textit{Nu}}_{x} = 0.02 {\textit{Re}}_{x}^{0.828} {\textit{Pr}}^{0.514}, \end{equation}
which yields  $R^{2} = 0.9985$. This is similar to the correlation proposed by Kays & Crawford (Reference Kays and Crawford1993) but for fully developed profiles in circular tubes and computed for gases
 \begin{equation} {\textit{Nu}} = 0.021 Re^{0.8} {\textit{Pr}}^{0.5}. \end{equation}
3.2. Mean velocity and scalar profiles
The mean velocity profile obtained at the streamwise location corresponding to  ${\textit {Re}}_{\theta } = 670$ is shown in figure 4. The streamwise velocity profile is compared with the DNS data from Spalart (Reference Spalart1988) at
 ${\textit {Re}}_{\theta } = 670$ and Komminaho & Skote (Reference Komminaho and Skote2002) at
 ${\textit {Re}}_{\theta } = 666$. The comparison of the present data with the existing DNS results shows a good agreement in the inner region. There is a slight deviation of the mean velocity profile reported by Spalart (Reference Spalart1988) in the wake region with respect to the present data but it agrees well with the data provided by Komminaho & Skote (Reference Komminaho and Skote2002).
Inner-scaled mean streamwise velocity profile at  ${\textit {Re}}_{\theta } = 670$. (——, blue) Present DNS, (
 $\circ$, blue) Spalart (Reference Spalart1988), (
 $\square$, blue) Komminaho & Skote (Reference Komminaho and Skote2002) at
 ${\textit {Re}}_{\theta } = 666$.

The mean profiles of the various passive scalars  $\varTheta _{i}$ are normalized with the respective Prandtl numbers and represented in inner scaling by dividing with the friction scalar
 $\varTheta _{i,\tau }$ defined as
 \begin{equation} \varTheta_{i,\tau} = \frac{q_{i,w}}{\rho C_{p} u_{\tau}}, \end{equation}
where  $C_{p}$ is the heat capacity of the fluid and
 $q_{i,w}$ is the rate of heat transfer from the wall to the fluid and is defined by
 \begin{equation} q_{i,w} = \left.-k\frac{{\rm d}\left\langle \varTheta_{i}\right\rangle}{{\rm d} y}\right\rvert_{y=0}, \end{equation}
where  $k$ is the thermal conductivity of the fluid. The normalized inner-scaled mean scalar profiles are plotted at
 ${\textit {Re}}_{\theta } = 1070$, corresponding to
 ${\textit {Re}}_{\tau } = 395$, as shown in figure 5. The mean scalar profiles follow the conductive sub-layer relation (
 $\varTheta _{i}^+={\textit {Pr}} y^+$) and is clearly identified in the plots for
 $y^+ < 5$. The profiles of the passive scalars at
 ${\textit {Pr}}=1,2$ are compared against the channel DNS data provided by Kozuka et al. (Reference Kozuka, Seki and Kawamura2009) at the same Prandtl numbers. The comparison shows a good agreement in the near-wall and overlap regions. It should be noted that the boundary condition used by Kozuka et al. (Reference Kozuka, Seki and Kawamura2009) is the uniform-heat-flux condition as opposed to the uniform scalar boundary condition applied in this study. Note that the study by Kawamura, Abe & Shingai (Reference Kawamura, Abe and Shingai2000) showed that the Kármán constant
 $k_{\varTheta }$ as appearing in (3.11)
 \begin{equation} \frac{\left\langle \varTheta_{i}\right\rangle - \left\langle \varTheta_{i,w}\right\rangle}{\varTheta_{i,\tau}} = \frac{1}{k_{\varTheta}} \log y^+{+} A_{\varTheta_i}\left({\textit{Pr}}\right) , \end{equation}
varies between the Dirichlet and Neumann boundary conditions based on low-Reynolds-number simulations. Here,  $A_{\varTheta _i}$ denotes the additive constant for scalar
 $\varTheta _i$. However, based on higher-Reynolds-number simulations, Pirozzoli, Bernardini & Orlandi (Reference Pirozzoli, Bernardini and Orlandi2016) reported that the difference in boundary condition affects the mean passive scalar profiles only in small magnitudes in the logarithmic region, although the effect is evident in the scalar fluctuation profiles reported later.
Normalized mean profiles of the passive scalars at  ${\textit {Re}}_{\theta } = 1070$ corresponding to
 ${\textit {Re}}_{\tau } = 395$. (——, blue)
 ${\textit {Pr}}=1$, (——, orange)
 ${\textit {Pr}}=2$, (——, green)
 ${\textit {Pr}}=4$, (——, red)
 ${\textit {Pr}}=6$, channel DNS data by Kozuka et al. (Reference Kozuka, Seki and Kawamura2009) at
 ${\textit {Re}}_{\tau } = 395$ and (
 $\circ$, blue)
 ${\textit {Pr}}=1$, (
 $\circ$, orange)
 ${\textit {Pr}}=2$, (
 $\circ$, red)
 ${\textit {Pr}}=7$, (
 $\circ$, green) channel DNS data by Alcántara-Ávila, Hoyas & Pérez-Quiles (Reference Alcántara-Ávila, Hoyas and Pérez-Quiles2018) at
 ${\textit {Re}}_{\tau } = 500$ and
 ${\textit {Pr}} = 4$, with (- - -, grey) corresponding fit by Pirozzoli (Reference Pirozzoli2023) and (inset) (
 $\cdots \cdots$, black) conductive sub-layer relation,
 $\varTheta _{i}^+=Pr y^+$.

The scalar profile at  ${\textit {Pr}} = 4$ is compared against the channel DNS data reported by Alcántara-Ávila et al. (Reference Alcántara-Ávila, Hoyas and Pérez-Quiles2018). The channel DNS data reported by Kozuka et al. (Reference Kozuka, Seki and Kawamura2009) at
 ${\textit {Pr}} = 7$ are used for comparison of the passive scalar at
 ${\textit {Pr}} = 6$, since there are no simulations reported in the literature at exactly the same Prandtl number. This gives us the opportunity to highlight the difference between the profiles at these high Prandtl numbers. Due to the difference in the considered Prandtl numbers, we observe a discrepancy in the mean velocity profile for
 $y^+ > 40$ in the overlap region. Since the channel data are used for the comparison, there is a difference observed near the wake region for all the cases. However, a good agreement of the profiles is observed for the inner region. Based on experimental data, semi-empirical fits were provided by Kader (Reference Kader1981) for a boundary layer with constant heat flux. In this study it was assumed that the overlap layer exhibited logarithmic variation as given in (3.11), and an empirical relation was provided to determine the additive constant
 $B_{\varTheta _i}$. The comparison of the mean scalar profiles against the relationships provided by Kader (Reference Kader1981) shows that the value at the wake is slightly overestimated with respect to the DNS data. The deviation for scalar
 $\varTheta _4$ corresponding to
 ${\textit {Pr}} = 6$ is approximately 3 % for
 $y^+ \in [100,500]$. One possible reason for this small deviation could also be the constant scalar boundary condition imposed in our simulations as opposed to the constant-heat-flux boundary conditions considered by Kader (Reference Kader1981). The comparison against Kader (Reference Kader1981) is not presented, instead, the mean scalar profiles are evaluated against the recent correlations proposed by Pirozzoli (Reference Pirozzoli2023). These correlations were developed by fitting the functional form of eddy thermal diffusivity to DNS data, resulting in predictive formulae for mean scalar profiles. Our comparison demonstrates good agreement across the different Prandtl numbers. For the passive scalar
 $\varTheta _4$, the maximum observed deviation is approximately 2 %.
In the overlap region, the mean scalar profiles are nearly logarithmic and are characterized as
 \begin{equation} \left\langle \varTheta_i\right\rangle^+_{\infty} - \left\langle \varTheta_i\right\rangle^+{=} -\frac{1}{k_{\varTheta}} \log \left(y/\delta^*\right) + B_{\varTheta_i}\left({\textit{Pr}}\right). \end{equation}
The mean scalar and velocity profiles are plotted in defect form in figure 6. We observe that the slope of the scalar profiles in defect form is nearly parallel indicating a constant Kármán constant for the scalar fields. The Kármán constant for the velocity is observed to be  $0.41$, consistent with the values reported in Spalart (Reference Spalart1988). The diagnostic function for scalar is defined as
 \begin{equation} \varXi_\varTheta = y^+ \frac{\partial \left\langle \varTheta_i\right\rangle^+ }{\partial y^+} = \frac{1}{k_{\varTheta}}, \end{equation}
is plotted in figure 7. The Kármán constant for a scalar field is obtained as  $k_{\varTheta } = 0.4$, which is in between
 $k_{\varTheta } = 0.33$ (Wikström Reference Wikström1998) and
 $k_{\varTheta } = 0.47$ (Kader Reference Kader1981). The obtained
 $k_{\varTheta }$ from the present simulation is the same as observed by Kawamura, Abe & Matsuo (Reference Kawamura, Abe and Matsuo1999) and close to the value of
 $0.41$ as reported by Li et al. (Reference Li, Schlatter, Brandt and Henningson2009). In the outer region, we observe a collapse of the profiles.
Mean profiles in defect form at  ${\textit {Re}}_{\theta } = 1070$ corresponding to
 ${\textit {Re}}_{\tau } = 395$. (——, blue)
 ${\textit {Pr}}=1$, (——, orange)
 ${\textit {Pr}}=2$, (——, green)
 ${\textit {Pr}}=4$, (——, red)
 ${\textit {Pr}}=6$ and (- - -, black) velocity defect
 $\left \langle U_\infty \right \rangle ^+ - \left \langle U\right \rangle ^+$.

Variation of the diagnostic function for scalar  $\varXi _\varTheta$ along the wall-normal direction at
 ${\textit {Re}}_{\theta } = 1070$ corresponding to
 ${\textit {Re}}_{\tau } = 395$. (——, blue)
 ${\textit {Pr}}=1$, (——, orange)
 ${\textit {Pr}}=2$, (——, green)
 ${\textit {Pr}}=4$, (——, red)
 ${\textit {Pr}}=6$ and (—
 ${\cdot }$, black)
 $\varXi _\varTheta =0.25;\;k_\varTheta =0.4$.

3.3. Velocity and scalar fluctuations
As shown in figure 8, the present velocity-fluctuation root-mean-squared (r.m.s.) data show a trend similar to that of the results by Jiménez et al. (Reference Jiménez, Hoyas, Simens and Mizuno2010). The r.m.s. profiles of the three velocity components are in good agreement in the inner region, while a minor difference can be observed in the outer region. Nonetheless, the peaks of the velocity fluctuations match in both position and magnitude. There is a slight offset in the plots of  $p_{rms}$, which can be attributed to the small difference in the considered
 ${\textit {Re}}_{\theta }$ for comparison. The r.m.s. of the velocity components are also compared with the channel DNS data provided by Abe et al. (Reference Abe, Kawamura and Matsuo2004). The streamwise r.m.s. agrees well with the present DNS results and the near-wall peak value coincides with the present observations. As expected, there is a difference observed in the outer region of flow, since channel and boundary-layer flows are fundamentally different farther from the wall. Additionally, the r.m.s. of the pressure fluctuations observed in the boundary layer is different compared with the channel flow. From the present DNS data, the peak of the streamwise velocity fluctuation is found at
 $y^+ = 14$, corresponding in outer units to
 $y/\delta _{99} = 0.035$.
The r.m.s. velocity fluctuations and r.m.s. pressure fluctuation at  ${\textit {Re}}_{\theta } = 1070$. (——, blue) Present DNS, (
 $\circ$, blue) Jiménez et al. (Reference Jiménez, Hoyas, Simens and Mizuno2010) at
 ${\textit {Re}}_{\theta } = 1100$, (
 $\square$, blue) channel DNS data of Abe, Kawamura & Matsuo (Reference Abe, Kawamura and Matsuo2004) at
 ${\textit {Re}}_{\tau }=395$.

The r.m.s. of the scalars at different Prandtl numbers are plotted in figure 9. The scalar r.m.s. profile at  ${\textit {Pr}} = 1$ is similar to the streamwise velocity r.m.s. and has a higher (roughly 5 %) near-wall peak comparatively, as expected. The comparison of scalar-fluctuation profiles at
 ${\textit {Pr}} = 1,2$ with the channel DNS data from Kozuka et al. (Reference Kozuka, Seki and Kawamura2009) shows a good agreement in the inner and logarithmic region in addition to a good match of the peak value and wall-normal location. Despite the small difference in
 ${\textit {Re}}_{\tau }$, the profiles at
 ${\textit {Pr}} = 4$ obtained by Alcántara-Ávila et al. (Reference Alcántara-Ávila, Hoyas and Pérez-Quiles2018) show a reasonably good agreement with the present results. With increasing Prandtl number, the peak value of the scalar-fluctuation r.m.s. increases and is located closer to the wall. The scalar fluctuations decay to zero at the wall due to the isothermal boundary condition and they also decay to zero outside the boundary layer due to the absence of disturbances in the free stream.
Scalar fluctuation r.m.s. at  ${\textit {Re}}_{\theta } = 1070$. Present DNS data for (——, blue)
 ${\textit {Pr}} = 1$, (——, orange)
 ${\textit {Pr}} = 2$, (——, green)
 ${\textit {Pr}} = 4$, (——, red)
 ${\textit {Pr}} = 6$, channel DNS data by Kozuka et al. (Reference Kozuka, Seki and Kawamura2009) at
 ${\textit {Re}}_{\tau } = 395$ and (
 $\circ$, blue)
 ${\textit {Pr}}=1$, (
 $\circ$, orange)
 ${\textit {Pr}}=2$, (
 $\circ$, red)
 ${\textit {Pr}}=7$, (
 $\circ$, green) channel DNS data by Alcántara-Ávila et al. (Reference Alcántara-Ávila, Hoyas and Pérez-Quiles2018) at
 ${\textit {Re}}_{\tau } = 500$ and
 ${\textit {Pr}} = 4$.

The obtained scalar-fluctuation r.m.s. profiles are scaled with the respective Prandtl numbers and plotted in figure 10. We observe that the lines of  $\theta ^+_{i\,rms}$ for different scalars at different Reynolds numbers are parallel and not coinciding. Similar observations were also made by Alcántara-Ávila, Hoyas & Pérez-Quiles (Reference Alcántara-Ávila, Hoyas and Pérez-Quiles2021) for a particular scalar at
 ${\textit {Pr}} = 0.71$ and they attributed the differences in the viscous-diffusion term at the wall to the increase in the slope of
 $\theta ^+_{i\,rms}$. The slope of
 $\theta ^+_{i\,rms}$ changes with Reynolds number because the peak of
 $\theta ^+_{i\,rms}$ varies as shown in figure 11 and the location of such a peak moves farther from the wall as the Reynolds number increases. On the other hand, the location of
 $\theta ^+_{i\,rms, max}$ moves closer to the wall with respect to the Prandtl number, as discussed earlier. A correlation for
 $\theta _{i\,rms,\, max}^+$ was obtained as in Alcántara-Ávila et al. (Reference Alcántara-Ávila, Hoyas and Pérez-Quiles2021) for each passive scalar considered in the present study, as shown in figure 11. It should be noted that if the maximum value is obtained directly at the collocation point, some variations are observed along
 ${\textit {Re}}_{\tau }$ due to the grid resolution. In order to minimize the high-frequency variation along
 ${\textit {Re}}_{\tau }$, as plotted in figures 11 and 12, a simple convolution operation is performed which does not alter the obtained empirical fits. Clearly, for higher Prandtl numbers of
 $4,6$, the peak of the scalar-fluctuation r.m.s. tends to decrease with increasing
 ${\textit {Re}}_{\tau }$. When the present DNS data with
 ${\textit {Re}}_{\theta } \in [470,1070]$ and
 ${\textit {Pr}} = 1,2,4,6$ are used to find an overall variation of the peak in the scalar-fluctuation r.m.s. we find
 \begin{equation} \theta_{i\,rms, max}^+{=} 2.969 {\textit{Re}}_{\tau}^{{-}0.00858} {\textit{Pr}}^{0.571}, \end{equation}
with  $R^2 = 0.99$, where
 $R^2$ corresponds to the coefficient of determination. It is defined as
 $R^2 = 1-({\varSigma (x_t - x_p)^2})/({x_{t\, {rms}}^2})$, with
 $x_p$ corresponding to the fitted value of
 $x_t$. The observed correlation shows a weak dependence on
 ${\textit {Re}}$ compared with
 ${\textit {Pr}}$. Further, from (3.14), a decaying trend of
 $\theta _{i\, rms, max}^+$ with
 ${\textit {Re}}$ is obtained, although such a trend has not been observed in the literature except for
 $\varTheta _3, \varTheta _4$ in the present study. The studies by Pirozzoli et al. (Reference Pirozzoli, Bernardini and Orlandi2016) and Alcántara-Ávila et al. (Reference Alcántara-Ávila, Hoyas and Pérez-Quiles2021) have reported the increasing trend of
 $\theta _{i\,rms,max}^+$ with respect to
 ${\textit {Re}}$ but for a lower
 ${\textit {Pr}}$ than in the present work. Pirozzoli et al. (Reference Pirozzoli, Bernardini and Orlandi2016) have suggested that the attached-eddy arguments support the increase of inner peak of streamwise velocity r.m.s. with respect to
 ${\textit {Re}}_\tau$ due to the effect of overlying attached eddies and they assumed that the same argument applies to the passive scalars. On the other hand, we find that the inner peak of the passive scalar r.m.s. at high
 ${\textit {Pr}}$ does not follow the previous argumentation. It should also be noted that the range of
 ${\textit {Re}}_\tau$ in our present simulation is narrow compared with those of the works by Pirozzoli et al. (Reference Pirozzoli, Bernardini and Orlandi2016) and Alcántara-Ávila et al. (Reference Alcántara-Ávila, Hoyas and Pérez-Quiles2021) and a more detailed investigation of this topic is necessary to make any conclusive statements.
Scalar fluctuations scaled by Prandtl number at (——, blue)  ${\textit {Pr}} = 1$, (——, orange)
 ${\textit {Pr}} = 2$, (——, green)
 ${\textit {Pr}} = 4$, (——, red)
 ${\textit {Pr}} = 6$ and (——, black)
 ${\textit {Re}}_{\theta } = 420$, (- - -, black)
 ${\textit {Re}}_{\theta } = 628$, (—
 ${\cdot }$, black)
 ${\textit {Re}}_{\theta } = 830$, (
 $\cdots \cdots$, black)
 ${\textit {Re}}_{\theta } = 1070$ at the corresponding Prandtl numbers.

Variation of the peak of scalar fluctuation r.m.s. with respect to  ${\textit {Re}}_{\tau }$, for (——, blue)
 ${\textit {Pr}} = 1$, (——, orange)
 ${\textit {Pr}} = 2$, (——, green)
 ${\textit {Pr}} = 4$, (——, red)
 ${\textit {Pr}} = 6$ including the corresponding empirical fits (
 $\cdots \cdots$, blue)
 $0.116 \log {({\textit {Re}}_{\tau })} + 2.210$ with
 $R^{2} = 0.976$, (
 $\cdots \cdots$, orange)
 $0.037 \log {({\textit {Re}}_{\tau })} + 3.963$ with
 $R^{2} = 0.620$, (
 $\cdots \cdots$, green)
 $-0.068 \log {({\textit {Re}}_{\tau })} + 6.583$ with
 $R^{2} = 0.726$, (
 $\cdots \cdots$, red)
 $-0.151 \log {({\textit {Re}}_{\tau })} + 8.753$ with
 $R^{2} = 0.894$.

Variation of the peak of streamwise heat flux with respect to  ${\textit {Re}}_{\tau }$, for (——, blue)
 ${\textit {Pr}} = 1$, (——, orange)
 ${\textit {Pr}} = 2$, (——, green)
 ${\textit {Pr}} = 4$, (——, red)
 ${\textit {Pr}} = 6$ including the corresponding empirical fits (
 $\cdots \cdots$, blue)
 $0.250 \log {({\textit {Re}}_{\tau })} + 5.732$ with
 $R^{2} = 0.808$, (
 $\cdots \cdots$, orange)
 $0.064 \log {({\textit {Re}}_{\tau })} + 9.769$ with
 $R^{2} = 0.119$, (
 $\cdots \cdots$, green)
 $-0.1626 \log {({\textit {Re}}_{\tau })} + 14.223$ with
 $R^{2} = 0.328$, (
 $\cdots \cdots$, red)
 $-0.293 \log {({\textit {Re}}_{\tau })} + 16.773$ with
 $R^{2} = 0.513$.

The above procedure was also performed for the streamwise heat flux, as shown in figure 12. A similar behaviour was observed with the overall variation in streamwise heat flux given by
 \begin{equation} \left\langle u\theta_i\right\rangle^+_{max} = 7.74 {\textit{Re}}_{\tau}^{{-}0.006} {\textit{Pr}}^{0.401}, \end{equation}
with  $R^{2} = 0.9913$.
3.4. Turbulent Prandtl number
An important parameter for scalar transport is the turbulent Prandtl number  ${\textit {Pr}}_{t}$, which is defined as the ratio between turbulent eddy viscosity and turbulent eddy diffusivity
 \begin{equation} {\textit{Pr}}_{t} = \frac{\nu_{t}}{\alpha_{t}}. \end{equation}
The eddy viscosity and the eddy diffusivity arise from the Boussinesq hypothesis (Boussinesq Reference Boussinesq1877) for modelling turbulent stresses and the heat-flux vector, respectively. For parallel flows (the ones in which the velocity profile does not vary in the streamwise direction), the turbulent eddy viscosity and the turbulent eddy diffusivity are used to describe the turbulent momentum transfer and heat transfer with respect to the mean-flow conditions, in particular the mean velocity strain and temperature gradients, respectively. They are defined as
 \begin{equation} \nu_{t} ={-}\frac{\left\langle uv\right\rangle}{{\partial \left\langle U\right\rangle}/{\partial y}}, \end{equation}
and
 \begin{equation} \alpha_{t} ={-}\frac{\left\langle v\theta_i\right\rangle}{{\partial \left\langle \varTheta_i\right\rangle}/{\partial y}}. \end{equation}
It should be noted that the eddy viscosity or diffusivity does not represent a physical property of the fluid, like the molecular viscosity, but rather a property of the flow. The Reynolds analogy introduces the similarity between the turbulent momentum exchange and turbulent heat transfer in a fluid. Reynolds (Reference Reynolds1874) noted that, for a fully turbulent field, both the momentum and heat are transferred due to the motion of turbulent eddies. This yields a simpler model for the turbulent Prandtl number, where the turbulent eddy viscosity for the momentum exchange and turbulent eddy diffusivity for the scalar transport are equal, such that  ${\textit {Pr}}_{t} = 1$.
Substitution of the eddy viscosity and diffusivity into the definition of turbulent Prandtl number results in
 \begin{equation} {\textit{Pr}}_{t} = \frac{\left\langle uv\right\rangle}{\left\langle v\theta_i\right\rangle}\frac{{\partial \left\langle \varTheta_i\right\rangle}/{\partial y}}{{\partial \left\langle U\right\rangle}/{\partial y}}. \end{equation}
From this definition, evaluating the turbulent Prandtl number at any point in the boundary layer would require the turbulent shear stress, turbulent heat transfer, velocity gradient and temperature gradient. Experimental investigations have limited accuracy in the simultaneous measurement of the Reynolds shear stress and wall-normal turbulent heat flux, in particular close to the wall (Araya & Castillo Reference Araya and Castillo2012). For this reason, experimental investigations like Blom (Reference Blom1970), Antonia (Reference Antonia1980) and Kays & Crawford (Reference Kays and Crawford1993) exhibit significant scatter in the data.
The variation of turbulent Prandtl number with the wall-normal distance in inner units at a given  ${\textit {Re}}_{\theta } = 1070$ is reported in figure 13. We observe that the turbulent Prandtl number varies at the wall and increases with respect to molecular Prandtl number of the scalar. From figure 14, we also see the turbulent Prandtl number decays for
 $y^+ > 15$ and this decay becomes steeper as
 ${\textit {Re}}$ decreases. The turbulent Prandtl number was assumed to approach a constant value close to the wall independent of the molecular Prandtl number (Li Reference Li2007). Studies such as the ones by Kestin & Richardson (Reference Kestin and Richardson1963) and Blom (Reference Blom1970) have analysed experimentally the turbulent Prandtl number in order to assess the validity of this assumption. Such experimental investigations have reported a constant value of turbulent Prandtl number as the wall is approached. However, different experimental campaigns provided data that could not show a conclusive interpretation of the behaviour of turbulent Prandtl number close to the wall. Nonetheless, many authors have proposed different correlations based on the experimental data to predict the heat-transfer coefficient through the prediction of turbulent Prandtl number with respect to molecular Prandtl number.
Variation of turbulent Prandtl number with respect to wall-normal distance in inner scale at  ${\textit {Re}}_{\theta } = 1070$ for passive scalar at (——, blue)
 ${\textit {Pr}} = 1$, (——, orange)
 ${\textit {Pr}} = 2$, (——, green)
 ${\textit {Pr}} = 4$, (——, red)
 ${\textit {Pr}} = 6$.

Variation of turbulent Prandtl number with respect to wall-normal distance in inner scale at (——, blue)  ${\textit {Re}}_{\theta } = 396$, (——, orange)
 ${\textit {Re}}_{\theta }=420$, (——, green)
 ${\textit {Re}}_{\theta }=628$, (——, red)
 ${\textit {Re}}_{\theta }=830$, (——, purple)
 ${\textit {Re}}_{\theta }=1070$ for a passive scalar at
 ${\textit {Pr}} = 1$.

For the different passive scalars considered in the present study, the turbulent Prandtl number approaches a constant value  $>1$ close to the wall in the viscous sub-layer. The plots of
 ${\textit {Pr}}_{t}$ exhibit a significant difference closer to the wall with respect to various molecular Prandtl numbers. There is a slight decrease in
 ${\textit {Pr}}_{t}$ up to
 $y^+ \approx 20$ and then the increase is maintained farther from the wall up to
 $y^+ \approx 50$, the point after which the trend steadily decreases. It is pointed out in Kays (Reference Kays1994) that the peak between
 $y^+ \approx 20$ and
 $100$ is not observed in the experimental data, an observation which was attributed to the high Reynolds number of the experiments, where DNS data are not available for comparison.
Following the discussions about a constant  ${\textit {Pr}}_{t}$ in the logarithmic region, Kays & Crawford (Reference Kays and Crawford1993) proposed a correlation for the turbulent Prandtl number that is applicable to air. In this correlation, the value of
 ${\textit {Pr}}_{t}$ approaches a constant value of 0.85 in the logarithmic region. In the studies by Hollingsworth (Reference Hollingsworth1989), a correlation was proposed based on the measurement of the temperature profile of water at
 ${\textit {Pr}} \approx 6$. Again, the value of
 ${\textit {Pr}}_{t}$ approaches a value of 0.85 as
 $y^+$ is increased. This observation of constant
 ${\textit {Pr}}_{t}$ in the logarithmic region is not clearly observed with the present DNS data. This can be due to the low-Reynolds-number range considered in the present study. Based on the correlation proposed by Hollingsworth (Reference Hollingsworth1989), Kays (Reference Kays1994) suggested a constant value of
 ${\textit {Pr}}_{t} = 1.07$ for
 $0< y^+<5$. Indeed, if we consider only the passive scalars at
 ${\textit {Pr}} = 1,2$, the turbulent Prandtl number approaches a constant value of 1.07 closer to the wall. It appears that the turbulent Prandtl number close to the wall is independent of the molecular Prandtl number, as shown in the studies by Li et al. (Reference Li, Schlatter, Brandt and Henningson2009). This independence of the turbulent Prandtl number at the wall with respect to the molecular Prandtl number has also been reported in many other studies like Kong et al. (Reference Kong, Choi and Lee2000) and Jacobs & Durbin (Reference Jacobs and Durbin2000) for TBL flow, as well as in Kim & Moin (Reference Kim and Moin1989) and Kasagi, Tomita & Kuroda (Reference Kasagi, Tomita and Kuroda1992) for turbulent channel flow. However, from the present study, we find that the turbulent Prandtl number indeed depends on the molecular Prandtl number and this observation is based on the increasing value of
 ${\textit {Pr}}_t$ at the wall with respect to the scalars with
 ${\textit {Pr}}=4,6$, as shown in figure 13.
In order to verify the plausibility of the present observations at  ${\textit {Pr}} = 4,6$, the obtained DNS data were compared with the DNS channel data reported by Alcántara-Ávila & Hoyas (Reference Alcántara-Ávila and Hoyas2021). Figure 15 shows the comparison of
 ${\textit {Pr}}_{t}$ at different molecular Prandtl numbers, where the present DNS data were at
 ${\textit {Re}}_{\theta } = 1070$, corresponding to
 ${\textit {Re}}_{\tau } = 395$, and the data from Alcántara-Ávila & Hoyas (Reference Alcántara-Ávila and Hoyas2021) were at
 ${\textit {Re}}_{\tau } = 500$. Despite these differences, the turbulent Prandtl numbers close to the wall are in good agreement, confirming that the
 ${\textit {Pr}}$-scaled wall-normal heat flux decreases with an increase in
 ${\textit {Pr}}$ for
 ${\textit {Pr}} \gtrapprox 4$, as stated by Alcántara-Ávila & Hoyas (Reference Alcántara-Ávila and Hoyas2021). Thus, the present observation confirms the constant behaviour of the turbulent Prandtl number very close to the wall and highlights its dependence on the molecular Prandtl number, which has been often ignored in turbulent heat-transfer calculations.
Comparison of turbulent Prandtl number against the channel DNS data at  ${\textit {Re}}_\theta = 1070$ for different molecular Prandtl numbers. Present DNS for (——, blue)
 ${\textit {Pr}} = 1$, (——, orange)
 ${\textit {Pr}} = 2$, (——, green)
 ${\textit {Pr}} = 4$, (——, red)
 ${\textit {Pr}} = 6$, channel DNS data by Alcántara-Ávila & Hoyas (Reference Alcántara-Ávila and Hoyas2021) at
 ${\textit {Re}}_{\tau } = 497$ and (
 $\circ$, blue)
 ${\textit {Pr}} = 1$, (
 $\circ$, orange)
 ${\textit {Pr}} = 2$, (
 $\circ$, green)
 ${\textit {Pr}} = 4$, (
 $\circ$, red)
 ${\textit {Pr}} = 6$.

A brief discussion of the Reynolds-stress budget is provided in Appendix A.
3.5. Higher-order statistics, shear stress and heat flux
The higher-order statistics (specifically, the values of the third- and fourth-order moments of a quantity) provide information on the non-Gaussian behaviour of turbulence. The third- and fourth-order moments are also called the skewness and flatness, respectively, and for a statistically stationary variable  $m$, they are defined as
 \begin{gather} \mathcal{S}(m) = \left.\left\langle m^3\right\rangle\right/\left\langle m^2\right\rangle^{3/2}, \end{gather}
 \begin{gather}\mathcal{F}(m) = \left.\left\langle m^4\right\rangle\right/\left\langle m^2\right\rangle^{2}. \end{gather}
The skewness and flatness of the streamwise and wall-normal velocity components are shown in figure 16 where, for the spanwise velocity, we observe a Gaussian behaviour in the overlap region, as expected. The higher-order moments obtained by Vreman & Kuerten (Reference Vreman and Kuerten2014) for the turbulent channel flow are compared with the present TBL results at  ${\textit {Re}}_{\tau } = 180$ (corresponding to
 ${\textit {Re}}_\theta = 420$), showing a reasonable agreement. From figure 2, it should be highlighted that
 ${\textit {Re}}_\theta = 420$ is roughly at the beginning of the turbulent regime and the deviation of the profiles for
 $y^+>100$ as observed in figure 16 is due to the intermittent wake region which decays to the values for a Gaussian distribution as the free stream is approached. There are some differences observed in the overlap region where the skewness of
 $u$ is roughly
 $10\,\%$ higher than that reported by Vreman & Kuerten (Reference Vreman and Kuerten2014). Although the plots indicate an overall good agreement, some drastic differences are observed in the flatness of the wall-normal and spanwise velocity components close to the wall, where the turbulence is highly intermittent. The flatness of the wall-normal velocity component approaches a value of
 $\approx 29$ close to the wall for the data provided by Vreman & Kuerten (Reference Vreman and Kuerten2014) whereas, in the TBL, it converges to
 $\approx 20$. This is still lower than the value of
 $22$ obtained by Kim, Moin & Moser (Reference Kim, Moin and Moser1987). The skewness of the pressure fluctuations is roughly 20 % higher in the overlap region of the TBL compared with the channel. Further, the intermittency (flatness) of the pressure is higher than the velocity components as reported by Kim et al. (Reference Kim, Moin and Moser1987), whereas the data obtained with TBL show an offset of 15 % throughout and are lower than the flatness behaviour observed in the channel. The flatness factor for pressure fluctuation at the wall approaches a value of 4.5 in the present simulations as compared with the values of 4.7 (Li et al. Reference Li, Schlatter, Brandt and Henningson2009) and 4.9 (Schewe Reference Schewe1983), whereas a value of
 $\approx$5.2 is reported by Vreman & Kuerten (Reference Vreman and Kuerten2014).
Skewness and flatness for the streamwise, wall-normal and spanwise velocity components at  ${\textit {Re}}_{\theta } = 420$ corresponding to
 ${\textit {Re}}_{\tau } = 180$. (——, blue) Present DNS, (
 $\circ$, blue) channel DNS data by Vreman & Kuerten (Reference Vreman and Kuerten2014) at
 ${\textit {Re}}_{\tau } = 180$.

The Reynolds shear stress is plotted in figure 17 and it is compared with the TBL data provided by Jiménez et al. (Reference Jiménez, Hoyas, Simens and Mizuno2010) and the channel DNS data by Kozuka et al. (Reference Kozuka, Seki and Kawamura2009). Even if there is a good agreement between the data in the inner region, there is a clear difference in the overlap region between the channel and the TBL. Such differences were also observed in the plots of the fluctuations in the streamwise and wall-normal directions shown in figure 8. The peak of the Reynolds shear stress is higher for the TBL compared with a channel flow, which indicates a higher momentum transfer by the fluctuating velocity field in the TBL. Looking at the energy budgets for shear stress component in both the channel and TBL corresponding to  ${\textit {Re}}_\tau = 395$ (plots not shown here), we find that there is higher production in the TBL compared with channel flows (with uniform-heat-flux wall conditions) in the overlap region whereas the dissipation was of similar magnitude.
Inner-scaled Reynolds shear stress as a function of the wall-normal direction at  ${\textit {Re}}_{\theta }=1070$. (——, blue) Present DNS, (
 $\circ$, blue) Jiménez et al. (Reference Jiménez, Hoyas, Simens and Mizuno2010) at
 ${\textit {Re}}_{\theta } = 1100$, (
 $\square$, blue) channel DNS data by Kozuka et al. (Reference Kozuka, Seki and Kawamura2009) at
 ${\textit {Re}}_{\tau } = 395$.

The turbulent streamwise heat flux shows a reasonable agreement with the channel data available at  ${\textit {Pr}} = 1, 2$, as shown in figure 18, although the peaks for the channel-flow data are slightly higher and closer to the wall compared with the present observations. For
 ${\textit {Pr}} = 4$, however, the peak of the streamwise heat flux is higher in the channel data by Alcántara-Ávila et al. (Reference Alcántara-Ávila, Hoyas and Pérez-Quiles2018), since the heat flux is reported at a higher Reynolds number than our DNS. Furthermore, the comparison at the highest
 ${\textit {Pr}}$ in our simulation was at a slightly lower
 ${\textit {Pr}}$ than that in the channel and hence there is a difference in the slope of the streamwise heat flux close to the wall. Figure 19 shows the wall-normal heat flux for the different simulations. A clear difference can be observed in the outer region when comparing similar Prandtl numbers. On the other hand, the boundary-layer data and the channel data show a better agreement in the inner region.
Variation of streamwise heat flux along the wall-normal direction at  ${\textit {Re}}_\theta = 1070$ for different passive scalars. Present DNS data for (——, blue)
 ${\textit {Pr}} = 1$, (——, orange)
 ${\textit {Pr}} = 2$, (——, green)
 ${\textit {Pr}} = 4$, (——, red)
 ${\textit {Pr}} = 6$, channel DNS data by Kozuka et al. (Reference Kozuka, Seki and Kawamura2009) at
 ${\textit {Re}}_{\tau } = 395$ and (
 $\circ$, blue)
 ${\textit {Pr}}=1$, (
 $\circ$, orange)
 ${\textit {Pr}}=2$, (
 $\circ$, red)
 ${\textit {Pr}}=7$, (
 $\circ$, green) channel DNS data by Alcántara-Ávila et al. (Reference Alcántara-Ávila, Hoyas and Pérez-Quiles2018) at
 ${\textit {Re}}_{\tau } = 500$ and
 ${\textit {Pr}} = 4$.

Variation of wall-normal heat flux along the wall-normal direction at  ${\textit {Re}}_\theta = 1070$ for different passive scalars. Present DNS data for (——, blue)
 ${\textit {Pr}} = 1$, (——, orange)
 ${\textit {Pr}} = 2$, (——, green)
 ${\textit {Pr}} = 4$, (——, red)
 ${\textit {Pr}} = 6$, channel DNS data by Kozuka et al. (Reference Kozuka, Seki and Kawamura2009) at
 ${\textit {Re}}_{\tau } = 395$ and (
 $\circ$, blue)
 ${\textit {Pr}}=1$, (
 $\circ$, orange)
 ${\textit {Pr}}=2$, (
 $\circ$, red)
 ${\textit {Pr}}=7$, (
 $\circ$, green) channel DNS data by Alcántara-Ávila et al. (Reference Alcántara-Ávila, Hoyas and Pérez-Quiles2018) at
 ${\textit {Re}}_{\tau } = 500$ and
 ${\textit {Pr}} = 4$.

The correlation coefficients provide more information on the statistical association between the fields, and here the structure of the flow field and scalar fluctuations are analysed in terms of
 \begin{equation} \left. \begin{aligned} R_{u\theta_i} & = \frac{\left\langle u \theta_i\right\rangle}{u_{rms}\theta_{i\,{rms}}},\\ R_{v\theta_i} & = \frac{\left\langle v \theta_i\right\rangle}{v_{rms}\theta_{i\,{rms}}}. \end{aligned} \right\} \end{equation}
The correlation-coefficient plot in figure 20 corresponding to  $u-\theta _i$ shows a strong correlation of streamwise velocity and scalar fluctuations at
 ${\textit {Pr}} = 1$ and it decreases with increase in Prandtl number. This is related to the similarity in the momentum and passive scalar transport by the turbulent eddies close to the wall. On the other hand, the
 $v-\theta _i$ correlation coefficient also shown in figure 20 exhibits an increasing trend with the Prandtl number. In the conductive sub-layer the correlation coefficients coincide for the various Prandtl numbers under study and then approach different values at the wall. This highlights a similar behaviour of the turbulent wall-normal momentum and passive scalar fields with a caveat, i.e. the differences are present very close to the wall for different Prandtl numbers.
Correlation coefficients: (a)  $u-\theta _i$, (b)
 $v-\theta _i$. Present DNS data for scalars at (——, blue)
 ${\textit {Pr}} = 1$, (——, orange)
 ${\textit {Pr}} = 2$, (——, green)
 ${\textit {Pr}} = 4$, (——, red)
 ${\textit {Pr}} = 6$ at
 ${\textit {Re}}_\theta = 1070$.

3.6. Spanwise two-point correlations
The two-point correlations provide some quantitative information on the turbulent structures near the wall. For example, the streak spacing near the wall is of interest and can also be observed in an experimental setting. In order to identify the mean streak spacing, spanwise two-point correlations of the velocity components and passive scalars were obtained at five different positions along the streamwise direction at different wall-normal positions. Overall, the obtained results at  ${\textit {Re}}_\theta = 830$ were compared with the data reported by Kim et al. (Reference Kim, Moin and Moser1987) and show good agreement (not depicted here). The obtained two-point correlations for different scalars at
 ${\textit {Re}}_\theta = 830$ are shown in figure 21 to assess the differences for varying
 ${\textit {Pr}}$. The two-point correlation becomes negative and reaches a minimum at an inner-scaled correlation length of
 $\delta z^+ \approx 50$. The length at which the minimum occurs provides an estimate of the half-mean separation between the streaks in the spanwise direction, i.e.
 $(\lambda _s^+/2)$. The streak spacing is plotted along the streamwise direction at a wall-normal position of
 $y^+ \approx 7$, as shown in figure 21. Overall, the velocity and scalar streak spacings increase with
 ${\textit {Re}}_\theta$, as reported in the works of Li et al. (Reference Li, Schlatter, Brandt and Henningson2009) and Schlatter et al. (Reference Schlatter, Örlü, Li, Brethouwer, Fransson, Johansson, Alfredsson and Henningson2009). Note that the correlations are available only at five streamwise locations (solid line for
 $U$ in figure 21 is for clarity), but the comparison with Li et al. (Reference Li, Schlatter, Brandt and Henningson2009) is in reasonably good agreement for the velocity and scalar streaks at
 ${\textit {Pr}} = 2$. The velocity streak spacing increases from 102 to 115 and appears to saturate for
 ${\textit {Re}}_\theta > 830$. Note that such a saturation of streak spacing was also pointed out by Li et al. (Reference Li, Schlatter, Brandt and Henningson2009) for
 ${\textit {Re}}_\theta > 1500$. From figure 21, we also observe that the streak spacing decreases with increasing
 ${\textit {Pr}}$ and that the streak spacings for the scalars at
 ${\textit {Pr}} = 4, 6$ are indistinguishable, although the rate of decay of the two-point correlations for the scalars is different. A higher grid resolution might be necessary to quantify the possible differences in the scalar streak spacing at higher
 ${\textit {Pr}}$.
Variation of mean spanwise streak spacing along the streamwise direction at  $y^+ \approx 7$. (——, blue)
 $U$, (
 $\circ$, blue)
 $\varTheta _1$, (
 $\circ$, orange)
 $\varTheta _2$, (
 $\circ$, green)
 $\varTheta _3$, (
 $\circ$, red)
 $\varTheta _4$. Comparison data from Li et al. (Reference Li, Schlatter, Brandt and Henningson2009) for (
 $\times$, black)
 $U$, (
 $\square$, black)
 $\varTheta _2$. Inset: spanwise two-point correlation for (——, blue)
 $\varTheta _1$, (——, orange)
 $\varTheta _2$, (——, green)
 $\varTheta _3$, (——, red)
 $\varTheta _4$ at
 ${\textit {Re}}_\theta \approx 830$.

3.7. Scaling of wall-heat-flux fields
The wall-shear and heat-flux fields at different Prandtl numbers are normalized by subtracting the mean and dividing by the corresponding r.m.s. quantities.The normalization of a quantity  $n$ is calculated as
 \begin{equation} \bar{n} = \frac{n-\left\langle n\right\rangle}{n_{rms}}. \end{equation}
For the results discussed,  $n$ could indicate streamwise wall-shear stress, streamwise scalar flux, streamwise velocity or scalar concentrations at different Prandtl numbers. Figure 22 shows the instantaneous normalized streamwise wall-shear and heat-flux fields at different Prandtl numbers. The instantaneous normalized streamwise velocity and scalar fields are shown at
 $y^+=15$ (corresponding to
 $x/\delta _0^* = 500$) in figure 23. The normalized wall fields appear qualitatively similar and this result is confirmed by the distribution of the data in the streamwise shear and heat-flux fields obtained from 3700 samples, shown in figure 24. Although the distribution of data is different in the various fields, after normalization the distributions become identical. This indicates the uniformity in the distribution of the fluctuations of shear and heat flux when scaled with the corresponding r.m.s. quantities. This observation is useful for certain applications, for instance, in the prediction of fluctuating flow quantities from the wall, as discussed in the study by Guastoni et al. (Reference Guastoni, Balasubramanian, Güemes, Ianiro, Discetti, Schlatter, Azizpour and Vinuesa2022).
Instantaneous normalized streamwise wall-shear and heat-flux fields at different Prandtl numbers.

Instantaneous normalized streamwise velocity and passive scalar fields for different Prandtl numbers corresponding to  $y^+ = 15$ at
 $x/\delta _0^* = 500$.

Probability density function of wall-shear and heat-flux fields at different Prandtl numbers. (a) Distribution of absolute data in the fields with a bin size of 1 unit, (b) distribution of the normalized data in the fields with a bin size of 0.1 unit, (——, blue)  ${\partial U}/{\partial y}$ or
 $\overline {{\partial U}/{\partial y}}$, (——, orange)
 ${\partial \varTheta _{1}}/{\partial y}$ or
 $\overline {{\partial \varTheta _{1}}/{\partial y}}$, (——, green)
 ${{\partial \varTheta _{2}}/{\partial y}}$ or
 $\overline {{\partial \varTheta _{2}}/{\partial y}}$, (——, red)
 ${{\partial \varTheta _{3}}/{\partial y}}$ or
 $\overline {{\partial \varTheta _{3}}/{\partial y}}$, (——, purple)
 ${{\partial \varTheta _{4}}/{\partial y}}$ or
 $\overline {{\partial \varTheta _{4}}/{\partial y}}$.

4. Spectral analysis
The analysis of thermal boundary-layer statistics reveals that the scalar fluctuations and heat flux are strongly affected by the Prandtl number of the scalar in the flow and the corresponding scalings were reported in § 3. Additional insight can be obtained by analysing the energy distribution at the different length scales for the scalars at the simulated Prandtl numbers. In this regard, time series of the wall-shear, wall heat flux, streamwise velocity and different scalars were sampled at different wall-normal locations with a sampling time ( ${\sim }\Delta t^+_s = 1$ with the reference friction velocity at
 $x/\delta _0^* = 500$) corresponding to 12 000 time units
 $({\delta _{0}^{*}}/{U_{\infty }})$. The two-dimensional (2-D) premultiplied power-spectral density (PSD)
 $k_z k_t \phi (\lambda _z^+,\lambda _t^+)$ is obtained in the spanwise direction and in time based on the time series, for a total sampled time of about 11.5 flow-through times. Note that, here,
 $\boldsymbol {k_z, k_t}$ denote the spanwise, temporal wavenumber, respectively, and
 $\phi$ is the PSD defined for the particular quantity under study.
For the calculation of PSD, the procedure outlined in Pozuelo et al. (Reference Pozuelo, Li, Schlatter and Vinuesa2022) is utilized. After the mean subtraction of the sampled time series to obtain the turbulent quantities, first a 1-D spectrum  $E[t,x](\lambda _z^+)$ is obtained by performing a fast Fourier transform (FFT) in the spanwise direction, due to the periodicity condition imposed along
 $z$. As a result, a spectral decomposition of the energy content into different wavenumbers
 $k_z$ is obtained with the corresponding wavelengths
 $\lambda _z$ given by
 $2{\rm \pi} /k_z$. Note that the local friction velocity is used to obtain the inner-scaled quantities. It should be pointed out that the flow is developing along the streamwise direction and hence the FFT along the streamwise direction is not applicable. In the present spectral analysis, we consider the
 ${\textit {Re}}_{\theta }$ range between 470 and 1070 and use Welch's overlapping-window method to address the non-periodicity in the temporal signal. As a next step, the spectrum in time is obtained using Welch's method with 15 bins in total, where 8 of them are independent. A Hamming window is used for imposing the periodicity in the bins, and the 2-D spectrum is obtained as
 $E[x](\lambda _z^+,\lambda _t^+)$ by using FFT along
 $z$ and Welch's method in
 $t$, with
 $\lambda _t$ denoting the temporal wavelength (i.e. the period), which is defined as
 $\lambda _t =2{\rm \pi} /k_t$. The obtained spectrum is divided by
 $\Delta k_t \Delta k_z$ and premultiplied with
 $k_t k_z$. Finally, an averaging along
 $x$ is performed to yield the 2-D premultiplied PSD
 $k_t k_z \phi (\lambda _z^+,\lambda _t^+)$.
The 2-D PSDs of the streamwise wall shear and wall heat flux at different Prandtl numbers are provided in figure 25, along with the PSD of the streamwise velocity and scalar fluctuations at  $y^+ = 15$. The obtained 2-D PSD at
 $y^+=15$ agrees well with the results reported by Pozuelo et al. (Reference Pozuelo, Li, Schlatter and Vinuesa2022), although the latter are at higher Reynolds number. At the wall, the spectral peak is observed at
 $\lambda _z^+ \approx 100$ and
 $\lambda _t^+ \approx 100$. Furthermore, at
 $y^+ = 15$, we observe that the maximum of spectral-energy distribution is at
 $\lambda _z^+ \approx 120$, which corresponds to the characteristic streak spacing in wall turbulence (Smith & Metzler Reference Smith and Metzler1983). It is observed that the PSD for the streamwise wall-shear stress is very similar to that for the wall heat flux at
 ${\textit {Pr}}=1$, which is an expected result for the reasons outlined in § 3.1. However, with increasing
 ${\textit {Pr}}$, the PSD shifts to the right, indicating that the energy is not spread over a wider range of scales, and instead is concentrated in longer temporal structures. One could argue that, with a shorter boundary layer, the structures at
 ${\textit {Pr}}=6$ can become larger than the ones developing at
 ${\textit {Pr}}=1$. Because of this, the larger structures have a different footprint at the wall. Additionally, the plots in figure 25 also exhibit a slight trend downwards for higher
 ${\textit {Pr}}$, a fact that indicates the presence of smaller spanwise scales, in agreement with the discussion in § 3.6. Overall, the temporal wavelength range at which we have the most energetic structures in the wall-heat-flux fields increases for larger Prandtl numbers. From the above observations, considering the dominant energetic structures to be composed of streaks at the wall, the scalar at
 ${\textit {Pr}}=6$ (in general for higher
 ${\textit {Pr}}$) might exhibit longer and thinner scalar streak structures at the wall compared with the case at
 ${\textit {Pr}} = 1$.
Two-dimensional premultiplied PSD of (a) streamwise wall-shear and wall-heat-flux fields and (b) streamwise velocity and scalar at  $y^+ = 15$, for the ZPG thermal TBL with
 ${\textit {Re}}_\theta$ ranging from 467 to 1072. The three contour lines correspond to 10 %, 50 % and 90 % of the maximum energy density. We show:
 $k_t k_z \phi _{u_y u_y}$ or
 $k_t k_z \phi _{u u}$ (shaded contours), (——, blue)
 $k_t k_z \phi _{{\varTheta _1}_y {\varTheta _1}_y}$ or
 $k_t k_z \phi _{{\varTheta _1} {\varTheta _1}}$, (——, orange)
 $k_t k_z \phi _{{\varTheta _2}_y {\varTheta _2}_y}$ or
 $k_t k_z \phi _{{\varTheta _2} {\varTheta _2}}$, (——, green)
 $k_t k_z \phi _{{\varTheta _3}_y {\varTheta _3}_y}$ or
 $k_t k_z \phi _{{\varTheta _3} {\varTheta _3}}$, (——, red)
 $k_t k_z \phi _{{\varTheta _4}_y {\varTheta _4}_y}$ or
 $k_t k_z \phi _{{\varTheta _4} {\varTheta _4}}$, correspondingly. Here, the spatial coordinate in subscript denotes partial derivative with respect to that coordinate. Panels show (a)
 $y^+ = 0$, (b)
 $y^+ = 15$.

The PSDs calculated at  $y^+ = 30$ and
 $50$ are shown in figure 26. From this figure, we observe that the similarity in the distribution of energy for the scalar at
 ${\textit {Pr}} = 1$ and the streamwise velocity is lost as we move farther from the wall. In contrast to the observation of large streamwise structures at the wall, we find an increasing concentration of energy in smaller scales as we increase the Prandtl number. Further, the range of scales in which the energy is distributed also increases with
 ${\textit {Pr}}$. Focusing on the most energetic structures, we find that these are concentrated in a region of smaller temporal and spanwise scales with increasing
 ${\textit {Pr}}$ at both
 $y^+=30$ and
 $50$. For the scalar at
 ${\textit {Pr}} = 6$, the spectral peak is observed at
 $\lambda _z^+ \approx 100$ and
 $\lambda _t^+ \approx 20$ for
 $y^+ = 30$ and
 $50$.
Two-dimensional premultiplied PSD of streamwise velocity and scalar fields at (a)  $y^+=30$ and (b)
 $y^+=50$. The two contour lines correspond to 10 % and 50 % of the maximum energy density. We show:
 $k_t k_z \phi _{u u}$ (shaded contours), (——, blue)
 $k_t k_z \phi _{{\varTheta _1} {\varTheta _1}}$, (——, orange)
 $k_t k_z \phi _{{\varTheta _2} {\varTheta _2}}$, (——, green)
 $k_t k_z \phi _{{\varTheta _3} {\varTheta _3}}$, (——, red)
 $k_t k_z \phi _{{\varTheta _4} {\varTheta _4}}$.

5. Summary and conclusions
In the present study, a DNS of the thermal TBL is performed up to  ${\textit {Re}}_{\theta }=1080$ with passive scalars at
 ${\textit {Pr}}=1,2,4$ and
 $6$, which to authors’ knowledge is the highest Prandtl number simulated for the thermal boundary layer. Various statistical quantities for the flow and scalars were computed and compared against the reported channel and TBL data in the literature. Overall, the statistical quantities are in good agreement with the existing data whenever a comparison is possible. For higher
 ${\textit {Pr}}$, we also observed that the peak of the scalar fluctuations decreases when
 ${\textit {Re}}_\tau$ increases, which is different from the trend reported in the literature. Further, we showed that the variation of the peak in scalar fluctuation has a weak dependence with
 ${\textit {Re}}_\tau$ compared with the Prandtl number. Similarly, the peak in the heat flux also exhibits a weak dependence with
 ${\textit {Re}}_\tau$ compared with
 ${\textit {Pr}}$ of the scalar and the heat flux scales as
 ${\sim }{\textit {Pr}}^{0.4}$.
In the present study, we also highlighted the behaviour of the turbulent Prandtl number  ${\textit {Pr}}_t$, which does not approach a constant value of 1.07 as the wall is approached for higher Prandtl numbers. In addition, we also found the corresponding
 ${\textit {Pr}}_t$ to increase with
 ${\textit {Pr}}$, confirming the findings of Alcántara-Ávila & Hoyas (Reference Alcántara-Ávila and Hoyas2021). Finally, a brief description of the energy distribution in the scales for different
 ${\textit {Pr}}$ at different wall-normal locations is presented by analysing the 2-D pre-multiplied PSD.
The analysis and data provided in this work are expected to serve as a database for the research community to assess the validity of new turbulence models and validate other numerical and experimental results.
Acknowledgements
The simulations were run with the computational resources provided by the Swedish National Infrastructure for Computing (SNIC). The authors of the various databases used in this study are acknowledged for sharing the simulation data.
Funding
This work is supported by the funding provided by the Swedish e-Science Research Centre (SeRC), ERC grant no. ‘2021-CoG-101043998, DEEPCONTROL’ to RV and the Knut and Alice Wallenberg (KAW) Foundation.
Declaration of interests
The authors report no conflict of interest.
Data availability statement
The data that support the findings of this study are available on GitHub– KTH-Flow-AI.
Appendix A. Reynolds-stress budget
The Reynolds-stress equation is written (in index notation) as
 \begin{equation} \frac{{{\rm D}} \left\langle u_{j} u_{k}\right\rangle}{{{\rm D}} t} = \mathcal{P}_{jk} - \epsilon_{jk} + C_{jk} + \mathcal{D}_{jk} + T_{jk}, \end{equation}
where  ${\textrm {D}}/{\textrm {D}t}$ represents the material derivative and
 $\left \langle u_{j} u_{k}\right \rangle$ is the Reynolds-stress tensor. Here,
 $\mathcal {P}_{jk}$ denotes the production term,
 $\epsilon _{jk}$ is the viscous dissipation rate tensor,
 $C_{jk}$ is the velocity pressure-gradient term (which can be split into the pressure strain term and pressure diffusion term),
 $T_{jk}$ is the turbulent diffusion and
 $\mathcal {D}_{jk}$ is the molecular diffusion term. The corresponding terms are written respectively as
 \begin{gather} \mathcal{P}_{jk} :={-}\left\langle u_{k} u_{l}\right\rangle \frac{\partial \left\langle U_{j}\right\rangle}{\partial x_{l}} - \left\langle u_{j} u_{l}\right\rangle\frac{\partial \left\langle U_{k}\right\rangle}{\partial x_{l}}, \end{gather}
 \begin{gather}\epsilon_{jk} := 2\nu \left\langle \frac{\partial u_{j}}{\partial x_{l}}\frac{\partial u_{k}}{\partial x_{l}}\right\rangle, \end{gather}
 \begin{gather}C_{jk} :={-}\frac{1}{\rho}\left\langle u_{j} \frac{\partial p}{\partial x_{k}}+u_{k}\frac{\partial p}{\partial x_{j}}\right\rangle, \end{gather}
 \begin{gather}T_{jk} :={-}\frac{\partial }{\partial x_{l}} \left\langle u_{j} u_{k} u_{l}\right\rangle, \end{gather}
 \begin{gather}\mathcal{D}_{jk} := \nu \frac{\partial^2 }{\partial x_{l} \partial x_{l}}\left\langle u_{j} u_{k}\right\rangle. \end{gather}
A detailed description of the above terms can be found in Pope (Reference Pope2000) and they are non-dimensionalized by  $u_{\tau }^4/\nu$.
The obtained Reynolds-stress budgets at  ${\textit {Re}}_\theta =1080$ (which is located almost at the end of the computational domain before the fringe region) are compared with the data by Jiménez et al. (Reference Jiménez, Hoyas, Simens and Mizuno2010) in the TBL at
 ${\textit {Re}}_\theta =1100$, as shown in figure 27. All the different components contributing to the stress terms are in good agreement with the reference data.
Comparison of the Reynolds-stress budgets; (a)  $\left \langle uu\right \rangle$, (b)
 $\left \langle vv\right \rangle$, (c)
 $\left \langle ww\right \rangle$, (d)
 $\left \langle uv\right \rangle$, (——, black) present DNS, (
 $\circ$, black) Jiménez et al. (Reference Jiménez, Hoyas, Simens and Mizuno2010), (——, blue) convection, (——, orange) velocity-pressure diffusion, (——, green) dissipation, (——, red) production, (——, purple) molecular diffusion, (——, brown) turbulent diffusion.

The scalar-flux equation is written (in index notation) as
 \begin{equation} \frac{{{\rm D}} \left\langle u_{j} \varTheta_{i}\right\rangle}{{{\rm D}} t} = \mathcal{P}_{\varTheta_i j} - \epsilon_{\varTheta_i j} + C_{\varTheta_i j} + \mathcal{D}_{\varTheta_i j} + T_{\varTheta_i j}, \end{equation}
where  $\mathcal {P}_{\varTheta _i j}$ is the production term due to both the mean gradients of the velocity and scalar
 $\varTheta _i$,
 $\epsilon _{\varTheta _{i} j}$ is the dissipation term,
 $C_{\varTheta _i j}$ is the scalar-pressure-gradient correlation term (which can be split into a pressure scalar-gradient correlation term and a divergence of the pressure–scalar correlation term),
 $T_{\varTheta _i j}$ is the turbulent diffusion and
 $\mathcal {D}_{\varTheta _i j}$ is the molecular diffusion term. The terms are defined as
 \begin{gather} \mathcal{P}_{\varTheta_i j} :={-}\left\langle u_{l} \theta_{i}\right\rangle \frac{\partial \left\langle U_{j}\right\rangle}{\partial x_{l}} + \left\langle u_{j} u_{l}\right\rangle\frac{\partial \left\langle \varTheta_{i}\right\rangle}{\partial x_{l}}, \end{gather}
 \begin{gather}\epsilon_{\varTheta_i j} := \left(\nu + \frac{k}{\rho C_p}\right) \left\langle \frac{\partial u_{j}}{\partial x_{l}}\frac{\partial \theta_{i}}{\partial x_{l}}\right\rangle, \end{gather}
 \begin{gather}C_{\varTheta_i j} :={-}\frac{1}{\rho}\left(\frac{\partial \left\langle p \theta_i\right\rangle}{\partial x_j} - \left\langle p\frac{\partial \theta_i}{\partial x_j}\right\rangle\right), \end{gather}
 \begin{gather}T_{\varTheta_i j} :={-}\frac{\partial }{\partial x_{l}} \left\langle u_{j} u_{l} \theta_{i}\right\rangle, \end{gather}
 \begin{gather}\mathcal{D}_{\varTheta_i j} := \frac{\partial}{\partial x_l}\left( \frac{k}{\rho C_p}\left\langle u_j \frac{\partial \theta_i}{\partial x_l}\right\rangle +\nu\left\langle \theta_i \frac{\partial u_j}{\partial x_l}\right\rangle \right). \end{gather}
A detailed description of the scalar-flux budget terms can be found in Kozuka et al. (Reference Kozuka, Seki and Kawamura2009) and Li et al. (Reference Li, Schlatter, Brandt and Henningson2009). Due to the lack of TBL data at higher Prandtl numbers, the budgets for the scalar at  ${\textit {Pr}} = 2$ are compared against the channel DNS data from Kozuka et al. (Reference Kozuka, Seki and Kawamura2009), as shown in figure 28. Overall, there is a good comparison obtained for the different terms in the scalar-flux budgets. Also, as discussed in § 3.5, we observe a higher production compared with the channel-flow case for the vertical passive scalar-flux budget in the overlap region. In addition, the scalar-pressure diffusion term also exhibits the same behaviour as discussed above and it should be noted that the discrepancy not only stems from the different problem set-up but also the wall boundary condition for the scalar, which is Dirichlet in the present study and Neumann in the works of Kozuka et al. (Reference Kozuka, Seki and Kawamura2009). Further, a comparison of the data obtained at
 ${\textit {Pr}} = 6$ with the data obtained by Kozuka et al. (Reference Kozuka, Seki and Kawamura2009) at
 ${\textit {Pr}} = 7$ for a channel flow is also provided in figure 29. Overall, the comparison of the stress budgets at different parameter points shows a good agreement with the data available in the literature. Note that the small discrepancy observed in figure 29 is due to the different Prandtl numbers.
Comparison of the scalar-flux budgets; (a)  $\left \langle u\theta _i\right \rangle$, (b)
 $\left \langle v\theta _i\right \rangle$, (——, black) present DNS at
 ${\textit {Pr}} = 2$, (
 $\circ$, black) Kozuka et al. (Reference Kozuka, Seki and Kawamura2009) at
 ${\textit {Pr}} = 2$, (——, blue) convection, (——, orange) scalar-pressure diffusion, (——, green) dissipation, (——, red) production, (——, purple) molecular diffusion, (——, brown) turbulent diffusion.

Comparison of the scalar-flux budgets; (a)  $\left \langle u\theta _i\right \rangle$, (b)
 $\left \langle v\theta _i\right \rangle$, (——, black) present DNS at
 ${\textit {Pr}} = 6$, (
 $\circ$, black) Kozuka et al. (Reference Kozuka, Seki and Kawamura2009) at
 ${\textit {Pr}} = 7$, (——, blue) convection, (——, orange) scalar-pressure diffusion, (——, green) dissipation, (——, red) production, (——, purple) molecular diffusion, (——, brown) turbulent diffusion.


 Open access

