INTRODUCTION
Climate change has reorganized ecosystems throughout our planet's history (Gavin et al., Reference Gavin, Fitzpatrick, Gugger, Heath, Rodríguez-Sánchez and Dobrowski2014). Recognizing how ecosystems have responded to past changes in climate helps us understand the impact of future climate change (Harrison and Sanchez Goni, Reference Harrison and Sanchez Goni2010). The last glacial maximum (LGM) represents an extreme state of climate from 26.5 to 19 cal ka BP, when Northern Hemisphere solar insolation and CO2 levels in the atmosphere were low, global mean temperature was 4 ± 0.8°C cooler than today, and continental glaciers were near their maximum extents (Berger, Reference Berger1978; Clark et al., Reference Clark, Dyke, Shakun, Carlson, Clark, Wohlfarth, Mitrovica, Hostetler and McCabe2009; Annan and Hargreaves, Reference Annan and Hargreaves2013). On millennial or shorter time scales, this period was marked by changes in temperature and precipitation that punctuated the overall dry, cold LGM climate of the Pacific Northwest (Grigg and Whitlock, Reference Grigg and Whitlock2002; Jiménez-Moreno et al., Reference Jiménez-Moreno, Anderson, Desprat, Grigg, Grimm, Heusser, Jacobs, Lopez-Martinez, Whitlock and Willard2010; Oster et al., Reference Oster, Ibarra, Winnick and Maher2015). The millennial-scale changes had large impacts on global ecosystems, including those in the Pacific Northwest (Barnosky, Reference Barnosky1984; Mathewes, Reference Mathewes1991; Behl and Kennet, Reference Behl and Kennet1996; Hicock, et al., 1999; Lian et al., Reference Lian, Mathewes and Hicock2001; Thackray, Reference Thackray2001; Pisias et al. Reference Pisias, Mix and Heusser2001; Grigg and Whitlock, Reference Grigg and Whitlock2002; Jiménez-Moreno et al., Reference Jiménez-Moreno, Anderson, Desprat, Grigg, Grimm, Heusser, Jacobs, Lopez-Martinez, Whitlock and Willard2010; Harrison and Sanchez Goni, Reference Harrison and Sanchez Goni2010).
Changes in the abundance and diversity of pollen and macrofossils in cores of lake sediments form the basis for much of our understanding of the LGM climate and ecosystems in the Pacific Northwest. Most of the sites studied to date are located in the southern Puget Lowland (Barnosky, Reference Barnosky1981, Reference Barnosky1985), coastal Olympic Peninsula (Heusser, Reference Heusser1974, Reference Heusser1978; Ashworth et al. Reference Ashworth, Thackray, Gavin, Waitt, Thackray and Gillespie2021), Oregon (Grigg and Whitlock, Reference Grigg and Whitlock1998; Marshall et al. Reference Marshall, Roering, Gavin and Grangers2017), and British Columbia Fraser Lowland (Hicock and Lian, Reference Hicock and Lian1995; Telka et al., Reference Telka, Ward and Mathewes2003; Hebda et al. Reference Hebda, Lian and Hicock2016; Figs. 1 and 2). Research at these lowland sites has identified the basic pattern of plant geography and environmental change during the LGM, which is characterized by millennial-scale fluctuations between tundra and boreal (i.e., parkland, subalpine) vegetation (Heusser, Reference Heusser1977; Grigg and Whitlock, Reference Grigg and Whitlock2002; Lian et al., Reference Lian, Mathewes and Hicock2001; Ashworth et al., Reference Ashworth, Thackray, Gavin, Waitt, Thackray and Gillespie2021). The variable LGM climate led to multiple advances of alpine glaciers in the Olympic and Cascade Mountains (Thackray, Reference Thackray2001; Porter and Swanson, Reference Porter and Swanson2008; Riedel et al., Reference Riedel, Clague and Ward2010; Whyshnytzky et al., Reference Wyshnytzky, Rittenour, Thackray and Shulmeister2019).
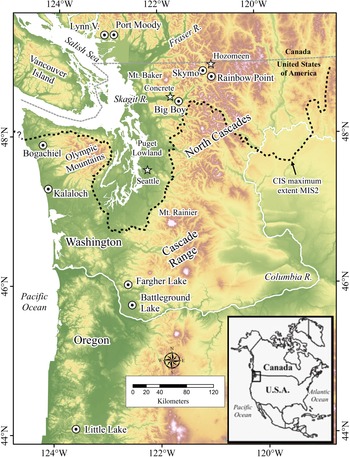
Paleoecological study sites dating to the last glacial maximum in western Washington and southwestern British Columbia (circles) and other place names referred to in the text (stars). Dashed line is Cordilleran ice sheet maximum extent during Marine Isotope Stage 2 (MIS 2) in Puget Lowland (Porter and Swanson, Reference Porter and Swanson1998) and the North Cascades (Waitt and Thorson, Reference Waitt, Thorson and Porter1983; Riedel, Reference Riedel2017).

Last glacial maximum paleoenvironmental records from western Washington and southwestern British Columbia. Climate events on the right are after Armstrong et al. (Reference Armstrong, Crandell, Easterbrook and Noble1965) and Hicock and Lian (Reference Hicock and Lian1995). Data sources: Bogachiel Bog: Heusser (Reference Heusser1978); Hoh-Kalaloch: Heusser (Reference Heusser1974, Reference Heusser1978, Reference Heusser and Porter1983) and Ashworth et al. (Reference Ashworth, Thackray, Gavin, Waitt, Thackray and Gillespie2021); Fargher Lake: Heusser and Heusser (Reference Heusser and Heusser1980) and Grigg and Whitlock (Reference Grigg and Whitlock2002); Little Lake: Grigg et al. (Reference Grigg, Whitlock and Dean2001) and Marshall et al. (Reference Marshall, Roering, Gavin and Grangers2017); Battleground Lake: Barnosky (Reference Barnosky1981, Reference Barnosky1985); Port Moody: Hicock and Armstrong (Reference Hicock and Armstrong1981), Hicock et al. (Reference Hicock, Hebda and Armstrong1982), Hicock and Lian (Reference Hicock and Lian1995), and Lian et al. (Reference Lian, Mathewes and Hicock2001). MIS2, Marine Isotope Stage 2

Major spatial and temporal gaps exist in the regional record, notably in the North Cascade Range in Washington State (Barnosky et al., Reference Barnosky, Anderson, Bartlein, Ruddiman and Wright1987; Fig. 1). The limited number of sites investigated and poor age control limit regional correlations between sites and identification of the magnitude and timing of millennial-scale changes in climate (Jiménez-Moreno et al., Reference Jiménez-Moreno, Anderson, Desprat, Grigg, Grimm, Heusser, Jacobs, Lopez-Martinez, Whitlock and Willard2010). Data for the early part of LGM are also scarce, particularly in areas like Skagit Valley that were subsequently covered by the Cordilleran ice sheet. Riedel (Reference Riedel2007) described plant- and animal-rich macrofossil assemblages in well-exposed beds at two sites, 75 km apart, in Skagit Valley in the North Cascade Range (Fig. 1). This rich terrestrial record provided abundant material for radiocarbon dating and the potential to refine our understanding of the timing and magnitude of millennial-scale events in this region.
Our objective in this paper is to use the macrofossil assemblages from the Skagit Valley ice age refugia to describe the ecology of, and to quantitatively reconstruct climate during, the LGM. Macrofossils are excellent indicators of climate and provide context for understanding modern species distribution, adaptation, and evolution (Gavin et al., Reference Gavin, Fitzpatrick, Gugger, Heath, Rodríguez-Sánchez and Dobrowski2014). We use a probability density function (PDF) approach (Kühl et al., Reference Kühl, Gebhart, Litt and Hense2002) to estimate median annual precipitation (MAP) and July and January air temperatures at 12 times from 27.7 to 19.8 cal ka BP (all radiocarbon ages reported as thousands of calibrated years before present) based on the modern range and mean climate state of 14 species in the 12 macrofossil assemblages. The times and magnitudes of changes in precipitation and temperature are then used to identify millennial-scale climate variability. Finally, we compare the changes in the Skagit Valley record with regional and global changes in climate inferred from pollen records, ocean sediment cores, the activity of glaciers, and the chemistry of Greenland ice cores.
CLIMATE AND ECOLOGY OF SKAGIT VALLEY
The Skagit River watershed drains 8000 km2 of rugged mountain topography with steep climate gradients and a wide range of physical and ecological conditions (Figs. 1 and 3). Fluvial and glacial erosion have cut a deep valley in metamorphic and granitic bedrock that dominates the catchment. Relief from the river delta to the summit of Mount Baker, the highest point in the watershed, is 3200 m (Fig. 1). The floor of Skagit Valley at Ross Lake, more than 150 km east of Puget Sound, is only 400 m above sea level (m asl). The valley shares several low-elevation divides with the Fraser River and Okanogan River watersheds due to elimination of geographic barriers by glacial breaching of mountain divides during continental glaciation (Flint, Reference Flint1971; Riedel et al., Reference Riedel, Haugerud and Clague2007). For most of the Pleistocene, biota have been able to migrate into and out of Skagit Valley along the floors of these interconnected valleys, avoiding extreme conditions at higher elevations.
There are strong temperature and precipitation gradients with distance from Puget Sound and with elevation in Skagit Valley. Precipitation on the valley floor ranges from 1700 mm/yr at Concrete to 1000 mm/yr at Hozomeen Campground at the north end of Ross Lake (National Weather Service, 2019; Natural Resource Conservation Service, 2019; Fig. 1). There is a significant increase in the seasonal range of air temperature at Hozomeen due to the stronger continental climate and rain-shadow effect in upper Skagit Valley (Fig. 3). Mean annual precipitation increases significantly with elevation, and annual snowfall exceeds 20 m at higher elevations, feeding 377 glaciers in the Skagit River watershed (Riedel and Larrabee, Reference Riedel and Larrabee2016).
Mean July and January temperatures are 18.1°C and 2.5°C, respectively, on the floor of lower Skagit Valley at Concrete, and 18.8°C and −0.6°C at Hozomeen Campground in the upper valley (National Weather Service, 2019; Natural Resource Conservation Service, 2019; Fig. 1). The cool marine waters of Puget Sound suppress summer air temperatures and moderate winter air temperatures at Concrete. Seasonal climate variability is controlled now, as during the LGM, by the strength and position of the North Pacific High and the Aleutian Low (Oster et. al., 2015). The Aleutian Low strengthens and moves south in winter, bringing storms and a majority of the annual precipitation to western North America. In summer, the North Pacific high-pressure region moves north, creating dry weather.
Vegetation on the floor of lower Skagit Valley is currently dominated by temperate lowland forest conifers, including red cedar (Thuja plicata), Douglas-fir (Pseudotsuga menziesii), and western hemlock (Tsuga heterophylla). Lowland trees also occupy the valley floor near Ross Lake, but xeric species such as ponderosa pine (Pinus ponderosa) are present on drier sites on the east side of the valley. Strong temperature and precipitation gradients control the elevation of the tree line and the distribution of tree-line species. In the western part of the watershed, the tree line is 1400 ± 150 m asl and is depressed by heavy winter snowfall (Franklin and Dyrness, Reference Franklin and Dyrness1988). Subalpine fir (Abies lasiocarpa) and mountain hemlock (Tsuga mertensiana) dominate the heavy snow and cool summer environments at the tree line in those areas. The tree line rises to 1700 ±150 m asl in the colder and more arid environment on the east side of Ross Lake near Hozomeen (Arno and Hammerly, Reference Arno and Hammerly1984), where Engelmann spruce (Picea engelmannii) and whitebark pine (Pinus albicaulis) are the dominant subalpine species.
Little information is available on contemporary beetle (Coleoptera) communities in Skagit Valley, although a survey of Big Beaver valley near Ross Lake yielded 360 species of terrestrial and aquatic beetles in 49 families (LaBonte, Reference LaBonte1998), and Campbell (Reference Campbell1983, Reference Campbell1984) conducted surveys of beetles near Mount Baker and in Manning Provincial Park in southwestern British Columbia. Data from these studies helped define the range of several key beetle species that are used in our quantitative analyses.
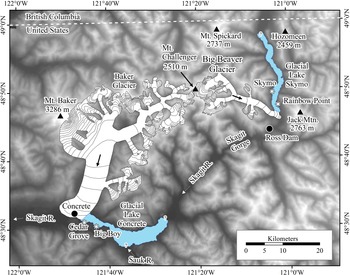
During the last Pleistocene glaciation (Fraser Glaciation, Marine Isotope Stage 2 [MIS 2]), glacial Lake Skymo (GLS) extended across the entire 2 km width of upper Skagit Valley over a distance of at least 15 km from a moraine or ice dam at the mouth of Big Beaver Creek (Riedel et al., Reference Riedel, Clague and Ward2010; Fig. 3). At about the same time and 75 km to the southwest and 400 m lower in elevation, glacial Lake Concrete (GLC) occupied a part of lower Skagit Valley (Fig. 3). The elevation of GLC (60 m asl) is similar to that of several other latest Pleistocene paleoecological sites in the region (Fig. 1). The elevation of GLS sediments is about 460 m asl, similar to elevations of the previously studied Fargher and Battleground lakes paleoecological sites (Fig. 1). However, GLS is farther east, deep in the Cascade Range, unlike any other previously reported site in Washington.
The glacial lake record at the LGM is fragmentary, because the 1800-m-thick, fast-advancing Cordilleran ice sheet buried or eroded most deposits (Riedel, Reference Riedel2017). However, lake sediments containing macrofossils are preserved down-ice of bedrock valley spurs in gullies 40 m above the valley floor along the shores of Ross Lake reservoir. These sediments are exposed by wave erosion during seasonal fluctuations of the level of the reservoir. Macrofossils are also preserved near the terminus of the ice sheet in lower Skagit Valley, where they covered by advance outwash and till (Riedel, Reference Riedel2017). They are exposed in two large cutbanks on the south side of Skagit River near the community of Concrete (Fig. 3). Both lakes trapped and preserved macrofossils in silt, because they had stable bedrock outlets that maintained relatively consistent water surface levels and shorelines (Riedel et al., Reference Riedel, Clague and Ward2010). The lakes had maximum depths of 40 m (GLC) and 80 m (GLS) (Riedel et al., Reference Riedel, Clague and Ward2010; Fig. 3).
METHODS
Data sources
We obtained bulk sediment samples from three sections in Skagit Valley: two along the shoreline of Ross Lake and one along Skagit River near Concrete (Riedel, Reference Riedel2007; Riedel et al. Reference Riedel, Clague and Ward2010; Fig. 3). The organic content of each sample was measured by volume after removing detrital sediment (Supplementary Material 1). We focused on macrofossils from these sites because they are abundant in accessible, well-exposed beds and, unlike most coniferous pollen, can be identified to the species level.
We collected 1 and 2 L samples from 12 glaciolacustrine beds (Figs. 3 and 4). We collected most samples in a vertical sequence at each section, but in some cases, we moved laterally to sample because of limitations imposed by exposure and debris flow deposits. Beds were sampled at approximate 100–200 cm intervals at GLC and 200–400 cm at GLS. The sampling interval is roughly equivalent to 650 yr, a temporal resolution similar to most pollen studies (Whitlock, Reference Whitlock1992). At this temporal scale, vegetation can respond to significant changes in climate (Birks and Birks, Reference Birks and Birks1981).
Extent of two alpine valley glacier systems and related lakes in Skagit Valley at the global last glacial maximum (Riedel et al., Reference Riedel, Clague and Ward2010). Alpine glaciers in adjacent valleys have not been reconstructed. Asterisks show locations of macrofossil beds reported in this paper.

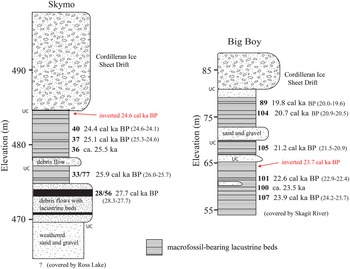
Key Skagit Valley stratigraphic sections showing approximate last glacial maximum assemblage locations and associated median radiocarbon ages in cal ka BP (2σ age range in parentheses). Unconformable contacts marked by “UC.” Note: Ages differ slightly from those in Riedel et al. (Reference Riedel, Clague and Ward2010) due to the use of different calibration programs.

The macrofossils were examined in detail at two laboratories: the Paleotech laboratory in Ottawa (all species) and the School of Environmental and Forest Sciences at the University of Washington in Seattle (conifers), where modern reference collections were used for identification. In three samples we looked only for conifer needles. In final needle counts, we used whole needles plus the number of tips and bases divided by two. Laboratory and identification procedures are summarized in Supplementary Material 1.
Riedel (Reference Riedel2007) obtained radiocarbon ages on 10 of 12 assemblages to establish a chronological framework (Supplementary Material 5). We use linear depth–age models from both glacial lakes to infer the ages of two undated samples between dated beds and rounded those interpolated ages to the nearest 100 yr (Riedel et al., Reference Riedel, Clague and Ward2010). Accelerator mass spectrometry (AMS) ages were determined at Beta Analytic Laboratory, Lawrence Livermore National Laboratory, and the University of California Irvine Keck Carbon Cycle AMS Laboratory (Supplementary Material 5). We calibrated our raw radiocarbon ages and those previously published on regional pollen zone boundaries and glacial events using OxCal 4.3 (Bronk Ramsay, Reference Bronk Ramsay2009; Supplementary Material 5). All calendric ages reported herein are the most probable (median) age, with a 2σ range (95.4%) provided on some figures and in the Supplementary Material.
We focus on 14 species of macrofossils to characterize the LGM climate of Skagit Valley (Table 1). We were unable to distinguish silver fir (Abies amabilis) from grand fir (Abies grandis) and Douglas-fir from western hemlock. Many of these species exist today in cold and dry boreal or alpine settings, although disjunct populations occur at lower elevations and latitudes in favorable microclimates. Like Barnosky (Reference Barnosky1984), we use mountain hemlock and Engelmann spruce as primary indicators of the Late Pleistocene climate in Puget Lowland because they are distributed at opposite ends of a maritime (cool/wet) to continental (cold/dry) subalpine climate transect at the tree line (Franklin and Dyrness, Reference Franklin and Dyrness1988; Mathewes, Reference Mathewes1993). Whitebark pine occurs in cold dry climates at high elevations on the eastern slopes of the Cascade and Coast Mountains (Franklin and Dyrness, Reference Franklin and Dyrness1988; Lian et al., Reference Lian, Mathewes and Hicock2001). Northern spikemoss (Selaginella selaginoides) and black crowberry heath (Empetrum nigrum) live today in coastal settings from northern Vancouver Island north to Alaska (Franklin and Dyrness, Reference Franklin and Dyrness1988; Heusser and Igarashi, Reference Heusser and Igarashi1994). Heusser and Peteet (Reference Heusser and Peteet1988) used northern spikemoss in paleoecological reconstructions along the Pacific coast to identify open boreal conditions.
Indicator plant and insect macrofossils and their modern climate means fro Climate WNA (Wang et al. Reference Wang, Hamann, Spittlehouse and Murdock2012) derived from range data for trees from Thompson et al. (Reference Thompson, Anderson, Pelltier, Strickland, Shafer, Bartlein and McFadden2015) and beetles from A. Ashworth (written communication, 2018).

a Megabiomes and related high-elevation terms from Jiménez-Moreno et al. (Reference Jiménez-Moreno, Anderson, Desprat, Grigg, Grimm, Heusser, Jacobs, Lopez-Martinez, Whitlock and Willard2010).
b TRF, temperate rain forest.
c Climate and range of other species from the WorldClim data set (Fick and Hijmans, Reference Fick and Hijmans2017) and version 4.1 of the Botanical Information and Ecology Network (Enquist et al., Reference Enquist, Condit, Peet, Schildhauer and Thiers2016), respectively.
We use three beetle species in the Staphylinidae family as climate indicators (Table 1). The predatory rove beetles Eunecosum tenue, Olophrum consimile, and Olophrum boreale are thought to respond rapidly to climate change (Elias, Reference Elias2002; Ashworth et al., Reference Ashworth, Thackray, Gavin, Waitt, Thackray and Gillespie2021). All three species have relatively narrow temperature tolerances and are found today in northern boreal, subarctic, and alpine settings in cool moist habitats along streams and lakeshores (Campbell, Reference Campbell1983, Reference Campbell1984; Elias, Reference Elias2002). Olophrum consimile prefers more maritime environments, whereas O. boreale is found in more continental settings. Disjunct populations of these species have been found in alpine and subalpine settings near Skagit Valley. Olophrum consimile was identified in the modern Big Beaver study near Ross Lake and at Austin Pass near Mount Baker (LaBonte, Reference LaBonte1998).
We obtained modern range maps for trees from the Climate Vegetation Atlas (Thompson et al., Reference Thompson, Anderson, Pelltier, Strickland, Shafer, Bartlein and McFadden2015) and range data for beetles from Campbell (Reference Campbell1983, Reference Campbell1984) and A. Ashworth (written communication, 2018). We use gridded climate data to develop the July, January, and annual precipitation probability distributions for each indicator species (Wang et al., Reference Wang, Hamann, Spittlehouse and Murdock2012). These data are based on PRISM (Parameter Elevation Regression on Independent Slopes Model), a method that interpolates 30-yr normal climate observations (1981–2010) across complex topography with 4 km resolution.
Data analysis
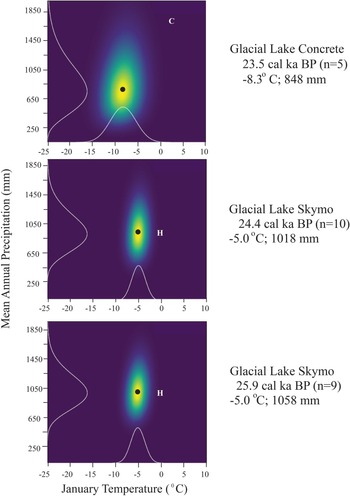
We use the PDF method of Kühl et al. (Reference Kühl, Gebhart, Litt and Hense2002) to make quantitative climate estimates from the macrofossil assemblages. All analyses were completed in R and C code v. 3.53 provided by Kühl (Aarnes et al., Reference Aarnes, Kuhl and Birks2012; R Core Team, 2019). This approach uses species presence/absence with modern range and climate data to develop probabilistic envelopes of one or more climate variables (Aarnes et al., Reference Aarnes, Kuhl and Birks2012; Fig. 5). The PDF approach integrates conditional PDFs for all species present at a given time to generate estimates of climate for an assemblage of those species. This method reduces the dependence of climate estimates on single species that have wide climate envelopes. We focus on median values of annual precipitation and July and January air temperatures. We do not report mean values, because PDF distributions are not normal, making the median value a better measure of central tendency.
Probability density function plots of mean annual precipitation and mean January air temperature for three time periods based on the Skagit glacial lake macrofossil assemblages. Warmer colors indicate higher probability; white lines show scaled probability distributions; and black dots most probable value (median). Modern climate shown for reference at Concrete (C) and Hozomeen (H).

We considered abundance and diversity of all species to confirm PDF results of climate variability (Table 2). We compare our PDF results with regional pollen, ocean sediment cores, and glacial geology records to confirm the magnitude of climate changes and the timing of millennial-scale variability (Heusser, Reference Heusser1977; Barnosky, Reference Barnosky1985; Clark and Bartlein, Reference Clark and Bartlein1995; Hicock et al., Reference Hicock, Lian and Mathewes1999; Pisias et al., Reference Pisias, Mix and Heusser2001; Thackray, Reference Thackray2001; Grigg and Whitlock, Reference Grigg and Whitlock2002; Jiménez-Moreno et al., Reference Jiménez-Moreno, Anderson, Desprat, Grigg, Grimm, Heusser, Jacobs, Lopez-Martinez, Whitlock and Willard2010; Riedel et al., Reference Riedel, Clague and Ward2010; Fig. 2). Finally, we compare the Skagit-enhanced regional paleoclimate history to the oxygen-isotope record in the NRGIP GICCO5 chronology (Svensson et al., Reference Svensson, Andersen, Bigler, Clausen, Dahl-Jensen, Davies, Johnsen and Muscheler2008) and the stades and interstades identified in these records (Harrison and Sanchez Goni, Reference Harrison and Sanchez Goni2010).
Summary of glacial Lake Concrete (GLC) and glacial Lake Skymo (GLS) macrofossil assemblages.

a N/A, no measurement of total organic content; conifer needle counts only.
Sources of error
Our temporally coarse sample scheme and 1–2 L sample size limit the influence of needle production rate on our results (Birks and Birks, Reference Birks and Birks1981). Based on the relatively slow sedimentation rates of 4–5 mm/yr in GLC and GLS (Riedel et al., Reference Riedel, Clague and Ward2010), each sample should span more than 50 yr, thereby reducing the effect of variability in needle production between species and the influence of short-term disturbance events and seasonal variation in needle production.
The main sources of error in our analysis include sampling, potential mixing of specimens between beds, and limitations of the PDF approach. We attempted to assure the integrity of macrofossil samples by collecting them from undisturbed beds of laminated silt and clay. Well-preserved specimens, including articulated beetles, and the preponderance of radiocarbon ages in stratigraphic order also indicate that disturbance was not continuous.
Taphonomic processes that lead to macrofossil deposition include redistribution by currents and wind. In GLC and GLS, these processes may have affected macrofossil abundance and diversity in individual samples. This is clearly shown by the general lack of macrofossils in GLS beds on the east side of Skagit Valley, whereas some samples collected on the west shore 2.5 km across the valley contain thousands of macrofossils. We assume that taphonomic factors that might cause differential sorting of needles were constant through time for samples collected vertically in a section at a given site. However, inverted radiocarbon ages at the main sample sites indicate that some mixing of specimens from older beds into younger ones may have occurred in both glacial lakes.
The primary sources of uncertainty in the PDF method are the wide ecological range of some species and a low number of species identified in some assemblages. The presence of three or fewer species in 5 of the 12 assemblages is the most significant source of error in this analysis. Aarnes et al. (Reference Aarnes, Kuhl and Birks2012) used a similar approach that had several samples with fewer than three species. They urged caution when interpreting results from small samples but found that removing them from their analysis had a small effect on the overall climate estimate. The uncertainty in each PDF estimate is the result of the uncertainty in each of the species estimates. The error in the estimate of average climate over the period of record is the average of the error from each assemblage used (n > 3; Table 3). Our reliance on tree macrofossils increases uncertainty in our results, because many of the species have broad ecological ranges (Table 1). Accuracy of the Thompson et al. (Reference Thompson, Anderson, Pelltier, Strickland, Shafer, Bartlein and McFadden2015) range maps and the inherent compromises made when producing a gridded climate product like PRISM are other potential sources of error. We did not conduct a modern calibration test.
Results of the probability density function reconstruction of climate in Skagit Valley during the last glacial maximum.

RESULTS
Macrofossil-bearing glacial lake sediments from the two sites in Skagit Valley span nearly 8000 yr during the LGM (early MIS 2). The GLS beds range from 27.7 to 21.8 cal ka BP, and the GLC beds from 23.9 to 19.8 cal ka BP (Figs. 3 and 4). Riedel et al. (Reference Riedel, Clague and Ward2010) described the stratigraphy, sedimentology, and geochronology at these sites. We provide a brief summary of the biological component of each assemblage here; more detailed descriptions and radiocarbon age data are presented in the Supplementary Material.
An inverted radiocarbon age was obtained from a bed directly below ice sheet till but several meters above sample NOCA 40 at GLS (Riedel et al., Reference Riedel, Clague and Ward2010; Fig. 4). One inverted radiocarbon age from GLC was obtained from beneath an alluvial gravel deposit unconformably overlying the lake beds (Fig. 4). The inverted age was from a bed about 50 cm above NOCA 101 (Fig. 4; Supplementary Material 4).
Glacial Lake Skymo
We recovered macrofossils at the Skymo and Rainbow Point sections along the shoreline of Ross Lake in upper Skagit Valley (Figs. 3 and 4). Most of the plant macrofossils and all the faunal remains came from the Skymo section on the west shore of the former glacial lake. The abundance of macrofossils at the Skymo section and their rarity at Rainbow Point suggests they were concentrated in bays on the west side of the lake by easterly winds. Only a few conifer needles were found near the top and bottom of the Rainbow Point section, but they extend the GLS record by 2600 yr (Fig. 6).
Macrofossil diversity and abundance through time ing Lake Concrete (open bars) and glacial Lake Skymo (black bars) assemblages. The species shown are those used in the probability density function analysis and others of interest. Note change in scale for abundant species (e.g., Picea engelmanii, Pinus albicaulis, Selaginella selagenoides, and Carex), and the change to presence (P)/absence (A) for rare boreal species and beetles (Olophrum boreae [OLBO], Olophrum consimile [OLCO], and Eucnecosum tenue [EUTE]).

Some of the GLS samples contain few macrofossils, whereas others have thousands of specimens (Fig. 6; Supplementary Material 2). The oldest sample at GLS, collected from the Rainbow Point section, dates to 27.7 cal ka BP (NOCA 28/56) and includes needle tips and bases from three tree species: Douglas-fir/western hemlock, mountain hemlock, and Engelmann spruce.
The next sample in the sequence, from the Skymo section (NOCA 33/77), yielded an age of 25.9 cal ka BP and is rich in plant macrofossils, with 24 taxa (Table 2). The assemblage is dominated by needles of subalpine fir, Engelmann spruce, and whitebark pine (Fig. 6). It also includes boreal/subarctic nutlets of dwarf birch (Betula nana) and black crowberry heath (see photo Supplementary Material 3). This assemblage contains weevils (Curculionidae) and bark (Scolytidae), rove (Staphylinidae), and pill (Byrrhidae) beetles (Supplementary Material 4). Sample NOCA 36 at 25.5 cal ka BP contains less than 1% organic material by volume and only a few subalpine tree macrofossils (it was not examined for non-conifer species).
Sample NOCA 37 (25.1 cal ka BP) contains 25 taxa (Table 2). Whitebark pine is the dominant species, with hundreds of needles and many fascicles, followed by sedge (Carex) achenes. The assemblage also includes needles of the temperate/montane species grand/silver fir, several species of rove and bark beetles, and two unknown genera of weevils.
Sample NOCA 40 (24.4 cal ka BP), with 17% organic material, is taxonomically the richest at the Skymo section, with 32 taxa. Subalpine trees are dominant, but the assemblage includes temperate forest species (Fig. 6). We also found the cold-adapted rove beetles (Staphylinidae) Eucnecosum tenue and Olophrum boreale, as well as bark and ground beetles (Carabidae) in this sample.
Two samples collected at the Rainbow Point section on the east shore of Ross Lake (NOCA 61 and 98) yielded 21 coniferous macrofossils that could be identified to the species level (Fig. 6). They include Engelmann spruce, mountain hemlock, subalpine fir, and four needles of either western hemlock or Douglas-fir (Fig. 6; Supplementary Material 3).
The cold waters of GLS also sustained several aquatic flora and fauna. Samples NOCA 37 and 40 contain the circumboreal pondweed (Potamogeton alpinus), and samples NOCA 33, 37, and 40 contain the emergent white water buttercup (Ranunculus aquatilus). The lake was also inhabited by predaceous diving beetles (Dystiscidae), water scavenger beetles (Hydrophilidae), caddisflies, water fleas, and midges (Chironomidae) (Supplementary Material 4).
Glacial Lake Concrete
The 29-m-tall Big Boy section on the south bank of Skagit River provides access to the well-exposed lacustrine sediments (Riedel et al., Reference Riedel, Clague and Ward2010; Fig. 4). We examined the lowest sample NOCA 107 (23.9 cal ka BP) for conifer needles and found only two, grand/silver fir and subalpine fir.
The next sample in the sequence (NOCA 100; 23.5 cal ka BP) yielded 22 taxa, including two boreal beetles (the rove beetle O. boreale and the ground beetle Elaphrus clairvillei) and northern spikemoss (Fig. 7; Supplementary Material). The assemblage contained subalpine fir, Engelmann spruce and Sitka spruce needles (Picea sitchensis; Fig. 6).
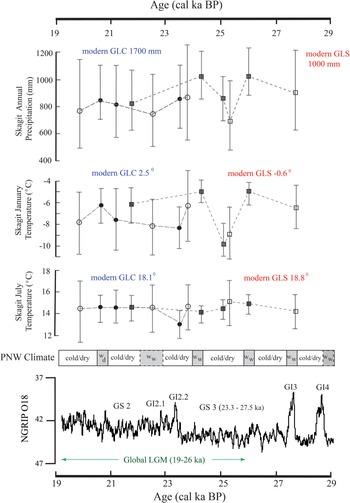
Last glacial maximum climate in Skagit Valley based on probability density function results for 14 indicator species at glacial Lakes Skymo (GLS; squares) and Concrete (GLC; circles; Table 1). Symbols are median values, and whiskers represent interquartile range in air temperature and annual precipitation estimates. Open symbols have large uncertainties due to a sample size of three or fewer (Table 3). Pacific Northwest (PNW) climate is a summary of Skagit Valley and other regional data. Gray boxes depict relatively warm/wet intervals. Dashed boxes are signals from other regional proxies not observed in the Skagit record. At bottom is the North Greenland Ice Core Project oxygen-isotope record of climate change based on GICC05 ages with Greenland climate stades (GS) and interstades (GI) (Svensson et al., Reference Svensson, Andersen, Bigler, Clausen, Dahl-Jensen, Davies, Johnsen and Muscheler2008; INTIMATE Project Members, 2014).

Sample NOCA 101 (22.7 cal ka BP) contains 17 taxa, including abundant sedge achenes and northern spikemoss megaspores identified on the basis of large spore size (0.48–0.53 mm) and yellow-green color (Tyron, Reference Tyron1949; Fig. 6; Table 2). Northern spikemoss macrofossils have not previously been found in Pleistocene sediments in the Cascade Range (Heusser and Igarashi, Reference Heusser and Igarashi1994). The boreal beetles E. clairvillei and O. consimile are also present in the assemblage. Sample NOCA 101 contains two groups not found lower in the section: feather-wing beetles (Ptiliidae) and click beetles (Elateridae) (Supplementary Material 4).
Sample NOCA 105 (21.2 cal ka BP) was collected from a dark-gray silt bed consisting of 40% organic material, three-quarters of which is moss and most of the remainder flattened twigs, bark, and horsetail (Equisetum) fragments (Table 2). It is the richest GLC assemblage, with 39 taxa, including silver fir and subalpine fir needles, along with many sedge achenes, nearly 70% of which have partial seed coats. The second most common macrofossils are willow (Salix) seed capsules, twigs, and persistent buds. The sample also contains several other taxa that were not found lower in the section, including rush (Luzula and Juncaceae spp.) seeds, buckwheat (Polygonum sp.), and silverweed cinquefoil (Potentilla anserina; Supplementary Material 3). The assemblage includes two species of ground beetles (Carabidae); nine species of rove beetles, including oscellate species O. consimile and O. boreale; click beetles (Ptiliidae); leaf beetles (Chrysomelidae); and weevils (Curculionidae). It also includes several species of aquatic beetles.
Sample NOCA 104 (20.7 cal ka BP), collected from near the top of the Big Boy lacustirine sequence, contains 30 taxa dominated by subalpine fir and Engelmann spruce needles (Fig. 6; Table 2). Notably absent from the assemblage are northern spikemoss macrofossils, which are abundant lower in the section. A complete, flattened Engelmann spruce cone (NOCA 89; 19.8 cal ka BP) is the youngest dated macrofossil at the Big Boy section and was identified based on cone length and diameter. The NOCA 104 assemblage contains fewer species of beetles than NOCA 105, but still is a diverse collection of ground, rove, click, and leaf beetles. It also includes weevils, pill beetles (Elateridae), and two species of dung beetles (Scarabaeidae), but no aquatic taxa (Supplementary Material 4).
Paleoclimate
The PDF analysis relies on 14 species that are present at 12 times during the LGM at the two glacial lakes (Figs. 5 and 7; Table 3). Climate reconstructions for seven assemblages are based on four to nine species, whereas the other five are limited to one to three species (Fig. 6; Table 3). The resulting large errors in the climate estimates for the five assemblages are unavoidable, because we could not include aquatic species or those without reliable range information (Fig. 7; Tables 1 and 3). However, the PDF procedure is insensitive to the removal of some groups, including beetles and some plant species with broad environmental ranges (Table 1).
We averaged the PDF climate estimates at each site for all assemblages with more than three species to get a broad estimate of climate change during the entire LGM (Table 3). At GLS, median January and July air temperatures were −6.8 ± 1.9°C and 12.5 ±1.5°C, respectively, and MAP was 937 ± 272 mm (Table 3). The corresponding averages at GLC were −7.4 ± 3.3°C, 13.9 ± 2.1°C, and 835 ± 354 mm, respectively.
All our PDF climate estimates represent large changes from today's climate in Skagit Valley. Average median July air temperature for all assemblages was 4.2°C lower than today at GLC and 6.3°C lower than today at GLS (Fig. 7). Average median January air temperature was depressed more at GLC (−9.9°C) than at GLS (−6.2°C; Fig. 7). Mean annual precipitation also changed more at GLC, with a decrease of 50% compared with 10% in the more continental environment at GLS.
Our PDF results reveal variations in all three climate indices during the LGM (Fig. 7; Table 3). Median January air temperature fluctuated ±4.3°C at GLS and ±2.1°C at GLC (Table 3). Median July air temperature varied ±2.0°C at GLS and ±1.6°C at GLC. MAP ranged from 822 ± 332 to 1058 ± 241 mm at GLS and from 575 ± 376 to 874 ± 454 mm at GLC. The PDF results show a slight drying trend from 25.9 to 21.7 cal ka BP at GLS (Fig. 7). Climate variability is indicated by warmer winters and higher precipitation at 27.7, 25.9, and 24.4 cal ka BP at GLS, and from 21.2 cal ka BP until at least 20.7 cal ka BP at GLC (Fig. 7).
DISCUSSION
LGM paleoecology
We cannot rule out mixing of macrofossils from higher elevations, particularly in upper Skagit Valley, where the waters of GLS intersected steep slopes. However, the large number of subalpine macrofossils and fossil preservation suggest they were not transported far by slope or alluvial processes. We infer that differing microclimates along the lake shorelines were the main factor allowing both temperate forest and open boreal species to share the same habitat during certain periods. Microclimates existed due to elevation, topographic shading/exposure, cold air drainage down tributary valleys, and abundant moisture along the lakes. They exist today as illustrated by the presence of disjunct populations of ponderosa pine, aspen (Populus), and juniper (Juniperus) on the east shore of Ross Lake.
The different settings of GLS and GLC are responsible for clear differences in plant and insect assemblages. GLC beds are about 50 m asl, whereas GLS beds, 75 km to the east, are 400 m higher and in the rain shadow of the Picket Range. The lower elevation and wider valley setting at GLC are likely responsible for its higher floral and faunal diversity. Early in the GLC record, there were few conifers and abundant wetland species, including willow, mosses, and sedges. Most of the insects, including beetles, are aquatic and semiaquatic; no bark beetles are present. In contrast, GLS assemblages contain three species of cold-adapted bark beetles, open boreal plants, and abundant arid subalpine tree macrofossils (Supplementary Material 4).
The temperate forest, montane, subalpine (boreal), and alpine (subarctic) species in the Skagit assemblages are found today at different latitudes, elevations, and distances from the moderating influence of the Pacific Ocean. Several of the assemblages contain temperate forest species and open boreal shrubs, mosses, and beetles. Full-glacial plant communities in the Pacific Northwest typically do not have modern analogs (Heusser, Reference Heusser1974, Reference Heusser1977; Barnosky, Reference Barnosky1981; Whitlock, Reference Whitlock1992; Lian et al., Reference Lian, Mathewes and Hicock2001).
Thousands of macrofossils of Engelmann spruce, whitebark pine, and subalpine fir dominate the Skagit Valley assemblages. They record a dry subalpine forest biome in a cold, dry continental climate during the LGM (Table 1). These trees currently grow near the tree line at elevations 1200 m above the GLS beds on the east side of the valley and at lower elevations near the heads of dry cold valleys (Arno and Hammerly, Reference Arno and Hammerly1984).
Assemblages from both glacial lakes provide clear evidence of open boreal (subalpine) conditions at various times. Cold-adapted species present in the Skagit Valley assemblages include alpine pondweed, dwarf birch, black crowberry heath, northern spikemoss, the ground beetle E. clairvillei, and the rove beetles O. boreale and E. tenue (Table 1; Supplementary Material 4). All of these species are common today in boreal forests and at higher elevations in the Rocky Mountains (Campbell, Reference Campbell1984; Ashworth et al., Reference Ashworth, Thackray, Gavin, Waitt, Thackray and Gillespie2021). Olophrum boreale, O. consimile, and E. clairvillei were found in Late Pleistocene beds at Kalaloch on Olympic Peninsula and in Seattle (Cong and Ashworth, Reference Cong and Ashworth1996; Ashworth and Nelson, Reference Ashworth and Nelson2014; Ashworth et al., Reference Ashworth, Thackray, Gavin, Waitt, Thackray and Gillespie2021).
Northern spikemoss megaspores are abundant in the early part of the GLC record. One liter of sediment dated at 22.7 cal ka BP yielded 462 megaspores (Fig. 6; Supplementary Material 2 and 3). Northern spikemoss is typically associated with open nonarboreal environments and requires a cool stable habitat and a high water table (Heusser and Peteet, Reference Heusser and Peteet1988; Heusser and Igarashi, Reference Heusser and Igarashi1994). Western Washington is currently outside its range (Heusser and Peteet, Reference Heusser and Peteet1988), but northern spikemoss occurs on northern Vancouver Island and in coastal British Columbia and Alaska (Heusser and Igarashi, Reference Heusser and Igarashi1994). It also is present in the Rocky Mountains of Idaho, Wyoming, and Montana, where it grows above 2085 m asl in association with willow thickets in open meadows and along ponds and streams (Scoggan, Reference Scoggan1978). Heusser and Igarashi (Reference Heusser and Igarashi1994) noted that its range expanded well inland during the LGM, and its presence at GLC shows that it was at least 350 km south and 150 km inland of the nearest modern population (Heusser and Peteet, Reference Heusser and Peteet1988). It has also been found in Port Moody interstadial sediments in the Fraser Lowland (Lian et al., Reference Lian, Mathewes and Hicock2001; Fig. 1) and in Late Pleistocene lake and bog cores on the western Olympic Peninsula (Heusser and Igarashi, Reference Heusser and Igarashi1994).
Dwarf birch and black crowberry heath are boreal-arctic species, and their presence in the GLS assemblages indicates that forest was discontinuous (Birks and Birks, Reference Birks and Birks2014). Both tolerate extreme winter cold but are intolerant of warm summers. Dwarf birch is found today mainly north of 60° latitude at wet sites but, like northern spikemoss, extends south in alpine zones along the Rocky Mountains into British Columbia and Alberta (Thompson et al., Reference Thompson, Anderson, Pelltier, Strickland, Shafer, Bartlein and McFadden2015). The presence of abundant sedge achenes in most assemblages supports the conclusion that an open subalpine biome existed at lower elevations in Skagit Valley during the LGM.
Fluctuations in precipitation and temperature over the life of the glacial lakes led to repeated introductions of species adapted to different climates. Indicator species in the Skagit assemblages include those that favor drier (whitebark pine) or wetter (mountain hemlock) subalpine conditions, an open boreal/alpine climate (northern spikemoss, dwarf birch, heath), or a warmer temperate forest climate (Douglas-fir/western hemlock, grand fir, Sitka spruce) (Fig. 6).
The presence of mountain hemlock macrofossils in the 25.9 and 24.4 cal ka BP assemblages at GLS suggests that climate was relatively wet at these times (Fig. 7). Mountain hemlock is sensitive to drought (Minore, Reference Minore1979) and requires an insulating snow cover that persists for at least 3 months to prevent its roots from freezing (Krajina, Reference Krajina1970; Wardle, Reference Wardle, Ives and Barry1974; Franklin and Dyrness, Reference Franklin and Dyrness1988). Increases in mountain hemlock pollen and macrofossils have been used as indicators of a shift to a wetter climate in this region in previous studies (Barnosky, Reference Barnosky1984; Mathewes, Reference Mathewes1993; Lian et al., Reference Lian, Mathewes and Hicock2001; Grigg and Whitlock, Reference Grigg and Whitlock2002; Herring et al., Reference Herring, Gavin, Dobrowski, Fernandez and Hu2017).
Macrofossils of temperate forest species occur throughout the Skagit record but are not abundant (Fig. 6). The possible presence of Sitka spruce macrofossils in the Skagit assemblages 100 km inland from the Late Pleistocene Pacific coast is interesting. Sitka spruce can interbreed with Engelmann spruce where their ranges overlap (Farrar, Reference Farrar1995), and there is some difficulty in distinguishing needles of the two species (Supplementary Material 1). It is not tolerant of shade, has a moderate tolerance to frost, and prefers a hyper-maritime climate and nitrogen-rich soils (Franklin and Dyrness, Reference Franklin and Dyrness1988; Peterson et al., Reference Peterson, Peterson, Weetman and Martin1997). Its presence in upper Skagit Valley during the LGM may not be unusual because of the valley's low elevation and favorable microclimate along lakeshores. Sitka spruce is found today in lower Skagit and adjacent Fraser valleys (Krajina et al., Reference Krajina, Klinka and Worrall1982; Fig. 1). It occurs up to 1500 m asl in southwest British Columbia, and in the north its range expands inland 200 km along major river corridors (Sudworth, Reference Sudworth1967; Peterson et al., Reference Peterson, Peterson, Weetman and Martin1997). In drier and colder climates, it occupies sites with high available soil moisture, such as floodplains and lake shorelines (Peterson et al., Reference Peterson, Peterson, Weetman and Martin1997). Considering these habitat requirements, Sitka spruce and northern spikemoss likely took advantage of the stable lake shoreline microclimates with moderated temperatures and higher soil moisture availability.
A few needles of noble fir (Abies procera) were found in the 25.9 and 24.4 cal ka BP warm assemblages at GLS (Fig. 6). This species is currently not found in the Skagit watershed but appears to have enjoyed a wider distribution during the LGM. Noble fir was likely extirpated from Skagit Valley during the ice sheet phase of glaciation that followed the LGM after 19 cal ka BP (Riedel, Reference Riedel2017).
Port Moody interstadial sediments in western Fraser Lowland include many of the same species as the Skagit Valley sediments, including Engelmann spruce, subalpine fir, bark and rove beetles, moss and leaf litter beetles, ground beetles, and weevils. Miller et al. (Reference Miller, Morgan and Hicock1985) interpreted the Port Moody assemblage to be an open forest community near the tree line. At times during the LGM, the continental climate and subalpine/alpine biome extended across much of the Puget and Fraser Lowlands (Hansen and Easterbrook, Reference Hansen and Easterbrook1974; Barnosky, Reference Barnosky1981, Reference Barnosky1984; Hicock et al., Reference Hicock, Hebda and Armstrong1982; Miller et al., Reference Miller, Morgan and Hicock1985; Barnosky et al., Reference Barnosky, Anderson, Bartlein, Ruddiman and Wright1987; Mathewes, Reference Mathewes1991; Lian et al., Reference Lian, Mathewes and Hicock2001; Grigg and Whitlock, Reference Grigg and Whitlock2002; Ashworth and Nelson, Reference Ashworth and Nelson2014). The Skagit macrofossil assemblages confirm that this biome extended 100 km inland along unglaciated parts of the Skagit Valley floor during much of the LGM. Our data suggest that this biome likely extended into other mountain valleys not occupied by glaciers in the Cascade and southern Coast Mountains (Lian et al. Reference Lian, Mathewes and Hicock2001; Telka et al., Reference Telka, Ward and Mathewes2003).
The Skagit macrofossil record and climate reconstructions have important differences from those on Olympic Peninsula (Fig. 1). In general, the Olympic coastal pollen, beetle, and macrofossil records depict a wet subalpine (parkland) forest biome (Heusser, Reference Heusser1972, Reference Heusser and Porter1983; Ashworth et al., Reference Ashworth, Thackray, Gavin, Waitt, Thackray and Gillespie2021). In contrast, the Skagit LGM record, with abundant arid tree line species (whitebark pine and Engelmann spruce), indicates a drier subalpine biome like that in the Fraser and Puget–Willamette Lowlands.
LGM climate
The PDF results identified four broad patterns of climate change in the North Cascades during the LGM: (1) large decreases in precipitation and air temperature that were more pronounced in the west than the east (Figs. 5 and 7; Table 3); (2) a reduction of the steep climate gradient observed today; (3) a colder and drier trend from 25.9 to 21.7 cal ka BP (Fig. 7); and (4) millennial-scale variability in MAP and January air temperature (Fig. 7).
Our PDF estimates of air temperature during the LGM are comparable to regional pollen-based estimates. Our estimates of the change in median July temperature from today are 6.3 ± 1.5°C at GLS and 4.2 ± 2.1°C at GLC. Heusser (Reference Heusser1972) estimated that mean July temperature was 5°C to 6.5°C cooler than at present on the Olympic coast. Whitlock (Reference Whitlock1992) suggested that mean annual temperature was 5°C to 7°C lower than at present at Battleground Lake in southern Washington between approximately 23.7 and 19.8 cal ka BP. Similarly, Barnosky (Reference Barnosky1981) inferred a reduction in mean annual temperature of 7°C during the same period at Davis Lake in southern Puget Lowland. Bartlein et al. (Reference Bartlein, Harrison, Brewer, Connor, Davis, Gajewski and Guiot2011) estimated that mean annual air temperature in this region at 21 cal ka BP was more than 8°C lower than today. Global mean cooling at this time was 3°C to 5°C, with a Pacific Northwest air temperature 4°C to 8°C lower than today (Annan and Hargreaves, Reference Annan and Hargreaves2013). Our PDF estimate of the median value of annual temperature change (average of July and January estimates in Table 3) is about 7°C at GLC and 6°C at GLS.
January air temperature changed more than July air temperature at GLC, whereas the change between January and July temperatures at GLS was of the same magnitude (Fig. 7; Table 3). Bartlein et al. (Reference Bartlein, Harrison, Brewer, Connor, Davis, Gajewski and Guiot2011) found that Late Pleistocene changes in winter temperature in North America were greater than summer temperature changes, a conclusion supported by Ashworth et al. (Reference Ashworth, Thackray, Gavin, Waitt, Thackray and Gillespie2021) on the Olympic Peninsula. We infer that a reduced marine influence on climate in western Skagit Valley during the LGM led to the relatively large 10°C change in winter air temperature at GLC. Air temperature changes were less pronounced at GLS, where the climate is more continental due to its location 75 km farther inland from the waters of Puget Sound.
Paleoclimate studies west and south of Skagit Valley have shown that MAP during the LGM was lower than today (Heusser, Reference Heusser1977; Barnosky, Reference Barnosky1985; Grigg and Whitlock, Reference Grigg and Whitlock2002; Marshall et al., Reference Marshall, Pollard, Hostettler, Clark, Gillespie, Porter and Atwater2004; Bartlein et al., Reference Bartlein, Harrison, Brewer, Connor, Davis, Gajewski and Guiot2011). A summary of regional pollen data by Bartlein et al. (Reference Bartlein, Harrison, Brewer, Connor, Davis, Gajewski and Guiot2011) led to an estimate of MAP 250–500 mm lower than today at 21.0 cal ka BP. Our estimates confirm regional aridity, with an average of 835 mm lower MAP at GLC and 100 mm lower at GLS (Fig. 7; Table 3). These results generally agree with Paleoclimate Modelling Intercomparison Project 3 data that predict a decrease of 700 mm/yr in the Pacific Northwest during the LGM (Braconnot et al., Reference Braconnot, Harrison, Kageyama, Bartlein, Masson-Delmotte, Abe-Ouchi, Otto-Bliesner and Zhao2012).
The results of our study indicate that the strong modern precipitation gradient observed today within Skagit Valley did not exist during the LGM. The greater reduction in precipitation at GLC (50%) compared with GLS (10%) means that climate was essentially the same at the two sites. The Skagit record stands in contrast to that on Olympic Peninsula, where climate gradients steepened during the LGM (Porter, Reference Porter1964; Ashworth et al. Reference Ashworth, Thackray, Gavin, Waitt, Thackray and Gillespie2021).
Skagit Valley and the surrounding region were more arid during the LGM than today for at least two reasons. First, Pacific Ocean sea-surface temperatures were 4°C colder than today (Annan and Hargreaves, Reference Annan and Hargreaves2013), significantly reducing evaporation. Second, a more arid climate resulted from growth of continental ice sheets in Canada and their influence on atmospheric circulation (Braconnot et al., Reference Braconnot, Harrison, Kageyama, Bartlein, Masson-Delmotte, Abe-Ouchi, Otto-Bliesner and Zhao2012). Development of the Laurentide high pressure system over the ice sheet accelerated and steered the jet stream and storms to the south (Oster et al., Reference Oster, Ibarra, Winnick and Maher2015). This led to a rise in pluvial lake levels in California and Nevada (Benson et al., Reference Benson, Lund, Negrini, Linsley and Zic2003) and decreased precipitation in the Pacific Northwest (Barnosky et al., Reference Barnosky, Anderson, Bartlein, Ruddiman and Wright1987; Thompson et al., Reference Thompson, Whitlock, Bartlein, Harrison, Spaulding, Wright, Kutzbach, Webb, Ruddiman, Street-Parrot and Bartlein1993; Hostetler and Clark, Reference Hostetler and Clark1997; Bartlein et al. Reference Bartlein, Anderson, Anderson, Edwards, Mock, Thompson, Webb and Whitlock1998; Lian et al., Reference Lian, Mathewes and Hicock2001; Thackray, Reference Thackray2001; Grigg and Whitlock, Reference Grigg and Whitlock2002; Jiménez-Moreno et al., Reference Jiménez-Moreno, Anderson, Desprat, Grigg, Grimm, Heusser, Jacobs, Lopez-Martinez, Whitlock and Willard2010; Oster et al., Reference Oster, Ibarra, Winnick and Maher2015).
Millennial-scale climate fluctuations
The PDF results reveal positive anomalies in the median values of three climate indices over the 8000-yr period of the record (Fig. 7; Table 3), due in part to the presence of temperate forest species (Figs. 5 and 6). Identification of significant changes is limited by the high variability in the PDF results resulting from the low number of species in some assemblages, and most changes are within the interquartile ranges of one another. Climate variability is expressed mainly as changes in January air temperature and MAP (Fig. 7). Although these changes seem to be more pronounced before 23 cal ka BP, the number of species used in the latter part of the reconstruction is relatively low (Fig. 7). Regional pollen studies, northeast Pacific Ocean sediment cores, and glacial geology have confirmed the existence of millennial-scale climate variability in this region during the LGM (Behl and Kennet, Reference Behl and Kennet1996; Pisias et al., Reference Pisias, Mix and Heusser2001; Thackray, Reference Thackray2001; Grigg and Whitlock, Reference Grigg and Whitlock2002; Jiménez-Moreno et al., Reference Jiménez-Moreno, Anderson, Desprat, Grigg, Grimm, Heusser, Jacobs, Lopez-Martinez, Whitlock and Willard2010; Riedel et al., Reference Riedel, Clague and Ward2010; Taylor et al., Reference Taylor, Hendy and Pak2015).
The PDF results indicate that winters were warmer and climate overall wetter at 27.7, 25.9, and 24.4 cal ka BP at GLS, and from 21.2 until at least 20.7 cal ka BP at GLC. The magnitude of the changes are ±200 mm in MAP and ±2°C to +4°C in January air temperature (Fig. 7). The results for the 25.9, 24.4, and 21.2–20.7 cal ka BP assemblages are robust, because they contain a relatively high number of species for the PDF analysis and they have high assemblage diversity, with 24, 25, and 30–39 species, respectively (Table 2).
The PDF-based climate estimate for the 27.7 cal ka BP GLS assemblage is based on only three species, including needles of western hemlock/Douglas-fir and mountain hemlock (Fig. 6). Sediment cores from the Santa Barbara Basin provide evidence for a warm period at this time, based on increased bioturbation (Hendy and Kennet, Reference Hendy and Kennet2000). Hebda et al. (Reference Hebda, Lian and Hicock2016) documented a decline in nonarboreal pollen and spikes in arboreal pollen, including mountain hemlock and pine, at Lynn Valley in southwestern British Columbia at about the same time as our 27.7 cal ka BP assemblage. Grigg et al. (Reference Grigg, Whitlock and Dean2001) showed that western hemlock pollen increased at Little Lake, Oregon, at about the same time, and Marshall et al. (Reference Marshall, Roering, Gavin and Grangers2017) documented peaks in Sitka spruce and subalpine fir needles at ca. 28 cal ka BP at the same site.
There is also regional evidence of warmer climate in the Pacific Northwest at approximately 25.9 cal ka BP, although limited age control precludes further correlations. Marshall et al. (Reference Marshall, Roering, Gavin and Grangers2017) identified a peak in silver/grand fir, Sitka spruce, and mountain hemlock macrofossils at 25.4 cal ka BP at Little Lake in west-central Oregon; and Grigg et al. (Reference Grigg, Whitlock and Dean2001) documented a peak in western hemlock and pine pollen at 25.8 cal ka BP in Fargher Lake (Figs. 1 and 8).
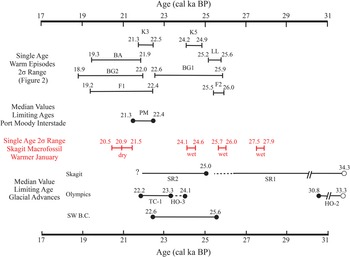
Comparison of calibrated radiocarbon ages for key glacial and biological events during the last glacial maximum, including pollen boundaries (same data sources as for Fig. 2) and alpine glacial advances: Hoh Oxbow 3 and Twin Creek 1 (Thackray, Reference Thackray2001), Skagit River 1 and 2 (Riedel et al., Reference Riedel, Clague and Ward2010), and Coquitlam (Hicock and Armstrong, Reference Hicock and Armstrong1981). All ages have been calibrated with the OxCal online program (Bronk Ramsay, Reference Bronk Ramsay2009).

Climate was colder at GLS between 25.9 and 24.4 cal ka BP (Fig. 7). The 25.1 cal ka BP assemblage includes several open boreal alpine species, including the two boreal rove beetles discussed earlier, dwarf birch, black crowberry heath, and sedge. Sites from the Fraser Lowland to the western Olympic Peninsula and southern Washington show a change toward colder and drier conditions at about 25.0 cal ka BP, although the limiting ages have large errors (Fig. 8).
A relatively warm wet period at 24.4 cal ka BP is expressed by a diverse assemblage at GLS that includes temperate forest species (Figs. 6 and 7). Marshall et al. (Reference Marshall, Roering, Gavin and Grangers2017) identified a minor peak in temperate forest macrofossils at 24 cal ka BP at Little Lake (Fig. 1). The K5 warm event at Kalaloch occurred at 24.5 cal ka BP (Ashworth et al. Reference Ashworth, Thackray, Gavin, Waitt, Thackray and Gillespie2021), and a minor peak in mountain hemlock pollen was recorded at Bogachiel Bog at 24.2 cal ka BP (Heusser, Reference Heusser1978).
Climate became colder and drier again at GLS sometime after 24.4 cal ka BP, and by 23.5 cal ka BP, a cold climate is evident at GLC, with the lowest January and July temperature in our reconstruction (Table 3; Fig. 7). Temperatures likely declined during this part of the LGM with the decrease in summer insolation at this latitude and the growth of the ice sheets in the Northern Hemisphere (Berger, Reference Berger1978).
The Skagit record has a gap between 23.5 and 22.7 cal ka BP. Grigg and Whitlock (Reference Grigg and Whitlock2002) identified small increases in mountain hemlock and pine pollen at Fargher Lake between about 23.0 and 21.5 cal ka BP (Fig. 1). The 22.7 cal ka BP assemblage at GLC contains no temperate forest macrofossils and is dominated by 462 northern spikemoss megaspores and sedge achenes that are robust indicators of open boreal conditions. The 21.8 cal ka BP assemblage at GLS consists mainly of subalpine tree macrofossils. Nonarboreal taxa dominate pollen assemblages on western Olympic Peninsula (Heusser, Reference Heusser1974) and in southern Puget Lowland at this time (Barnosky, Reference Barnosky1981; Barnosky et al., Reference Barnosky, Anderson, Bartlein, Ruddiman and Wright1987; Fig. 8). At the K2 site near Kalaloch, Ashworth et al. (Reference Ashworth, Thackray, Gavin, Waitt, Thackray and Gillespie2021) recovered an insect assemblage indicative of cooling at 21.7 cal ka BP. Thackray (Reference Thackray2001) suggested that this interval was the coldest part of MIS 2 (ca. 30–11.6 ka). Syntheses of global sea-surface temperature data have placed a narrower limit on the LGM at 22.3–19.0 cal ka BP (MARGO Project Members, 2009).
The 21.2 and 20.7 cal ka BP assemblages in lower Skagit valley are the most diverse in the record (Fig. 6; Supplementary Material 2 and 3). These assemblages include temperate forest species western hemlock/Douglas-fir, grand/silver fir, and possibly Sitka spruce that indicate climate warming (Fig. 6).
The two limiting ages for the Port Moody interstade in Fraser Lowland have a combined 2σ age range of 22.4–21.3 cal ka BP (our calibration; Hicock et al., Reference Hicock, Hebda and Armstrong1982, 1999; Hicock and Lian, Reference Hicock and Lian1995; Fig. 8). We tentatively correlate this event to the taxonomically diverse 21.2 and 20.7 cal ka BP GLC assemblages, as the 2σ range for the older Skagit assemblage is 21.5–20.9 cal ka BP (Fig. 8; Supplementary Material 5).
Large errors in the ages of pollen zone boundaries in other studies limit correlation with the noncontinuous Skagit record near the end of the LGM (Figs. 2 and 8). Four other sites in the Pacific Northwest record an increase in tree pollen and an associated decrease in nonarboreal pollen at about 20.7 cal ka BP (Figs. 1 and 2). They include Fargher Lake at 20.7 cal ka BP (Heusser and Heusser, Reference Heusser and Heusser1980) and at Bogachiel Bog at about 20.4 cal ka BP (Heusser, Reference Heusser1978; Figs. 2 and 8). Western hemlock pollen increased after about 21.8 cal ka BP at Kalaloch (Heusser, Reference Heusser1977). Barnosky (Reference Barnosky1985) inferred an interstadial warm period between approximately 20.9 and 18.9 cal ka BP at Battleground Lake, and there is evidence of warming at this time at Carp and Little lakes (Grigg and Whitlock, Reference Grigg and Whitlock2002; Figs. 2 and 8).
Macrofossils are scarce in GLC assemblage at 19.8 cal ka BP. The age of this bed is derived from a single Engelmann spruce cone recovered below advance outwash from the ice sheet (Fig. 4). The ice sheet advanced from Puget Lowland into lower Skagit Valley sometime after 19.4 cal ka BP and reached its maximum extent at about 16.3 cal ka BP (Porter and Swanson, Reference Porter and Swanson1998; Troost, Reference Troost2016; Riedel, Reference Riedel2017; Fig. 1).
Correlation with the alpine glacial record
The Skagit macrofossil and regional paleoenvironmental records are generally in accord with the fragmentary alpine glacial record in the Pacific Northwest. Our PDF analysis indicates that there were two relatively cold intervals, the first at ca. 25.1 cal ka BP (GLS) and a second at 23.5–21.2 cal ka BP (GLC) (Figs. 7 and 8). The times of these cold periods broadly correspond with alpine glacier advances in the region (Fig. 8; Supplementary Material 5). Skagit Valley alpine glaciers advanced at least twice during the LGM, first between 34.3 and 25 ka, and later sometime after 25 ka, at which time they achieved their maximum late glacial extent (Riedel et al., Reference Riedel, Clague and Ward2010). Our results provide a refinement of that chronology, as they indicate that the earlier advance may have ended before 25.9 ka, and the later advance may have begun after the 24.4 cal ka BP warm-wet period. The Coquitlam advance in south-coastal British Columbia occurred after about 25.6 cal ka BP (Hicock and Armstrong, Reference Hicock and Armstrong1981; Riedel et al., Reference Riedel, Clague and Ward2010; Fig. 8). The Hoh Oxbow 3 glacier advance on western Olympic Peninsula occurred after 24.1 ka, and the Twin Creek 1 advance in the same area has been dated to about 23.3–22.2 ka (Thackray, Reference Thackray2001).
Clark and Bartlein (Reference Clark and Bartlein1995), Hicock et al. (Reference Hicock, Lian and Mathewes1999), and Thackray (Reference Thackray2001) concluded that millennial-scale climate oscillations controlled the advance and retreat of glaciers, respectively, in the western United States, Fraser Lowland, and on western Olympic Peninsula. Hostetler and Clark (Reference Hostetler and Clark1997) concluded that changes in air temperature were primarily responsible for the advance and retreat of alpine glaciers in the Yellowstone area and in Idaho. Thackray (Reference Thackray2008) suggested that glaciers farther west were influenced more by precipitation than temperature. Our PDF results indicate that MAP fluctuated by ±200 mm early in the Skagit record (Fig. 7). These changes may have controlled the mass balance of Skagit alpine glaciers, because the climate was relatively arid and summer air temperatures changed little (Fig. 7). Modern mass balance data suggest that alpine glaciers on the more arid eastern flank of the North Cascades are more sensitive to changes in precipitation than temperature (Riedel and Larrabee, Reference Riedel and Larrabee2016). The lack of a more accurate glacial chronology hinders further comparisons.
Correlation with the Greenland ice core record
Regional alpine glacial advances in the Pacific Northwest and changes in sea-surface temperatures and pollen have been compared with the North Atlantic record of climate (Clark and Bartlein, Reference Clark and Bartlein1995; Hicock et al., Reference Hicock, Lian and Mathewes1999; Hendy and Kennett, Reference Hendy and Kennet2000; Pisias et al., Reference Pisias, Mix and Heusser2001; Grigg and Whitlock, Reference Grigg and Whitlock2002; Jiménez-Moreno et al., Reference Jiménez-Moreno, Anderson, Desprat, Grigg, Grimm, Heusser, Jacobs, Lopez-Martinez, Whitlock and Willard2010). Changes in oxygen isotope composition in Greenland ice cores provide a continuous, high-resolution record of millennial-scale oscillations in climate in the North Atlantic, known as Dansgaard–Oeschger (D-O) cycles (Dansgaard et al., Reference Dansgaard, Jonhsen, Clauson, Dahl-Jensen, Gundestrup, Hammer, Hvidberg, Steffensen, Sveinbjornsdottir and Jouzel1993). D-O cycles, which occurred about every 1400 yr during the last glacial cycle, are marked by abrupt initial warming (interstade) and subsequent long slow cooling (Fig. 7). Jiménez-Moreno et al. (Reference Jiménez-Moreno, Anderson, Desprat, Grigg, Grimm, Heusser, Jacobs, Lopez-Martinez, Whitlock and Willard2010) suggested that the Greenland interstades (GI) were marked by a warm-wet climate in North America, while stades (GS) were cold and dry. Another feature of the LGM climate in the North Atlantic is Heinrich events, which are associated with increases in the discharge of icebergs and cold water from the Laurentide ice sheet (Heinrich, Reference Heinrich1988; Bond et al., Reference Bond, Broecker, Johnsen, McManus, Lagey-Rie, Jouzel and Bonani1993).
Warm-wet winters in the Skagit macrofossil record and alpine glacier activity generally correlate with millennial-scale climate variability in the North Atlantic (Fig. 7). Greenland interstade GI3 occurred at about the same time as the Skagit 27.7 cal ka BP warm-wet period (Svensson et al., Reference Svensson, Andersen, Bigler, Clausen, Dahl-Jensen, Davies, Johnsen and Muscheler2008; INTIMATE Project Members, 2014; Fig. 7). Regional alpine glacial advances in the Pacific Northwest broadly coincide with stades GS3 and GS2 (Hicock et al., Reference Hicock, Lian and Mathewes1999; Thackray, Reference Thackray2001; Riedel et al., Reference Riedel, Clague and Ward2010). The only Heinrich event that occurred during the period of the Skagit macrofossil record is H2 (26.5–24.3 cal ka BP). This event coincides with the end of GS3 (27.5–23.3 cal ka BP; Fig. 7). Warm-wet periods at 25.9 and 24.4 cal ka BP in the Skagit record were separated by a cold period that may correspond to H2. The late LGM warm period in the Pacific Northwest, observed in the Skagit record at 21.2–20.7 cal ka BP, occurred during GS2 (Figs. 7 and 8). Although not correlated with named interstades in the ice core record, all three of the later warm-wet winter Skagit events generally coincide with smaller peaks in the North Greenland Ice Core Project record (Fig 7).
The gap in the Skagit record from 23.5 to 22.7 cal ka BP spans Greenland interstades GI2.1 (23.2 cal ka BP) and GI2.2 (23.0 cal ka BP) (INTIMATE Project Members, 2014; Fig. 7). Other regional paleoenvironmental warm periods may correlate with these interstades. Grigg and Whitlock (Reference Grigg and Whitlock2002) identified increases in mountain hemlock pollen at 23.0 cal ka BP, followed by an increase in arboreal pollen until 21.0 cal ka BP at Fargher Lake. Hicock and Lian (Reference Hicock and Lian1995) and Lian et al. (Reference Lian, Mathewes and Hicock2001) reported median maximum limiting dates of 22.9 and 22.4 cal ka BP for the beginning of the Port Moody interstade in the lower Fraser Valley (Figs. 2 and 8). The overlap in many of the dates from this region precludes more definitive correlation of these late LGM events with GI2.1 and GI2.2.
Causes of millennial-scale climate changes
A long, gradual cooling and drying trend during the LGM is evident in the Skagit macrofossil record (Fig. 7). Superimposed on this orbital-scale change are millennial-scale changes in climate in Skagit Valley expressed as increases in winter air temperature (+2°C to +4°C) and MAP (+200 mm). Millennial-scale climate variability occurred across western North America and is thought to be related to changes in the Atlantic Meridional Overturning Circulation and its influence on global heat transfer (Harrison and Sanchez Goni, Reference Harrison and Sanchez Goni2010). In the northeast Pacific region, the fast response of marine and terrestrial proxies to D-O events indicates that changes in atmospheric circulation may have been responsible for transmission of millennial-scale variability from the North Atlantic (Hendy and Kennet, Reference Hendy and Kennet2000; Taylor et al. Reference Taylor, Hendy and Pak2015). Recent model simulations indicate that the locations and strengths of the Aleutian Low, the Laurentide ice sheet High, and the North Pacific High controlled the latitude of the westerly jet stream and delivery of moisture to western North America during the LGM (Oster et al., Reference Oster, Ibarra, Winnick and Maher2015). One potential mechanism for transmission of millennial-scale changes in climate from the North Atlantic to the North Pacific may have been the Intertropical Convergence Zone (ITCZ) and its influence on advection of warm tropical water north via the California Underwater Current, the location of the westerly jet stream, and the strength and position of semipermanent pressure systems in the northeast Pacific (Zhang and Delworth, Reference Zhang and Delworth2005; Leduc et al., Reference Leduc, Vidal, Tachikawa and Bard2009; Deplazes et al., Reference Deplazes, Lückge, Peterson, Timmermann, Hamann, Hughen and Röhl2013; Okumura et al., Reference Okumura, Deser, Hu, Timmermann and Xie2009; Taylor et al., Reference Taylor, Hendy and Pak2015; Oster et al., Reference Oster, Ibarra, Winnick and Maher2015). During cold D-O phases in the North Atlantic, the ITCZ and westerly jet stream shifted south, leaving the northeast Pacific drier. Warm D-O events shifted the ITCZ and the jet stream northward, producing wetter conditions in the Pacific Northwest, including Skagit Valley.
CONCLUSIONS
Skagit Valley macrofossil assemblages provide a rare glimpse into the climate and ecology in the North Cascade Range at the LGM. Large parts of the valley floor were refugia for 8000 yr before invasion by the Cordilleran ice sheet. Macrofossil-bearing glacial lake beds survived subsequent ice sheet glaciation in gullies protected by valley bedrock spurs and beneath thick interlobate deposits.
The Skagit refugia were an extension of an arid boreal (subalpine) forest biome that at times included temperate forest and alpine tundra species. This biome extended from southern Puget Lowland northward to the western Fraser Lowland and as far as 150 km into unglaciated parts of Skagit Valley. Like many ice age communities, those in Skagit Valley included a mix of species found today at a wide range of elevations and latitudes. The GLC refugium hosted a more diverse community than the GLS refugium, likely because it was 400 m lower in elevation.
The PDF method is an effective tool for quantifying climate change based on the presence of macrofossils. Our PDF results are consistent with previous estimates of climate change in this region at the LGM, even though our analysis was limited by a small number of species in 5 of the 12 assemblages.
Our results indicate a 10% to 50% decrease in MAP during the LGM. January air temperatures changed more than summer temperatures at both glacial lakes, with a 6°C to 10°C reduction in January temperatures and a 4°C to 6°C decrease in July temperatures (Fig. 7). Winter temperature and MAP changes are larger at GLC, where the modern climate is maritime, whereas summer temperature change is larger at GLS, where the modern climate is continental.
The larger decreases in MAP and air temperature in lower Skagit Valley compared with the upper valley meant that the strong climate gradient observed today between the two sites was eliminated during the LGM. This contrasts with the steepened climate gradients during the LGM on Olympic Peninsula.
Ten calibrated radiocarbon ages on the Skagit Valley macrofossil assemblages provide a chronology for the terrestrial responses to millennial-scale changes in climate in this region. These changes are expressed as increases in January air temperature (+2°C to +4°C) and MAP (+200 mm) in individual assemblages dated at 27.7, 25.9, 24.4, and 21.2–20.7 cal ka BP.
Future work on the Skagit sections may include pollen analysis and detailed examination of other taxa, such as chironomids and coleopterans, which have already been extracted from the lake beds. The macrofossils from the Skagit Valley assemblages are also a potential source of genetic material for phylogeography studies.
Supplementary Material
The supplementary material for this article can be found at https://doi.org/10.1017/qua.2021.50.
Acknowledgments
This research was made possible with the help of many people. Linda Brubaker and Alecia Spooner at the University of Washington identified conifer needles. Allan Ashworth at the University of North Dakota provided critical assistance with the beetles. We are grateful to Norbert Kühl for making his code for the PDF modeling available to us. Sharon Sarrantonio prepared several of the figures and Emma Riedel much of the Supplementary Material. We appreciate the constructive advice of two anonymous reviewers and the editors of Quaternary Research, which greatly improved this paper. Alice Telka, a coauthor of this paper, passed away while the paper was being prepared for publication. We dedicate this paper in memory of Alice and her major contributions to Quaternary paleoecology in North America. Once this paper is published, we intend to send the data from this research to the Neotoma public data repository (Williams et al., Reference Williams, Grimm, Blois, Charles, Davis, Goring and Graham2018).
Financial Support
Financial support was provided by the U.S. National Park Service, a grant to JLR from the Skagit Environmental Endowment Commission, and Natural Sciences and Engineering Research Council and Shrum (Simon Fraser University) grants to JJC.