Implications
Environmental and economic concerns regarding phosphorus in broiler production pledge a reduction in dietary P provision. However, to maintain growth performance and bone mineralisation, optimisation of P utilisation appears crucial. In this context, the present meta-analysis proposes a quantitative evaluation of the influence of dietary Ca and microbial phytase supply on broiler response to dietary P. The relationship established in this work will represent a useful tool to fine-tune dietary P and Ca supply in diets supplemented with phytase.
Introduction
In broilers, phosphorus (P) is involved in many essential functions, representing a key element in the maintenance of growth performance and bone mineralisation (Underwood and Suttle, Reference Underwood and Suttle1999). Thus, it must be of major concern that current economic and environmental pressures leading to an unavoidable decrease in dietary P supply represent a threat to animal productivity. This means that the impact of the main factors of variation of the diet, such as calcium (Ca) and microbial phytase, which affect P utilisation in broilers, needs to be evaluated. The role of Ca is contrasted since it has a deleterious digestive effect on P utilisation (Waldroup et al., Reference Waldroup, Ammerman and Harms1963; Nelson et al., Reference Nelson, Hargus, Storer and Walker1965), but remains essential for the deposition of P in bones. In addition, with the generalisation of the use of microbial phytase, an enzyme that releases P and can in turn be recognised as a reliable alternative source of P (Selle and Ravindran, Reference Selle and Ravindran2007), there is a consensus that a narrow Ca : P ratio should be considered to optimise enzyme efficiency (Sebastian et al., Reference Sebastian, Touchburn, Chavez and Lague1996; Qian et al., Reference Qian, Kornegay and Denbow1997). Nevertheless, this practice has been questioned by Driver et al. (Reference Driver, Pesti, Bakalli and Edwards2005), pointing out that P utilisation is a complex process depending on, among others, dietary P, Ca and microbial phytase. The good understanding of the animal’s response to dietary P in interaction with factors such as dietary calcium and microbial phytase is thus a prerequisite to address the current objective to reduce P released into the environment.
Meta-analysis is a relevant method to analyse complex phenomena and quantify relationships by taking into account previous studies (Sauvant et al., Reference Sauvant, Schmidely, Daudin and St-Pierre2008). Given the abundant literature dealing with dietary P utilisation in birds in relation to Ca and phytase supply as reviewed by Selle and Ravindran (Reference Selle and Ravindran2007), this statistical method was chosen to represent the complexity of P utilisation in birds. The objective of this work was thus to quantify the impact of Ca and phytase on the response of growth performance and bone mineralisation to dietary non-phytate phosphorus (NPP) in broilers.
Material and methods
Data collection
A database was compiled with studies published between 1995 and 2006, dealing with the effect of microbial phytase on P utilisation by broilers raised from 1 up to 21 or 22 days of age, and including the keywords ‘calcium’, ‘phosphorus’ and ‘phytase’. Inclusion into the database was decided on the basis of the reporting of both growth performance and tibia ash concentration for each treatment. Publications reporting several experiments were dealt with by assigning a specific code to each experiment. Each observation corresponded to the mean of one treatment group. At this stage, the few dietary treatments that contained sources of P from animal origin were discarded. The included diets are formulated to contain sufficient amounts of all nutrients other than P and Ca as well as vitamins. In addition, four publications were discarded from the database because of abnormally high or low growth performance compared to other birds of the same breed line in the database. This led to a database including 16 publications and 29 experiments.
The database was further refined by keeping only treatments focusing on 3-phytase feed enzyme derived from Aspergillus niger, which was the major source of phytase used in the retained experiments. Moreover, only experiments assessing the effect of phytase added in diets free of plant phytase were kept. As a consequence, all diets in the retained experiments were based on corn and soyabean meal. Finally, to remain consistent with dietary practical use, treatments containing more than 2000 FTU microbial phytase/kg diet were not considered. This resulted in a database of eight publications reporting 15 experiments, with a total of 203 treatments (Ntrt).
Calculations
To ensure overall consistency of the database, dietary total phosphorus (tP), phytate P (PP) and Ca concentrations in each experimental diet were estimated from the list of ingredients, based on the table of feedstuffs composition (Sauvant et al., Reference Sauvant, Perez and Tran2004). The calculations were made only on the phosphorus content of each source without any correction for their respective availability. These estimates were cross-checked with the measured total P and Ca values reported by the authors. Dietary non-phytate P (NPP) concentration was calculated as the difference between estimated dietary tP and PP concentrations. Dietary NPP represents NPP of plant origin and P from phosphates. In 96% of the experimental treatments, diets were supplemented with mineral P as dicalcium (85%), defluorinated (11%), monocalcium (3%) and potassium phosphates (1%). Analysed dietary phytase activity was reported for 16% of the diets supplemented with phytase. When reported, analysed values were considered to fit the models; otherwise, expected values were used. In addition, phytase activity was considered equal to zero when it was below the detection limit of 50 FTU/kg diet. One phytase unit (FTU) is the amount of enzyme that liberates 1 μmol of inorganic P from 5.1 mmol/l sodium phytate per minute at pH 5.5 at 37°C. This characterisation of diets provided the independent variables used in the statistical models: dietary PP, NPP and Ca concentrations (g/kg diet) and phytase activity (FTU/kg diet).
In most publications, growth performance indicators were body weight gain (BWG) and gain to feed ratio (G:F). When missing, feed intake (FI) was calculated as the ratio of BWG to G:F. Average daily gain (ADG) and average daily feed intake (ADFI) were then calculated by dividing BWG and FI by the trial duration in days. Tibia ash concentration at the end of the experiment was reported for all treatments. Finally, dependent variables used in the statistical models to assess P utilisation in broilers were: ADG (g/day), ADFI (g/day), G:F and tibia ash concentration (% dry matter, DM).
Meta-design
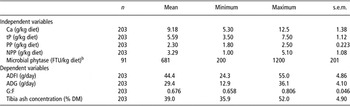
Descriptive statistics for each variable in the selected data set are reported in Table 1.
Descriptive statistics of the main variablesFootnote a

tP = total phosphorus; PP = phytate phosphorus; NPP = non-phytate phosphorus (tP–PP); ADFI = average daily feed intake; ADG = average daily gain; G:F = gain to feed; DM = dry matter; n = number of treatments.
a From Denbow et al. (Reference Denbow, Ravindran, Kornegay, Yi and Hulet1995), Mitchell and Edwards (Reference Mitchell and Edwards1996a and Reference Mitchell and Edwards1996b), Sebastian et al. (Reference Sebastian, Touchburn, Chavez and Lague1996), Waldroup et al. (Reference Waldroup, Kersey, Saleh, Fritts, Yan, Stilborn, Crum and Raboy2000), Yan et al. (Reference Yan, Fritts and Waldroup2003), Dilger et al. (Reference Dilger, Onyango, Sands and Adeola2004) and Pillai et al. (Reference Pillai, O’Connor-Dennie, Owens and Emmert2006).
b Dietary treatments that contained microbial phytase.
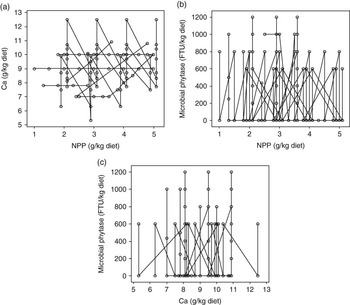
As all diets were based on corn and soyabean meal, dietary PP concentration was fairly constant (2.30 ± 0.22 g/kg diet) and thus could not be used as an independent variable. Dietary Ca, NPP and phytase were normally distributed. Particular attention was given to the meta-design while graphically examining the relationship between the independent variables taken two by two (Figure 1). In Figure 1, points are linked within the experiment allowing one to appreciate the extent of the variation into each experiment and also identifying any collinearity.
Meta-design: within-experiment relation between dietary (a) Ca and non-phytate P (NPP) concentrations, (b) microbial phytase and NPP concentration and (c) microbial phytase and Ca concentration (each point represents one treatment mean; points are linked within the experiment).

The meta-design was fairly well balanced. The correlations between dietary Ca and NPP concentrations (Pearson correlation, r = 0.19; P < 0.01), between dietary phytase activity and NPP concentration (Pearson correlation, r = −0.12; P = 0.08), and between dietary phytase activity and Ca concentration (Pearson correlation, r = −0.037; P > 0.10) are low, but some are significant. Therefore, the effect of these variables, as well as their interactions, on P utilisation by broilers could be adequately assessed from the current data set.
Statistical analyses
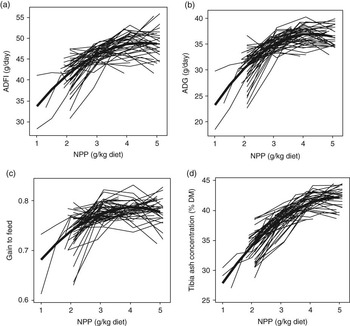
Data were analysed by means of the GLM procedure of Minitab (2007) or of SAS (2002). The experiment was introduced in the model as a fixed effect to ensure a proper prediction of coefficients of the model and an accurate description of the error of prediction (Sauvant et al., Reference Sauvant, Schmidely, Daudin and St-Pierre2008). Based on a graphical examination of the within-experiment response of each dependent variable (ADG, ADFI, G:F and tibia ash concentration) to the main covariate (dietary NPP) (Figure 2), a quadratic model was adjusted as follows:

where Yij is the value of the dependent variable Y in the experiment i with the level j of NPP, α is the overall intercept with the condition that the sum of the effect of each experiment αi is equal to 0, b 1 and b 2 are the linear and quadratic coefficients, respectively, of the overall response to dietary NPP and eij is the residual error.
One of the objectives of the current meta-analysis was to study the effect of dietary Ca and of phytase on the response of dependent variables to dietary NPP. These effects were investigated in two successive steps. The first step involved two subgroups of experiments that were extracted from the whole database to study the influence of Ca and phytase on the response of broilers to dietary NPP separately. In the Ca subgroup, only experiments in which NPP varied within at least two levels of dietary Ca were selected (NCaCatrt = 132). In the phytase subgroup (NPhyttrt = 155), only experiments in which NPP varied within at least two levels of phytase were selected. These selections resulted in two well-balanced meta-designs, which were used to test the effects of Ca and phytase on the intercept (α), and on the linear (b 1) and quadratic (b 2) components of the response of each dependent variable to dietary NPP separately (Equation 1). Owing to the well-established curvilinear response of the investigated dependent variables to phytase (Selle and Ravindran, Reference Selle and Ravindran2007), the term phytase × phytase and its interactions with NPP and NPP2 were also tested. In the second step, only terms that were detected as having a significant or a trend (P < 0.10) influence on NPP utilisation in the Ca and Phytase subgroups were tested on the entire database (Ntrt = 203). The overall model was then formed with the addition of the terms Ca × phytase, Ca × phytase × phytase and their interactions with NPP and NPP2. To quantify the effect of each covariate (dietary Ca, NPP and microbial phytase supply) for a given level of the other covariates on the criteria used to assess P utilisation, the partial derivatives of the obtained equation have been calculated for each explaining variable.
Evaluation of the obtained models was assessed by comparing predicted to experimental data. This was performed by means of a set of data not used in the adjustment of the models, mainly because growth performance and tibia ash concentration were not simultaneously reported or because one of the keywords ‘calcium’ or ‘phytase’ was missing. In this second set of data, broilers raised up to 21 or 23 days were given diets based on corn and soyabean meal, devoid of plant phytase, in which mineral P was provided as dicalcium phosphate in most of the cases in contrast to the first database where microbial phytase originated from sources other than Aspergillus niger in 55% of cases. The validation database gathered results from 17 publications reporting 28 experiments comprising 255 treatments for criteria of growth performance, and 23 experiments with 221 treatments for tibia ash concentration. To determine the overall tendency for the models to overestimate or underestimate observed values, the mean deviation (d) to the bisector (Y obs = Y pred) was calculated as the difference between the mean of observed (Y obs) and predicted (Y pred) values of each response variable. The comparison was then performed according to the procedure described by Offner and Sauvant (Reference Offner and Sauvant2004), in which general linear models within the experiment were:

where Y obs,ij and Y pred,ij are the observed and predicted values of ADFI, ADG, G:F or tibia ash concentration in the experiment i with the treatment j, respectively, α and b are the intercept and the slope, respectively, αi and bi are the effects of the experiment i on the intercept and on the slope, respectively, and eij is the residual error. Four criteria were used to assess the accuracy of the models to predict observed values: the deviation of the intercept (a) from 0, the deviation of the slope (b) from 1, the coefficient of determination (R 2) and the residual variation expressed as root mean square error (RMSE).
Probability was considered significant when P < 0.05 and tendencies were noted when P < 0.10.
Results
Graphical analysis of data showed a consistent curvilinear response of dependent variables to dietary NPP within and between experiments (Figure 2).
Within-experiment (thin lines) and overall (thick curve) response of (a) ADFI, (b) ADG, (c) G:F and (d) tibia ash concentration to dietary NPP. The overall adjustments were: ADFI = 23.8 + 11.1 × NPP−1.23 × NPP2 (RMSE = 3.1, R 2 = 0.63), ADG = 13.7+10.8 × NPP−1.25 × NPP2 (RMSE = 2.3, R 2 = 0.71), G:F = 0.603+0.090 × NPP−0.011 × NPP2 (RMSE = 0.027, R 2 = 0.68) and tibia ash concentration = 19.9 + 8.83 × NPP−0.875 × NPP2 (RMSE = 1.85, R 2 = 0.86). With ADG, average daily gain (g/day); ADFI, average daily feed intake (g/day); G:F, gain to feed (g/g); tibia ash concentration (% DM); NPP, dietary non-phytate P concentration (g/kg diet).

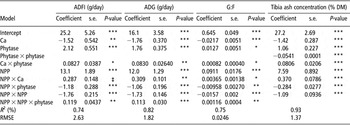
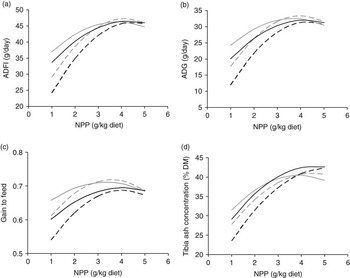
In the Ca data subgroup, Ca significantly influenced the intercept and the linear component of the response of each dependent variable to NPP, but not its quadratic component (results not shown). These two terms were thus introduced in the overall model, in which an increase in dietary Ca concentration influenced the response of all indicators of P utilisation to NPP by decreasing the intercept with a negative value of the coefficient for Ca (Ca, P < 0.01 for ADFI and P < 0.001 for ADG, G:F and tibia ash), but increasing the slope with a positive value of the coefficient for the interaction between NPP and Ca (NPP × Ca, P < 0.10 for ADFI, P < 0.05 for G:F, P < 0.01 for ADG and P < 0.001 for tibia ash concentration) (Table 2; Figure 3).
Adjustment of the response of ADFI, ADG, G:F and tibia ash concentration to dietary NPP in relation to dietary calcium and phytase in broilers fed corn-soyabean meal dietsFootnote a

ADFI = average daily feed intake; ADG = average daily gain; G:F = gain to feed; NPP = dietary non-phytate phosphorus concentration (g/kg diet); DM = dry matter; Ca = dietary Ca concentration (g/kg diet); phytase = dietary phytase activity (100 FTU/kg diet); RMSE, root mean square error.
a The general model was based on Equation (1) with added terms for Ca, phytase and interactions; interactions that are not presented in the table were not significant.
R 2, coefficient of determination.
‡ P < 0.10; *P < 0.05; **P < 0.01; ***P < 0.001.
Response of (a) ADFI, (b) ADG, (c) G:F and (d) tibia ash concentration to dietary NPP (g/kg diet) in broilers given diets with different Ca concentrations (in black, 10 g Ca/kg diet; in grey, 6 g Ca/kg diet) and phytase activity (dashed curve, 0 FTU/kg diet; continuous curve, 500 FTU/kg diet). With ADG, average daily gain (g/day); ADFI, average daily feed intake (g/day); G:F, gain to feed (g/g); tibia ash concentration (% DM); non-phytate P (NPP), dietary NPP concentration (g/kg diet).

The partial derivatives of equations presented in Table 2 with respect to Ca show that the extent of the adverse effect of Ca on indicators of P utilisation decreased linearly as dietary NPP concentration increased. In a diet containing 1 g NPP/kg without phytase, one additional gram of dietary Ca reduced ADFI, ADG, G:F and tibia ash concentration by 1.2 g/day, 1.4 g/day, 0.02 unit and 1.0 g/100 g DM, respectively, while this negative impact was reduced to 0.66 g/day, 0.83 g/day, 0.011 unit and 0.31 g/100 g DM, respectively, in a diet containing 3 g NPP/kg.
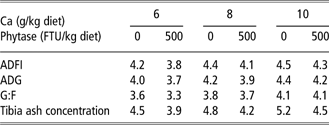
From equations presented in Table 2, it was estimated that the amount of NPP required to maximise indicators of P utilisation decreased linearly as dietary Ca concentration increased. As an example, without phytase, 4.2, 4.0, 3.6 and 4.5 g NPP/kg diet were required to maximise ADFI, ADG, G:F and tibia ash concentration, respectively, for a dietary Ca provision of 6 g/kg. These requirements were increased up to 4.5, 4.4, 4.1 and 5.2 g NPP/kg diet, respectively, when dietary Ca concentration was 10 g/kg (Table 3).
Estimates of the amount of NPP (g/kg diet) required to maximise the response of ADFI, ADG, G:F and tibia ash concentration in diets providing different amounts of calcium and of phytase in broilers fed corn-soyabean meal dietsFootnote a

NPP = dietary non-phytate phosphorus; ADFI = average daily feed intake; ADG = average daily gain; G:F = gain to feed.
a Values were calculated from the equations presented in Table 2.
In the phytase subgroup of the data, phytase significantly influenced the intercept and the linear and quadratic components of the response of ADFI, ADG and G:F to NPP, while the term phytase × phytase was not significant. In the same subgroup of data, phytase and phytase × phytase significantly influenced the intercept of the response of tibia ash concentration to NPP. In addition, phytase modified the linear component of the response to dietary NPP of this indicator. These terms were thus introduced into the overall model, in addition to the interactions aimed at assessing the impact of Ca combined with phytase on the response of indicators to NPP.
Phytase increased the intercept of the response of all dependent variables to NPP. This increase was proportional to phytase activity for indicators of growth performance (Phytase, P < 0.001 for ADFI and ADG and P < 0.05 for G:F), but followed a quadratic function of phytase for tibia ash concentration (Phytase and Phytase × Phytase, P < 0.001). This positive impact of phytase on the intercept was increased as Ca increased (Ca × Phytase, P < 0.001 for tibia ash concentration, P < 0.01 for ADG and P < 0.05 for ADFI and G:F). The positive effect of increasing dietary NPP on the response of all criteria is more marked in non-supplemental compared to supplemental phytase diet (NPP × Phytase, P < 0.001 for ADFI, ADG and tibia ash concentration and P < 0.01 for G:F), especially in diets low in NPP for indicators of growth performance (NPP × NPP × Phytase, P < 0.001 for ADG and P < 0.01 for ADFI and G:F) (Table 2; Figure 3).
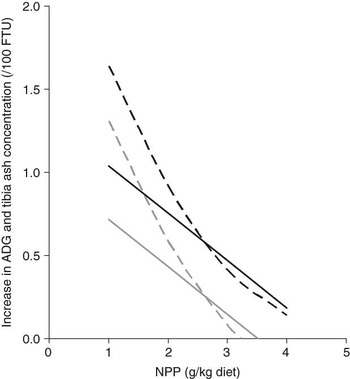
The partial derivatives of the equations presented in Table 2 with respect to phytase show that improvement due to phytase addition into a diet was independent of its phytase activity for growth performance, but decreased with its phytase activity for bone ash concentration. Besides, improvements due to phytase decreased linearly and quadratically as dietary NPP concentration increased for growth performance, while they decreased linearly for bone ash concentration. In addition, partial derivatives of equations presented in Table 2 showed that these improvements increased linearly with dietary Ca concentration. Figure 4 illustrates the extent of ADG and tibia ash concentration enhancement elicited by the addition of 100 FTU in a diet containing 500 FTU/kg. In diets containing 10 g Ca/kg, ADG was expected to increase by 1.6 and 0.41 g/day for dietary NPP concentrations of 1 and 3 g/kg, respectively, while for diets containing 6 g Ca/kg, these estimates are 1.3 g/day and almost zero, respectively. Similarly, for a dietary Ca provision of 10 g/kg, 100 FTU/kg improved tibia ash concentration by 1.0% and 0.47% DM for dietary NPP concentrations of 1 and 3 g/kg, respectively, while for a dietary Ca provision of 6 g/kg, these estimates were 0.72% and 0.15% DM, respectively. As a consequence of the positive effect of microbial phytase on P utilisation, dietary NPP needed to maximise growth performance and bone mineralisation was reduced by phytase. As an example, for a dietary Ca concentration of 8 g/kg, 4.4, 4.2, 3.8 and 4.8 g NPP/kg diet maximised ADFI, ADG, G:F and tibia ash concentration, respectively, without phytase, while these values were 4.1, 3.9, 3.7 and 4.2 g NPP/kg, with 500 FTU/kg (Table 3).
Increase in ADG (dashed curve) and tibia ash concentration (continuous curve) in response to the addition of 100 FTU of microbial phytase in diets containing 500 FTU/kg and different amounts of NPP and Ca (in black, 10 g Ca/kg diet; in grey, 6 g Ca/kg diet). With ADG, average daily gain (g/day); tibia ash concentration (% DM); non-phytate P (NPP), dietary NPP concentration (g/kg diet).

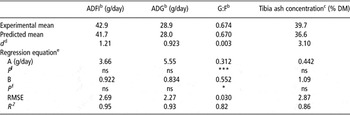
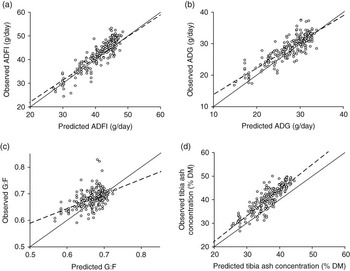
Assessment of the quality of the prediction by the current models is presented in Table 4 and in Figure 5. As a first approach, the always positive mean deviation from the bisector (d) indicated that ADFI, ADG, G:F and tibia ash concentration tended to be under-predicted by the models. For ADFI, ADG and tibia ash concentration, this slight underestimation by 5%, 6% and 7%, respectively, was fairly constant throughout the range of values. Moreover, with an intercept and a slope that did not differ from 0 and 1, respectively (P > 0.10), and a coefficient of determination that exceeded 0.85, the linear adjustment of observed to predicted values indicated a fairly good prediction of these indicators of P utilisation by means of the current models. In contrast, the almost null value of d for G:F with an intercept over 0 (P < 0.001) and a slope below 1 (P < 0.05) indicated a poor agreement between predicted and observed values.
Comparison of ADFI, ADG, G:F and tibia ash concentration in broilers observed in literature and predicted by the modelFootnote a

ADFI = average daily feed intake; ADG = average daily gain; G:F = gain to feed; DM = dry matter; RMSE = root mean square error.
a The model was described in Equation 2; Data originated from: Nelson et al. (Reference Nelson, Kirby and Johnson1990a and Reference Nelson, Harris, Kirby and Johnson1990b); Kornegay et al. (Reference Kornegay, Denbow, Yi and Ravindran1996); Lima et al. (Reference Lima, Mendoca, Alvarez, Garzillo, Ghion and Leal1997); Boling et al. (Reference Boling, Douglas, Johnson, Wang, Parsons, Koelkebeck and Zimmerman2000); Viveros et al. (Reference Viveros, Brenes, Arija and Centeno2002); Augspurger et al. (Reference Augspurger, Webel, Lei and Baker2003); Adedokun et al. (Reference Adedokun, Sands and Adeola2004); Augspurger and Baker (Reference Augspurger and Baker2004); Dilger et al. (Reference Dilger, Onyango, Sands and Adeola2004); Timmons et al. (Reference Timmons, Harter-Dennis and Sefton2004); Yu et al. (Reference Yu, Jan, Chung, Lee and Chiou2004); Jendza et al. (Reference Jendza, Dilger, Sands and Adeola2006); Persia and Saylor (Reference Persia and Saylor2006); Pillai et al. (Reference Pillai, O’Connor-Dennie, Owens and Emmert2006); Rama Rao et al. (Reference Rama Rao, Raju, Reddy and Pavani2006) and Narcy et al. (Reference Narcy, Létourneau-Montminy, Lescoat, Magnin and Nys2009, unpublished data).
b Twenty-eight experiments with 255 treatments.
c Twenty-three experiments with 221 treatments.
d Mean deviation from the bisector expressed in g/day.
e The equation is: Y obs = a + b Y pred.
f Probability that a and b differ from 0 and from 1, respectively.
R 2, coefficient of determination.
ns; P > 0.10; *P < 0.05; ***P < 0.001.
Within-experiment comparison between observed and predicted a(a) ADFI, (b) ADG, (c) G:F and (d) tibia ash concentration. aEach point represents one observation. Dashed lines, linear adjustment of observed to predicted values; continuous lines, first bisector (Y obs = Y pred).

Discussion
The fairly good prediction of experimental data by the current models confirms, as pointed out by Selle and Ravindran (Reference Selle and Ravindran2007), that Ca and microbial phytase are the main factors that affect the response of ADFI, ADG and tibia ash concentration to dietary NPP in broilers up to 21 to 22 days of age given diets based on corn and soyabean meal. In contrast, the adjustment of G:F to dietary NPP, Ca and phytase failed to predict experimental G:F data. The inconsistent response of this indicator to NPP and phytase provision was previously reported by Selle and Ravindran (Reference Selle and Ravindran2007), who mentioned its strong dependence on non-dietary parameters, such as strain or management techniques, which may have varied between the experiments used for validation and those used to fit the model.
The fitted models clearly illustrate the deleterious effect of P deficiency on each indicator of growth performance and on bone ash concentration. In the broiler, P deficiency was reported to result in a loss of appetite (Underwood and Suttle, Reference Underwood and Suttle1999) and, in turn, to reduce growth. In addition, the effect of P deficiency on feed efficiency is expected in the broiler because of its important role in body metabolism (among others, nucleic acids, high-energy compounds and various enzymatic reactions) and because of their characteristic low P storage and fast growth (Kornegay et al., Reference Kornegay, Denbow, Yi and Ravindran1996).
The fitted models also clearly illustrated that high dietary Ca aggravates P deficiency through decreased ADFI, ADG, G:F and tibia ash concentration. This well-known phenomenon (Waldroup et al., Reference Waldroup, Ammerman and Harms1963; Nelson et al., Reference Nelson, Hargus, Storer and Walker1965) is thought to be mediated via the formation of insoluble calcium phosphate precipitates in the small intestine of birds, rendering P unavailable for absorption (Hurwitz and Bar, Reference Hurwitz and Bar1971). In consequence, as pointed out by several authors (Driver et al., Reference Driver, Pesti, Bakalli and Edwards2005; Rama Rao et al., Reference Rama Rao, Raju, Reddy and Pavani2006), similar growth performance could be achieved with reduced dietary P provision if Ca was concomitantly reduced. In diets without phytase, Rama Rao et al. (Reference Rama Rao, Raju, Reddy and Pavani2006) reported similar feed intake and growth rate in broilers given diets containing 9 g Ca and 4.5 g NPP/kg compared to 6 g Ca and 3 g NPP/kg from 2 to 14 days of age. These results fit well with the current models from which, with similar Ca and NPP dietary provisions, ADFI is estimated to be 46.4 and 44.7 g/day, respectively, and ADG to be 31.8 and 31.6 g/day, respectively.
As presented in Table 3, the current models confirm that, at a given level of dietary Ca provision, more NPP is needed for maximum bone mineralisation than for growth rate (Larbier and Leclercq, Reference Larbier and Leclercq1992). This is easily explained by the fact that about 75% to 85% of P was retained in bone. In contrast to growth performance, for which the interaction between Ca and P takes place in the digestive tract only, bone P deposition also depends on Ca provision, through the formation of the mineral phase of bones, hydroxyapatite (Ca10(PO4)6(OH)2), which contains approximately 2.1 g Ca for 1 g P (WPSA, 1985). Moreover, for almost all body Ca (95%) being deposited in bone, a specific requirement of Ca for bone mineralisation does exist, in contrast to growth. In this context, although reducing dietary Ca may promote growth performance, its reduction must be carried out with care as it could limit bone mineralisation. In that case, the beneficial impact of NPP dietary reduction in terms of environment may be questionable because a lack of Ca for bone growth may cause extra losses of P in urine (Al-Masri, Reference Al-Masri1995; Létourneau-Montminy et al., Reference Létourneau-Montminy, Lescoat, Narcy, Sauvant, Bernier, Magnin, Pomar, Nys and Jondreville2008).
From a practical point of view, the current model is helpful to design diets with reduced NPP concentration, in which Ca provision allows an optimum P digestive utilisation and, in turn, growth performance, but limits the extent of low bone mineralisation. Current recommendations for broilers up to 21 days of age establish that 10 g Ca and 4.2 g available P (INRA, 1989) or 4.5 g NPP (NRC, 1994), per kg, meet the requirements. In similar conditions of Ca supply (10 g Ca/kg), the present meta-analysis indicates that 4.5 and 4.4 g NPP/kg are needed to maximise ADFI and ADG, respectively, whereas a similar performance can be achieved with only 3.4 and 3.0 g NPP/kg if Ca is lowered to 6 g/kg. These results clearly confirm that it is possible to spare NPP if Ca is concomitantly decreased. However, it was not possible to achieve similar tibia ash mineralisation with 6 g Ca/kg (42.3% v. 40.6% DM). Therefore, there is a risk to bone mineralisation and a reduction in dietary Ca needs to be controlled. The optimal mineralisation level remains to be determined.
Studies performed to assess the relationship between dietary Ca and P have generally focused on the Ca : P ratio rather than dietary concentrations of both minerals. The present models challenge the relevance of the use of a fixed Ca : P ratio for every dietary P level. For example, ADG was maximised with a Ca : P ratio of 2.3 for 4.4 g NPP/kg and 1.5 for 4.0 g NPP/kg, respectively. This suggests that the lower the NPP, the lower the Ca : P ratio needs to be to ensure maximum response. Thus, for each dietary NPP level considered, Ca has to be adjusted to the level that optimises P utilisation with an adequate compromise between growth performance and bone mineralisation.
The current models clearly illustrate the positive effect of phytase on P utilisation by broilers through improvements in growth performance and tibia ash concentration. The extent of the response to phytase addition increased most when dietary provisions of NPP and of Ca were low and high, respectively (Figure 4). The current models thus confirm, as pointed out by Driver et al. (Reference Driver, Pesti, Bakalli and Edwards2005), that the more P-deficient a bird was, the greater its response to supplemental phytase was. The models also confirm the inaccuracy of the hypothesis that high Ca : P ratios in P-deficient diets decrease phytase efficiency in birds (Sebastian et al., Reference Sebastian, Touchburn, Chavez and Lague1996; Qian et al., Reference Qian, Kornegay and Denbow1997). It is important to distinguish the concentrations of Ca and P that are required for maximal response, for a specific amount of phytase, and the concentrations of Ca and P at which a specific amount of phytase is most efficient (Driver et al., Reference Driver, Pesti, Bakalli and Edwards2005; Selle and Ravindran, Reference Selle and Ravindran2007). For example, in the present models, birds that received diets containing 2 g NPP/kg and 500 FTU phytase/kg performed better with 6 g Ca/kg than with 10 g Ca/kg (ADG: 29.3 v. 26.4 g/day). Nevertheless, the magnitude of the response to added phytase in terms of ADG was lower with 6 g/kg (26.4 v. 29.3 g/day) than with 10 g Ca/kg (21.8 v. 26.4 g/day).
As illustrated in Figure 4, the increase in tibia ash concentration elicited by phytase introduced in a diet containing a given level of Ca decreases linearly with its NPP concentration. In contrast, due to the significant interaction NPP × NPP × phytase, the increase elicited in ADFI, ADG and G:F in response to phytase introduced in a diet containing a given level of Ca is not proportional to its NPP concentration, being by far greater at low levels of NPP. These different responses regarding phytase may be ascribed to (1) the lower amounts of NPP needed to maximise performance, especially feed intake, compared to bone ash, combined with (2) the structure of the database, in which the bulk of phytase addition was around 600 to 800 FTU/kg diet. These levels of phytase probably almost fully alleviated the effect of P deficiency on growth performance, but were not sufficient to maximise tibia ash concentration. As a consequence, attempts to estimate the amount of NPP (g) corresponding to 500 FTU from the current models strongly depended on dietary Ca and NPP provision for indicators of growth performance. In contrast, they were fairly constant, ranging between 0.73 and 0.86 when tibia ash concentration was considered in birds fed diets containing 6 to 10 g Ca and 2 to 3 g NPP. The changing growth performance response to dietary phytase supply for different levels of P and Ca concentrations points out the risks encountered when assessing microbial phytase response by means of these indicators, for example, in severe P deficiency conditions. When applied to practical subdeficient diets, these assessments may cause P deficiency because of an overestimation of NPP possibly spared in replacement to phytase. Finally, the current meta-analysis suggests that phytase, like any other source of NPP, should be evaluated by means of indicators of bone mineralisation rather than those measuring growth performance, even in conditions of P and Ca supply that do not allow maximisation of bone ash concentration (Yoshida and Hoshii, Reference Yoshida and Hoshii1977). Nevertheless, it is noteworthy that a balance must be found so that levels of Ca necessary for bone mineralisation are not detrimental to growth performance. Thus, a multicriteria approach should be preferred.
The present models allowed us to quantify the response of 21-day-old broilers to dietary NPP taking into account dietary Ca and microbial phytase and their interactions. This work could thus represent a useful tool to formulate diets well balanced in terms of Ca, NPP and phytase provision. In particular, this work provides ways to reduce dietary phosphorus, especially by concomitantly reducing dietary calcium while maintaining an acceptable level of bone mineralisation. It would be very useful to extend this analysis to the finishing period where broilers consume two-thirds of the food, but the few available data during this period may limit this approach.