Implications
A major problem of the pig industry is pre-weaning mortality. Piglet performance, immediate and long-term survival depend on early intake of good quality colostrum. An on-farm tool such a Brix refractometer will facilitate investigation under field conditions of colostrum IgG content. By reducing cost and time needed for assessment, large scale studies, such as those looking for a genetic contribution, will be made more feasible. Moreover, a rapid evaluation tool will allow farmers to feed weak piglets with fresh good quality colostrum, improving welfare and economy.
Introduction
Early and sufficient intake of good quality colostrum is essential for the health and growth of the piglet (Quesnel et al., Reference Quesnel, Farmer and Devillers2012). Because colostrum yield and composition vary widely among animals, it is of fundamental importance to investigate, on a large scale, the factors affecting composition. This knowledge is needed to ensure an adequate intake of quality colostrum by piglets as quickly as possible after birth, and hence reduce pre-weaning piglet mortality and lifetime risk of disease. Moreover, early postnatal management of piglets is becoming an increasing priority (Boulot, Reference Boulot2009). In this regard, an on-farm method for detecting colostrum IgG concentration is of primary importance to piglet welfare, health and farm economics. The methods that have been commonly used for the determination of IgG concentration in swine colostrum are the ELISA and the gold standard radial immunodiffusion (RID) method, both not suitable for on-farm use. In other species, evaluation of colostrum IgG in the farm is a practise used to reduce failed transfer of passive immunity. For this purpose, the most recent method used to evaluate colostrum quality in sheep (Harker, Reference Harker1978), horses (Chavatte et al., Reference Chavatte, Clement, Cash and Grongnet1998; Cash, Reference Cash1999) and dairy cattle (Morrill et al., Reference Morrill, Robertson, Spring, Robinson and Tyler2012; Quigley et al., Reference Quigley, Lago, Chapman, Erickson and Polo2013; Bartier et al., Reference Bartier, Windeyer and Doepel2015) is the Brix refractometer. Brix is a rapid, accurate and inexpensive method, based on the ability of protein to refract light as a measure of total protein in colostrum (Chavatte et al., Reference Chavatte, Clement, Cash and Grongnet1998). To our knowledge, such on-farm tests have not yet been validated for swine colostrum. The aim of this research was therefore to establish if the Brix refractometer could be adopted also for swine. The hypothesis tested was that refraction grade in colostrum allows a meaningful estimation of swine IgG concentration as shown in several other species.
Material and method
Animals
The experiment was conducted at Cockle Park Farm, Newcastle University, Newcastle upon Tyne, UK, and was approved by the Animal Welfare and Ethics Review Body at the University. Colostrum samples were collected from 12 farrowing batches between November 2012 and April 2014. In total samples were collected from 124 sows of different parities (19 sows in each of parities one, three and four; 24 sows parity two; 18 sows parity five; 13 sows parity six; three sows parity seven; five sows parity eight; one sow each in parity nine, 10, 11 and 12. Considering that there were few sows with more than six parities, a group of 12 sows with more than six parities was created). In accordance with normal commercial farm procedures, animals were moved from the group gestation house to the farrowing unit at 110 days post-insemination, where they were kept in individual crates equipped with a feeder and drinker. Ambient temperature averaged 21°C. Sows were allowed to farrow normally at term over a 4-day period (Monday to Thursday); sows that had not farrowed within this period were then induced by injection of a prostaglandin analogue on Thursday.
Data collection
Samples of colostrum were collected when available around parturition, without the use of oxytocin. According to sampling time, three categories were created. Devillers et al. (Reference Devillers, van Milgen, Prunier and Le Dividich2004) defined a pre-farrowing phase when colostrum could be easily expressed manually from the teats; on average this was from 8 h before the onset of parturition. That study showed that IgG concentration was high before farrowing and decreased rapidly thereafter. Based on this finding, samples available before the onset of parturition until the first piglet was born were classified as before farrowing; samples collected after the first birth until 4 h later were classified as during farrowing; and finally samples collected from this point until manual expression was no longer possible, were classified as after farrowing. The operator quietly approached the sow and obtained a sample by using hand pressure, exerted approximately in the centre of the mammary gland; this system seemed to aid in making the colostrum flow more freely (Fraser, Reference Fraser1984). A 15 ml sample of colostrum was collected by sampling from all the teats located in the upper row and, when possible without disturbing the sow, also from the teats in the lower row of the udder. The sample was collected in a sterile pot (30 ml Polystyrene Universal Container; Starlab Blakelands, Milton Keynes, United Kingdom) labelled with identity of the sow, sampling time and date. After the samples were drawn they were immediately divided into three aliquots; one was immediately analyzed (fresh colostrum at room temperature), the second was refrigerated at 4°C for 24, 48 or 72 h before being analyzed and the third sample was frozen and stored at −20°C until further analysis.
Colostrum sample analyses
The Brix refractometer (MA871 digital; Obione, La Valette, France), was calibrated with distilled water before each set of analyses. A drop of well-mixed whole colostrum was placed on a Brix refractometer prism and the Brix percentage (%) was recorded. Storage temperature effects were assessed on 65 colostrum subsamples, for which fresh, refrigerated and frozen samples were analyzed in turn by Brix refractometer. Each sample was analyzed on two consecutive occasions each time to determine repeatability of results. The sampling time effect on IgG concentration was tested on 124 frozen colostrum samples, and analyzed by Brix refractometer. The correlation between RID and Brix percentage was assessed on a subset of 42 frozen colostrum samples. Samples selected were thawed in a warm water bath and thoroughly mixed before RID analysis. Five microliters of mixed colostrum solution was added to each well of a swine IgG RID test plate (Triple J Farms, Bellingham, WA, USA) in duplicate. Radial immunodiffusion plates were incubated for 24 h and the diameter of the precipitin ring was measured and compared with a standard curve created by the internal test standards, to determine IgG concentration.
Statistical analyses
Before statistical analysis, all data were checked for statistical outlier values. No data were excluded for this reason. Descriptive statistics were performed, and data are reported as arithmetic mean and standard deviation (mean±SD). Normality was assessed by application of the Shapiro–Wilkinson test. Brix percentage repeatability was assessed with the intraclass correlation coefficient (ICC). Data are highly considered reproducible when ICC>0.8 (Wolak et al., Reference Wolak, Fairbairn and Paulsen2012). The storage temperature and length effect on colostrum IgG were analyzed using one-way repeated-measures ANOVA. Three-way ANOVA was used to investigate the effect on Brix percentage of fresh samples of colostrum sampling time category (three levels), sow parity number (seven levels) and farrowing induction (two levels). Where significant differences were found, a Tukey test was applied as a post hoc tests between multiple means. The Pearson correlation coefficient was calculated to determine the association between Brix and RID results, and a regression equation was produced. The level of significance was taken as P<0.05. The statistical software R version 3.0.2 (2013-09-25) was used for all tests.
Results
Descriptive statistics
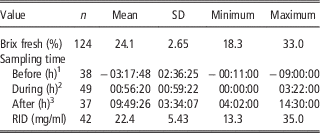
Descriptive statistics of colostrum measurements are summarized in Table 1. Colostrum was collected around parturition: 31% of the samples were collected before farrowing (maximum 9 h before); 41% during farrowing (from the first piglet born until 4 h later) and 27% after farrowing (from 4 h after the first piglet born, until maximum 14 h later). Only three sows did not fully expose at least one row of teats; thereby colostrum was collected from exposed teats. A total of 26% of the animals showed only one row, 16% showed both rows but only the anterior teats of the lower row; and 54% showed completely all the mammary glands. Only 20% (n=29) of the sows farrowed over the first 4 days after entry to the farrowing crates; 79% (n=95) of the animals were then induced by injection of a prostaglandin analogue.
Descriptive statistics of 124 colostrum samples measured at different sampling times in relation to farrowing using a Brix refractometer, and of a subset of 42 samples measured by radial immunodiffusion (RID)

1 Sampling time before farrowing.
2 Sampling time during farrowing.
3 Sampling time after farrowing.
Brix percentage for fresh colostrum ranged from 18.3% to 33.0%, with a mean of 24.1% and SD of 2.65 (Table 1). Shapiro–Wilkinson normality test displayed a normal distribution for Brix percentage of the full set of 124 samples (Shapiro–Wilkinson P>0.05). RIA IgG concentration of the subset of 42 samples used for comparison had a normal distribution (Shapiro–Wilkinson P>0.05), which ranged from 13.3 to 35.0 mg/ml. The mean and SD of RID of the 42 samples were: 22.5 mg/ml±5.43.
Repeatability, storage temperature and storage time effect
Repeatability of Brix percentage was assessed in a subset of 64 samples for fresh and refrigerated storage temperature and duration; due to shipping loss only 51 frozen samples were used. Brix percentage was highly reproducible for fresh (ICC=0.98), refrigerated (ICC=0.88) and frozen (ICC=0.99) samples. One-way repeated measure ANOVA test results showed no significant differences (P>0.05) in mean Brix percentage for different refrigeration lengths (24, 48 and 72 h). Since no significant difference was found between refrigeration lengths, only the Brix percentage values at 24 h were used to compare the different storage temperatures. A one-way repeated measures ANOVA test was used to assess if there were differences between storage temperatures. There were no differences between fresh samples and those stored at refrigerated temperature or frozen (P>0.5).
Sampling time, parity and farrowing induction effect
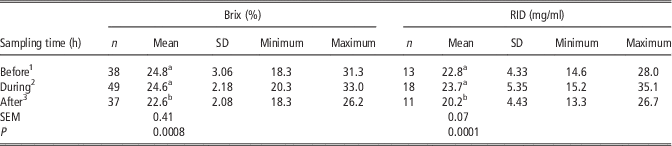
ANOVA results show a significant effect of sampling time on colostrum immunoglobulin concentration, measured with both Brix (n=124: 38 samples were collected before farrowing; 49 during farrowing; and 37 after farrowing) and RID (n=42: 13 samples were collected before farrowing; 18 during farrowing; and 11 after farrowing). The Tukey post hoc tests revealed that samples collected after farrowing had lower IgG content than before and during farrowing (Brix: F 2,103=6.04, P<0.003; RID: F 2,32=2.86, P<0.05; Table 2). Figure 1 presents the result of correlation analysis between fresh and refrigerated colostrum samples for IgG concentration measured with Brix percentage, and also shows the sampling time effect on this measure. There was no effect of sow parity number on IgG concentration (Brix: F 6,103=1.00, P=0.42; RID: F 6,32=0.47, P=0.82). Furthermore, Brix percentage were not significantly different between sows which were induced and animals that farrowed naturally (Brix: F 1,103=0.51, P=0.47; RID: F 1,32=0. 31, P=0.57, Table 2).
Regression line of Brix refractometer (%) values of fresh and refrigerated samples taken at different sampling times (r=0.86, P<0.05), also illustrating the effects of different sampling time (F 2,110=7.5; P<0.001). The grey area represents the confidence interval of the mean. After=after farrowing, Before=before farrowing, Farrowing=during farrowing.

Immunoglobulin concentration measured via refractometer (Brix (%), n=124), and radial immunodiffusion (RID, n=42) (mg/ml) at different sampling times

Mean, standard deviation and range.
1 Before farrowing (−9 to 0 h).
2 During farrowing (0 to 4 h).
3 After farrowing (4 to 14 h).
a,bWithin a column, means without a common letter differ (P<0.05).
Relationship between Brix and RID values
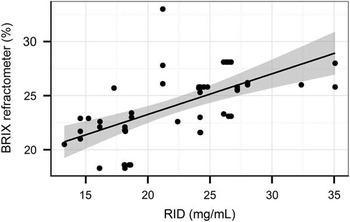
Pearson correlation coefficient results showed a significant association between the Brix and RID values (r=0.56; P<0.001, Figure 2). Further analysis of the data gave the following regression equation: RID=1.01 (±0.2) Brix +1.94 (±5.66); (R 2=0.31, P<0.001).
Regression plot between radial immunodiffusion (RID) immunoglobulin G (IgG) concentration and refractometer Brix (%) of 42 colostrum samples (regression equation: RID=1.01 (±0.2) Brix +1.94 (±5.6); R 2=0.31, P<0.001). The grey area represents the confidence interval of the mean.

Discussion
The Brix refractometer was evaluated as an on-farm methodology to assess colostrum IgG concentration in swine. Refractometry measures the concentration of any solution of dissolved solids, based on the degree to which the light rays are bent. Brix refractometer estimates colostrum IgG by reporting a Brix percentage (measure of refractive index), which can then be correlated with colostrum IgG concentration. Porter (Reference Porter1969) and Curtis (Reference Curtis1970) quantified the immunoglobulin in sow colostrum during farrowing, they noted that 80% of the proteins in sow colostrum were immunoglobulin. Klobasa et al. (Reference Klobasa, Werhahn and Butler1987) further investigated the composition of colostrum throughout farrowing and showed that immunoglobulin concentration changed rapidly after the first piglet was born (initially 95.6 mg of IgG/ml, 21.2 mg of IgA/ml and 9.1 mg of IgM/ml) and decreased by half in the first 12 h postpartum (to 32.1 mg of IgG/ml, 10.1 mg of IgA/ml and 4.2 mg of IgM/ml). This rapid fall has also been reported by others (Klobasa et al., Reference Klobasa, Werhahn and Butler1987; Bland et al., Reference Bland, Rooke, Bland, Sinclair and Edwards2003).
The results of our current study show a significant correlation between the digital Brix instrument and the RID determination, however, RID values in this study seem to be lower than previous investigations (Klobasa et al., Reference Klobasa, Werhahn and Butler1987; Machadoneto et al., Reference Machadoneto, Graves and Curtis1987; Cabrera et al., Reference Cabrera, Lin, Campbell, Moeser and Odle2012). These discrepancies may be due to a different sample preparation; as unfiltered whole colostrum was used in the present study in contrast to previous reports. Furthermore, the RID assay for IgG in the colostrum kit used provides standards that derive from serum IgG, which contains a different ratio of IgG1 : IgG2; this difference can cause erroneous quantification (Gapper et al., Reference Gapper, Copestake, Otter and Indyk2007). Moreover, Ig concentration at parturition seems to vary from one study to another, independently of the analytical methods used. Colostrum yield and composition vary among animals depending on many factors including parity, breed, season, udder section, vaccination, number of sows per farm (Inoue, Reference Inoue1981a), number of stillborn piglets (Quesnel, Reference Quesnel2011) and farrowing induction (Foisnet et al., Reference Foisnet, Farmer, David and Quesnel2011). However, in this study no difference was detected between Brix percentage of sows that farrowed naturally or were induced. This is likely to be because sows in the current study were only induced if they had not farrowed naturally by day 114, and therefore all farrowing occurred close to the natural gestation length for this farm. Furthermore, no difference was detected between Brix percentages of sows with different parities numbers. Although this result differs from some published studies, were it was found that multiparous sows had higher IgG concentration than gilts (Inoue, Reference Inoue1981a; Klobasa et al., Reference Klobasa, Werhahn and Butler1987; Quesnel, Reference Quesnel2011; Cabrera et al., Reference Cabrera, Lin, Campbell, Moeser and Odle2012), it is consistent with the report of Devillers et al. (Reference Devillers, van Milgen, Prunier and Le Dividich2004).
More important is that the findings of the current study are consistent with those of previous authors who evaluated the relationship of results obtained using the digital refractometer and standard laboratory methods on bovine colostrum (R 2=0.41, Chigerwe et al., Reference Chigerwe, Tyler, Middleton, Spain, Dill and Steevens2008; R 2=0.53, Bielmann et al., Reference Bielmann, Gillan, Perkins, Skidmore, Godden and Leslie2010; R 2=0.56, Quigley et al., Reference Quigley, Lago, Chapman, Erickson and Polo2013; R 2=0.59, Bartier et al., Reference Bartier, Windeyer and Doepel2015) Our results, like the previous ones on bovine colostrum, did not show an extremely strong correlation between RID and Brix values, as has been reported in the literature for equine colostrum (R 2=0.85; Chavatte et al., Reference Chavatte, Clement, Cash and Grongnet1998). Bielmann et al. (Reference Bielmann, Gillan, Perkins, Skidmore, Godden and Leslie2010) suggested that the composition and the volume of colostrum that is produced in mares and cows could explain these differences in the results. Swine colostrum composition at farrowing contains 24% to 30% dry matter, 15% to 19% total proteins, 5% to 7% fat, 2% to 3% lactose and 0.63% ash (Klobasa et al., Reference Klobasa, Werhahn and Butler1987; Csapo et al., Reference Csapo, Martin, CsapoKiss and Hazas1996). Devillers et al. (Reference Devillers, van Milgen, Prunier and Le Dividich2004) reported that an average volume of 3.6 l (range from 1.9 to 5.3 l) of colostrum was produced by sow, and IgG concentration in colostrum has been measured to average around 50 mg/ml (Ariza-Nieto et al., Reference Ariza-Nieto, Bandrick, Baidoo, Anil, Molitor and Hathaway2011). Production of colostrum by cows on an average was 11.2 l, with a mean composition of fat 6.7%, total solids 27.6%, and total protein 14.9%, and contains 30 to 96 mg/ml of IgG (Morin et al., Reference Morin, Constable, Maunsell and McCoy2001; Kehoe et al., Reference Kehoe, Jayarao and Heinrichs2007). In mares colostrum volume was 5.1 l, with a much higher IgG concentration of 440 mg/ml, and with 24.3% total solids, and 26.3% fat (Csapo et al., Reference Csapo, Stefler, Martin, Makray and Csapokiss1995). Comparing these compositions, one possible explanation for the weaker relationship between Brix value and IgG content in swine and cows is that IgG represents a smaller proportion of total solids. Fat and casein concentration may affect the refractometer reader (Bielmann et al., Reference Bielmann, Gillan, Perkins, Skidmore, Godden and Leslie2010), and therefore the correlation could be influenced by differences in these components of colostrum composition, which have been well demonstrated to vary a lot between sows (Inoue, Reference Inoue1981b) as well as in cows (Morin et al., Reference Morin, Constable, Maunsell and McCoy2001).
The effect of storage temperature on colostrum IgG assessment using the Brix refractometer was evaluated and Brix percentages were the same for samples which were fresh, refrigerated or frozen. Similar results were obtained in previous studies to validate the digital refractometer to estimate bovine and equine colostrum IgG (Chavatte et al., Reference Chavatte, Clement, Cash and Grongnet1998; Bielmann et al., Reference Bielmann, Gillan, Perkins, Skidmore, Godden and Leslie2010). Morrill et al. (Reference Morrill, Conrad, Polo, Lago, Campbell, Quigley and Tyler2015) showed that there was no effect of storage temperature of cow colostrum on Brix percentages. Furthermore, they demonstrated that one freeze–thaw cycle (after 7 days) did not affect IgG content, measured by RID, and that a difference in colostrum IgG between stored samples was detected only after two freeze–thaw cycles. We also assessed the effect of length of refrigeration period to determine the consistency of measurement of IgG in colostrum refrigerated for >24 h. The results suggest that the methodology is robust to procedural variations on farm.
The mean value for IgG after 4 h from the onset of farrowing was significantly lower than in colostrum samples taken before and at farrowing. These results match those reported by Bourne (Reference Bourne1969) and Klobasa et al. (Reference Klobasa, Werhahn and Butler1987), who reported that colostrum Ig concentration at birth (in mg/ml) decreased from 95.6 at the beginning of lactation to 64.8 after 6 h, and to 32.1 after 12 h. Based on the literature, at present ELISA is the analytical method most commonly used to measure swine colostrum IgG concentration. However, this analysis requires specific laboratory equipment, the kit cost is very high, it needs expertise to run the test and the results are not immediate. The RID test, in comparison with ELISA, requires less experience but it remains a laboratory analysis, which is expensive and time consuming. These results indicate that the Brix refractometer can be a useful on-farm tool and can cheaply generate large scale data, with important implications for improved selection of sows with better maternal characteristics.
Future research will investigate whether it could be also possible to assess failed transfer of passive immunity by measuring the piglet serum IgG with the refractometer, as has been done in calves (Chigerwe and Hagey, Reference Chigerwe and Hagey2014) and cows (Morrill et al., Reference Morrill, Polo, Lago, Campbell, Quigley and Tyler2013).
Conclusion
In accordance with the hypothesis for the work, the results indicate that the Brix refractometer can be used as an on-farm method to assess IgG concentration in swine colostrum, with a positive correlation between Brix percentage and the gold standard RID values. The Brix refractometer results in this investigation demonstrate that the method is highly repeatable and that storage temperature and duration do not affect the IgG assessment. Colostrum concentration changed by 4 h after the birth of the first piglet, and so sampling time needs to be taken into account as IgG concentration decreased significantly. The Brix refractometer is durable and affordable, expertise is not necessary and the calibration process is simple, making it a very practical farm tool. Because sow colostrum IgG concentration is not yet well estimated, the refractometer can be used to investigate the IgG variation in colostrum produced under field conditions, reducing cost and time, and facilitating research requiring a large sample size. Moreover, incorporating the use of a refractometer into colostrum management on farm, will allow farmers to feed weak piglets with good quality colostrum, improving welfare and economy by reducing piglet mortality.
Acknowledgements
The authors are grateful to the British Pig Executive, for funding this project. Furthermore, the authors thank the University of Newcastle farm team for their support, especially Mark Brett for providing expertise in animal management.