Implications
Although organic rabbit production represents an innovative break from conventional farming systems (battery farming), its full potential remains poorly investigated. We developed a model that simulates intake regulation and growth of rabbits raised on pastures. Model predictions may help farmers make daily management decisions when fattening rabbits on pastures. The resulting knowledge may also improve the economic sustainability and robustness of organic rabbit systems.
Introduction
Organic rabbit production represents a huge break from conventional rabbit farming (battery farming) and is characterized by raising rabbits in moving cages or small pens in which animals have access to pasture. Given the very recent investment in research on organic rabbit production, many knowledge gaps remain. Although some technical information has been produced (Duprat et al., Reference Duprat, Goby, Roinsard, Van Der Horst, Le Stum, Legendre, Descombes, Theau, Martin and Gidenne2016; Martin et al., Reference Martin, Martin-Clouaire and Duru2016; Roinsard et al., Reference Romera, Morris, Hodgson, Stirling and Woodward2016), farmers still rely on empirical knowledge through trial-and-error experiments when they make important decisions. However, this limits the potential to transfer practices among farms: empirical knowledge developed on one farm might not be applicable to another farm (Duru et al., Reference Duru, Therond, Martin, Martin-Clouaire, Magne, Justes, Journet, Aubertot, Savary, Bergez and Sarthou2016). Therefore, simulation models based on data collected from experiments and farms may help generate general principles (e.g. suitable diet supplementation, land area per rabbit, herbage allowance during grazing) for organic rabbit production expected by farmers.
Farm models consist of a simplified description (i.e. a conceptual model) of a farm or part of it, composed of relations between variables that farmers can directly influence (e.g. management practices) and those they cannot (e.g. market and climate conditions). Farm models can be used to simulate the influence of uncontrollable variables on the performance of changes in controllable variables. Through iterative loops of design and evaluation of potential farming system scenarios, these models are relatively inexpensive ways to explore and identify values of controllable variables that meet the performance goals that farmers target (Martin et al., Reference Mayes, Lamb and Colgrove2013).
Farm modeling appears to be a powerful way to quickly improve the current state of knowledge about organic rabbit production. Like other herbivorous species (Dillon et al., Reference Dillon, Roche, Shalloo and Horan2005), accurate information about how to improve grazing practices appears key for developing sustainable and robust systems. The price of organic complete pelleted feed is high, nearly three times that of conventional complete feed. In addition, on-farm production of organic grain is skill-intensive, since, due to organic standards, it is more difficult for farmers to correct management errors (Niggli et al., Reference Pérez-Prieto, Peyraud and Delagarde2015). Therefore, appropriate pasture and grazing management would not only provide an inexpensive source of nutrients required for rabbit growth but also reduce dependence on purchased feedstuffs. Grazing is also a way to recycle nutrients within the farm, which increases its overall sustainability.
Many models have been developed to simulate production systems with grazing of dairy cows (Kalaugher et al., Reference Lebas, Lebreton and Martin2013), beef cows (Romera et al., Reference van Ittersum, Leffelaar, Van keulen, Kropff, Bastiaans and Goudriaan2004) and sheep (Cacho et al., Reference Cacho, Finlayson and Bywater1995). Following the results of factorial experiments on grazing systems (e.g. Pérez-Prieto et al., Reference Roinsard, Fortun Lamothe, Gidenne, Cabaret and Van der Horst2011), these models consider the impact of a range of factors, such as daily herbage allowance, herbage fill and feed values, complementary feed (i.e. complete pellets, cereal–legume grain mixtures, etc.) and animal type (breed, weight, etc.), on animal intake and production (milk and/or meat). These models are a rich source of inspiration, but relations among these variables remain to be developed for organic rabbit production in order to support farmer decisions at the strategic planning stage.
Our goals were to (i) develop a model to simulate intake regulation and growth of rabbits raised on pastures, (ii) validate this model under a diversity of conditions and (iii) conduct a simulation experiment to predict the potential to decrease the supply of complete feed by increasing the herbage allowance through increasing the grazing area per rabbit and (iv) use this model in the framework of participatory workshops to simulate alternative management scenarios designed by farmers.
Material and methods
Model description
Model overview
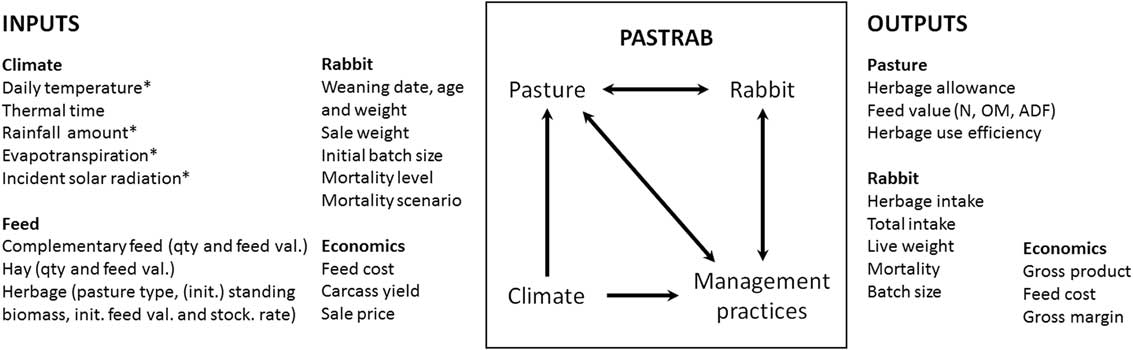
The model developed (PASTRAB) was inspired by similar simulation models for ruminants. It simulates organic rabbit fattening on pastures in four main submodels that represent dynamics of (i) herbage standing biomass, fill and feed values; (ii) intake of herbage, complementary feed and hay as regulated by herbage allowance, fill and feed values of feedstuffs and rabbit physiological parameters (e.g. metabolic live weight); (iii) conversion of rabbit intake into live weight gain; and (iv) rabbit mortality (Figure 1). The model also calculates gross margin per rabbit sold. The simulation model has a weekly time step and covers the period from weaning up to the sale of rabbits.
Conceptual model of PASTRAB, which simulates intake and growth of rabbits raised on pastures, with key inputs and outputs. Arrows represent interactions (actions or flows of matter or information) between simulated components. Asterisks indicate inputs that are not needed when data on herbage standing biomass per week are available. OM=organic matter.

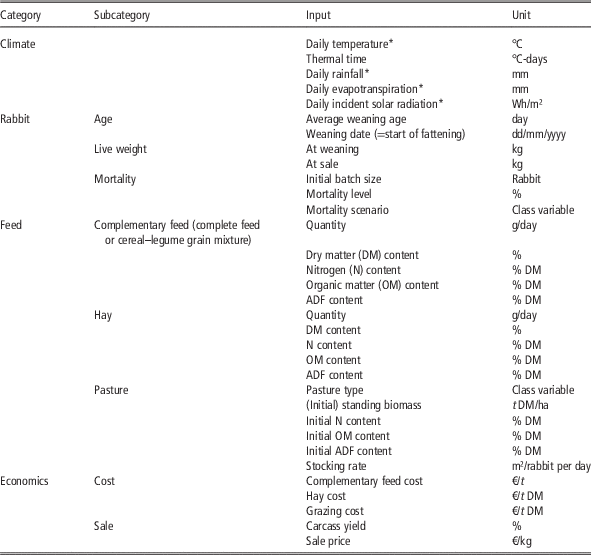
PASTRAB requires input variables (Table 1) describing climate, rabbit, feed and economic characteristics. The only mandatory climate variable is thermal time. Rabbit input variables are related to the animals themselves (i.e. mortality parameters) or to management practices (i.e. age and live weight at weaning and sale). Among feed input variables, those related to pasture include pasture type (mainly grass-based v. legume-based); initial thermal age; nitrogen (N), organic matter (OM) and ADF contents; stocking rate for grazing and, when available, herbage standing biomass per week. When data on standing biomass are not available over several weeks, initial standing biomass is also needed, along with additional climate variables: daily mean temperature, rainfall, evapotranspiration and incident solar radiation. Other feed-related input variables represent hay and complementary feed with their respective dry matter (DM), N, OM and ADF contents and rationing. Economic input variables are the carcass yield of rabbits, the price of rabbit meat per kilogram of carcass weight and the prices of hay, complementary feed and herbage.
Model inputs and corresponding units

*Indicate inputs that are not required when weekly data on herbage standing biomass are available.
PASTRAB predicts biophysical and economic variables as output. Biophysical variables predicted on a weekly basis include herbage allowance and its associated feed value (N, OM and ADF contents); rabbit intake during grazing; herbage use efficiency (HUE); and rabbit growth rate, live weight and mortality. Predicted economic variables are gross output, feed costs and gross margin for the batch of rabbits over the entire fattening period.
Based on our observations (Martin et al. (Reference Martin, Martin-Clouaire and Duru2016) and subsequent experiments; Table 2), we assumed that rabbits eat all the complete feed and hay offered, regardless of the herbage allowance. As a movable cage was the system used in these experiments, the model simulated only this system.
Key features of the experiments used to calibrate and validate the PASTRAB simulation model

GP=grass-based pasture; LP=legume-based pasture.
Complete or incomplete data mean that all data on herbage fill and feed values are or are not available, respectively.
Submodel of herbage standing biomass, feed and fill values
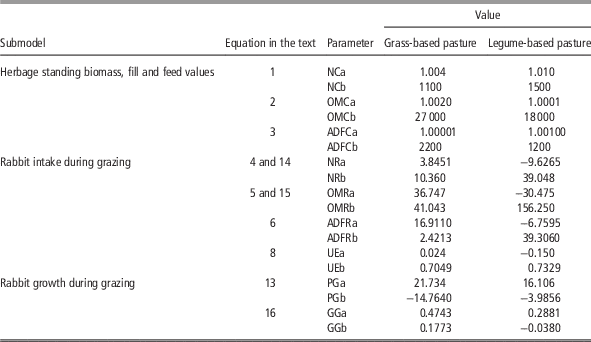
When data on herbage standing biomass are not available over several weeks, it is possible to predict herbage growth by integrating a model adapted for a variety of pastures (Duru et al., Reference Duru, Adam, Cruz, Martin, Ansquer, Ducourtieux, Jouany, Theau and Viegas2009) as a submodel of PASTRAB. We modeled feed and fill values using the INRA (Reference Jouven and Baumont2007) animal feed tables, which contain data for multiple developmental stages of many pasture types. We converted these development stages into thermal time based on Ansquer et al. (Reference Ansquer, Al Haj Khaled, Cruz, Theau, Therond and Duru2009) and related these thermal times to pasture feed and fill values. The resulting following equations are used to calculate herbage N (N_Herb), OM (OM_Herb) and ADF (ADF_Herb) contents based on their initial values (Init_N_Herb, Init_OM_Herb, Init_ADF_Herb, respectively) as well as herbage initial (Init_Thermal_Age) and current (Thermal_Age) thermal age and a range of parameters (NCa, NCb, OMCa, OMCb, ADFCa, ADFCb; Table 3).
 $$\eqalignno{{\rm N_{-\!}}{\rm Herb} \,{\equals}\,{\rm Init_{-\!}}{\rm N_{-\!}}{\rm Herb}-{\rm Init_{-\!}}{\rm N_{-\!}}{\rm Herb} {\times}( {{\rm NCa} } \cr \,\,-\!{\rm exp} ( {-\left( {{\rm Thermal_{-\!}}{\rm Age}-{\rm Init_{-\!}}{\rm Thermal_{-\!}}{\rm Age}} \right)/{\rm NCb \right) \right) }}\cr $$
 $$\eqalignno { {\rm OM_{-\!}}{\rm Herb} \,{\equals}\,{\rm min}(96\,\%\,{\rm Init_{-\!}}{\rm OM_{-\!}}{\rm Herb}{\plus}{\rm Init_{-\!}}{\rm OM_{-\!}}{\rm Herb} {\times} {( {{\rm OMCa} }} \cr \,\,\,\,-\!{\rm exp}( {-\letf( {{\rm Thermal_{-\!}}{\rm Age}}\!-\!{\rm Init_{-\!}}{\rm Thermal_{-\!}}{\rm Age}} \right)/{\rm OMCb\right)} \!\right) \!\right) \cr $$
 $$\eqalignno{ {\rm ADF_{-\!}}{\rm Herb} \,{\equals}\,{\rm Init_{-\!}}{\rm ADF_{-\!}}{\rm Herb}{\plus}{\rm Init_{-\!}}{\rm ADF_{-\!}}{\rm Herb} {\times}( {{\rm ADFCa} } \cr \,\,\,\,\,- \!{\rm exp}( {-( {{\rm Thermal_{-\!}}{\rm Age}\!-\!{\rm Init_{-\!}}{\rm Thermal_{-\!}}{\rm Age}} )/{\rm ADFCb )\! ) }}\cr $$
Model parameter values after calibration

Submodel of rabbit intake during grazing
The next submodel sets an upper limit of potential herbage DM intake during grazing equal to the minimum of three herbage intake limits calculated from rabbit metabolic weight (MW=Live_Weight0.75); intake of complementary feed (CF_Intake) and hay (Hay_Intake); and N, OM and ADF contents of herbage, complementary feed (N_CF, OM_CF, ADF_CF, respectively) and hay (N_Hay, OM_Hay, ADF_Hay, respectively), along with a range of parameters (NRa, NRb, OMRa, OMRb, ADFRa, ADFRb; Table 3):
∙ a metabolic limit to N intake:
(4) $$\eqalignno{{\rm N_{-\!}}{\rm limit} \,{\equals}\,( {( {{\rm NRa}{\times}{\rm MW}{\plus}{\rm NRb}} )-( {{\rm CF_{-\!}}{\rm Intake}{\times}{\rm N_{-\!}}{\rm CF}} ) } \cr \,\,\,{ -( {{\rm Hay_{-\!}}{\rm Intake}{\times}{\rm N}\_{\rm Hay}} )} )\,/\,{\rm N_{-\!}}{\rm Herb}$$
∙ a metabolic limit to OM intake:
(5)
$$\eqalignno{ {\rm OM_{-\!}}{\rm limit} \,{\equals}\,( {( {{\rm OMRa}{\times}{\rm MW}{\plus}{\rm OMRb}} )-( {( {{\rm CF_{-\!}}{\rm Intake}{\times}{\rm OM_{-\!}}{\rm CF}} ) }} \cr \,\,\,\,{{ -( {{\rm Hay_{-\!}}{\rm Intake}{\times}{\rm OM_{-\!}}{\rm Hay}} )} )} \,/\,{\rm OM_{-\!}}{\rm Herb} $$
∙ a physical limit to gastrointestinal fill from ADF intake:


 $$\eqalignno{\hskip -7pt{\rm ADF_{-\!}}{\rm limit} \,{\equals}\,( {( {{\rm ADFRa}{\times}{\rm MW}{\plus}{\rm ADFRb}} ) -( {{\rm CF_{-\!}}{\rm Intake}{\times}{\rm ADF_{-\!}}{\rm CF}} ) } \cr \,\,\,{ -( {{\rm Hay_{-\!}}{\rm Intake}{\times}{\rm ADF_{-\!}}{\rm Hay}} )} )\,/\,{\rm ADF_{-\!}}{\rm Herb} \quad$$
Potential herbage intake (Pot_Herb_Intake) (i.e. maximum herbage intake during grazing), equals the smallest of the three intake limits:
 $${\rm Pot_{-\!}}{\rm Herb_{-\!}}{\rm Intake}\,{\equals}\,{\rm min}\left( {{\rm N_{-\!}}{\rm limit},\,{\rm OM_{-\!}}{\rm limit},\,{\rm ADF_{-\!}}{\rm limit}} \right)$$
The extent to which rabbits can reach potential herbage intake depends mainly on herbage allowance (Martin et al., Reference Martin, Martin-Clouaire and Duru2016). Thus, along with the use of two parameters (UEa, UEb; Table 3), the model calculates that HUE logarithmically decreases as a function of the ratio of herbage allowance to potential herbage intake, following relations well established for dairy cows (Pérez-Prieto et al., Reference Roinsard, Fortun Lamothe, Gidenne, Cabaret and Van der Horst2011):
 $${\rm HUE}\,{\equals}\,{\rm UEa}{\times}{\rm ln}\left( {{\rm HA}\,/\,{\rm Pot_{-\!}}{\rm Herb_{-\!}}{\rm Intake}} \right){\plus}{\rm UEb}$$
Actual herbage intake (Herb_Intake) is calculated as the minimum of potential herbage intake and herbage allowance corrected by HUE:
 $${\rm Herb_{-\!}}{\rm Intake}\,{\equals}\,{\rm min}({\rm Pot_{-\!}}{\rm Herb_{-\!}}{\rm Intake};\,\,{\rm HA}{\times}{\rm HUE})$$
Next, the model calculates intake of N (N_Intake), OM (OM_Intake) and ADF (ADF_Intake) by multiplying the intake of herbage, complementary feed and hay by their N, OM and ADF contents, and then summing the subtotals for each nutritive component:
 $$\eqalignno{{\rm N_{-\!}}{\rm Intake} \,{\equals}\,{\rm N_{-\!}}{\rm Herb}{\times}{\rm Herb_{-\!}}{\rm Intake}{\plus}{\rm N_{-\!}}{\rm Hay}{\times}{\rm Hay_{-\!}}{\rm Intake} \cr \,\,\,{\plus}{\rm N_{-\!}}{\rm CF}{\times}{\rm CF_{-\!}}{\rm Intake}$$
 $$\eqalignno{{\rm OM_{-\!}}{\rm Intake} \,{\equals}\,{\rm OM_{-\!}}{\rm Herb}{\times}{\rm Herb_{-\!}}{\rm Intake}{\plus}{\rm OM_{-\!}}{\rm Hay}{\times}{\rm Hay_{-\!}}{\rm Intake} \cr \,\,\,{\plus}{\rm OM_{-\!}}{\rm CF}{\times}{\rm CF_{-\!}}{\rm Intake}$$
 $$\eqalignno{{\rm ADF_{-\!}}{\rm Intake} \,{\equals}\,{\rm ADF_{-\!}}{\rm Herb}{\times}{\rm Herb_{-\!}}{\rm Intake}{\plus}{\rm ADF_{-\!}}{\rm Hay}{\times}{\rm Hay_{-\!}}{\rm Intake} \cr \,\,\,{\plus}{\rm ADF_{-\!}}{\rm CF}{\times}{\rm CF_{-\!}}{\rm Intake}$$
Submodel of rabbit growth during grazing
PASTRAB calculates average growth from an average growth curve (Average_Rabbit_Growth) that is a function of MW and two parameters (PGa, PGb; Table 3). Next, the model calculates the N and OM required to sustain average growth (N_Req_Av_Growth and OM_Req_Av_Growth, respectively) as a function of MW and four parameters (NRa, NRb, OMRa, OMRb; Table 3).
 $${\rm Average_{-\!}}{\rm Rabbit_{-\!}}{\rm Growth}\,{\equals}\,{\rm PGa}{\times}{\rm MW}{\plus}{\rm PGb}$$
 $${\rm N_{-\!}}{\rm Req_{-\!}}{\rm Av_{-\!}}{\rm Growth}\,{\equals}\,{\rm NRa}{\times}{\rm MW}{\plus}{\rm NRb}$$
 $${\rm OM_{-\!}}{\rm Req_{-\!}}{\rm Av_{-\!}}{\rm Growth}\,{\equals}\,{\rm OMRa}{\times}{\rm MW}{\plus}{\rm OMRb}$$
Assuming that a linear relation exists between average growth and shortages or surpluses in N (N_Gap) and OM (OM_Gap), the model calculates actual rabbit growth (Rabbit_Growth) as a function of average growth and two parameters (GGa, GGb; Table 3):
 $$\eqalignno{{\rm N_{-\!}}{\rm Gap} \,{\equals}\,\left( {{\rm N_{-\!}}{\rm Intake}-{\rm N_{-\!}}{\rm Req_{-\!}}{\rm Av_{-\!}}{\rm Growth}} \right)\,/\,\cr \,\,\,\,\,{\rm N_{-\!}}{\rm Req_{-\!}}{\rm Av_{-\!}}{\rm Growth}$$
 $$\eqalignno{{\rm OM_{-\!}}{\rm Gap} \,{\equals}\,\left( {{\rm OM_{-\!}}{\rm Intake}-{\rm OM_{-\!}}{\rm Req_{-\!}}{\rm Av_{-\!}}{\rm Growth}} \right)\,/ \cr \,\,\,\,\,{\rm OM_{-\!}}{\rm Req_{-\!}}{\rm Av_{-\!}}{\rm Growth}$$
 $$\eqalignno{{\rm Rabbit_{-\!}}{\rm Growth} \,{\equals}\,{\rm Average_{-\!}}{\rm Rabbit_{-\!}}{\rm Growth}{\plus}( {{\rm GGa}{\times}{\rm min}( {{\rm N_{-\!}}{\rm Gap}, }} \cr { \,\,\,\,\,\,\,\,{\rm OM_{-\!}}{\rm Gap}} ){\plus}{\rm GGb ) }$$
Submodel of rabbit mortality during grazing
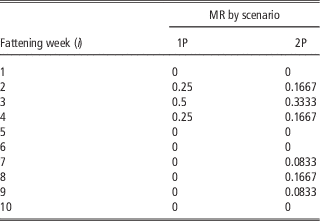
Due to a lack of available process-based knowledge about rabbit mortality, the model calculates rabbit mortality (Rabbit_Mortality) as a function of the mortality level (Mortality_Level; i.e. the total percentage of mortality over the duration of rabbit fattening) and the mortality rate (MR; i.e. the percentage of the mortality level occurring each week; Table 4) each week (t) and the initial size of the rabbit batch (Init_Batch_Size). Accordingly, the model simulates the decrease in rabbit batch size (Batch_Size) that is required to calculate economic indicators (equation (21)).
 $${\rm Rabbit_{-\!}}{\rm Mortality}\left( t \right)\,{\equals}\,{\rm Init_{-\!}}{\rm Batch_{-\!}}{\rm Size}{\times}{\rm Mortality_{-\!}}{\rm Level}{\times}{\rm MR}\left( t \right)$$
 $${\rm Batch_{-\!}}{\rm Size}\left( t \right){\equals}{\rm Batch_{-\!}}{\rm Size}\left( {t{\minus}1} \right){\minus}{\rm Rabbit_{-\!}}{\rm Mortality}\left( t \right)$$
Mortality rate (MR; equation (19)) per week (i) of fattening in scenarios with one (1P) or two (2P) mortality peaks

Economic submodel
PASTRAB calculates gross margin per rabbit sold as a function of rabbit live weight at sale, carcass yield (Carcass_Yield) and sale price (Sale_Price) minus the cost of herbage (Herbage_Cost), hay (Hay_Cost) and complementary feed (Complementary_Feed_Cost), including the costs of feeding rabbits that died during fattening:
 $$\eqalignno{ {\rm Gross_{-\!}}{\rm Margin_{-\!}}{\rm per_{-\!}}{\rm Rabbit} \cr & \quad{\equals}({\rm Gross_{-\!}Output_{-\!}per_{-\!}Batch{\minus}Herbage_{-\!}intake}_{0}^{t} \cr \quad\,\,\,{\times}{\rm Herbage_{-\!}Cost{\minus}Hay_{-\!}intake}_{0}^{t} {\times}{\rm Hay_{-\!}Cost } \cr \quad\,\,\,{{\minus}{\rm Complementary_{-\!}Feed_{-\!}Intake}_{0}^{t} } \cr \quad\,\,\,{\times}{\rm Complementary_{-\!}Feed_{-\!}Cost)\,/\,min(Batch_{-\!}Size)} $$
where
 $$\eqalignno{ {\rm Gross_{-\!}}{\rm Output_{-\!}}{\rm per_{-\!}}{\rm Batch}{\equals}{\rm Gross_{-\!}}{\rm Output_{-\!}}{\rm per_{-\!}}{\rm Rabbit} \cr \quad{\times}{\rm min}\left( {{\rm Batch_{-\!}}{\rm Size}} \right)$$
where
 $$\eqalignno{ {\rm Gross_{-\!}}{\rm Output_{-\!}}{\rm per_{-\!}}{\rm Rabbit}{\equals}{\rm max}\left( {{\rm Live_{-\!}}{\rm Weight_{-\!}}{\rm Rabbit}} \right) \cr \quad{\times}{\rm Carcass_{-\!}}{\rm Yield}{\times}{\rm Sale_{-\!}}{\rm Price}$$
Data sets used for model calibration and validation
For model calibration and validation, we used data from 7 and 12 independent experiments, respectively, that cover a wide range of agricultural conditions in France. These experiments were conducted in different locations, seasons and pasture types with different stocking rates and amounts of complementary feed (Table 2), and using rabbits that were hybrids of traditional breeds (Fauve de Bourgogne and Papillon). The number of data points per experimental unit (i.e. production cage) differed because measurement frequency differed among experiments. In five experiments, herbage fill and feed values were not measured; thus, we used these experiments only for model validation.
Model calibration
We calibrated limits of herbage intake for two types of pastures: those dominated by grass species (‘grass-based’) and those dominated by legume species (‘legume-based’). Calibration by plant family was necessary because their ADF can contain different types of fibers, which induce different amounts of intake per unit of ADF. The same reasoning applies to N and OM contents. We also calibrated different equations for HUE for grass- and legume-based pastures because the verticality of their plant growth differs once herbage has been flattened by moving cages (Table 3).
The model of herbage standing biomass (Duru et al., Reference Duru, Adam, Cruz, Martin, Ansquer, Ducourtieux, Jouany, Theau and Viegas2009) with feed and fill values did not require further calibration. To calibrate the submodel of rabbit intake during grazing, we used only complete data sets (i.e. including measures of herbage feed values) that we first separated by pasture type. Measuring intake during grazing is difficult, especially when using moving cages, because herbage allowance (used to calculate intake) is not measured directly where the animals graze but next to the cage in an area that may have a different allowance. This measuring technique has the disadvantage that the cages flatten herbage standing biomass, which makes it difficult to measure grazing refusals (used to calculate intake) when HUE is low. Therefore, the potential for measurement errors increases.
We removed the following data points from each data set: measured herbage intake greater than herbage allowance or 110 g/kg of MW, that is, the maximum intake observed for conventional rabbits (Gidenne and Lebas Reference Gidenne and Lebas2006), and HUE <25%. For each pasture type, we selected half of the data each for model calibration and validation. Parameter estimation yielded calibrated parameter values (Table 3).
As our experiments were the first time these pastures had been used for rabbit grazing, they were free of parasites harmful to rabbits. Thus, mortality was much lower than that on farms, starting to increase only during the third year of the experiment. On the other hand, the farm data that we found showed extremely diverse levels of rabbit mortality. Thus, it was rather impossible to derive reliable and largely applicable parameter values from these data. Then, we calibrated the corresponding submodel based on mortality dynamics observed on conventional battery rabbit farms and kept the mortality level as a simulation input to easily account for differences among farms. Two types of scenarios of rabbit mortality were created: a single mortality peak from weeks 2 to 4 of fattening or two mortality peaks from weeks 2 to 4 and 7 to 9 of fattening (Table 4).
To calibrate the economic model, we used data from the ‘Réseaux d’élevage’ program (Inosys, 2016), which has a network of cattle and sheep farms that are surveyed annually, from which technical, economic, social and environmental data are derived to calculate the production cost per tonne DM of several types of feed, including herbage and hay. For complementary feed, we used the current price of organic pelleted feed for rabbits in the French market provided by farmers.
Model validation
Among the 12 data sets (Table 2) used to validate the model, experiments 4, 5 and 8, nine were incomplete because they lacked herbage feed values. Thus, we used feed values for them from experiment 7, which had the most similar season and pasture type conditions. Experiments conducted in Rennes (10 and 11) and Égletons (12) were also incomplete due to less frequent measurements of herbage standing biomass. Thus, we used predictions of an herbage growth model (Duru et al., Reference Duru, Adam, Cruz, Martin, Ansquer, Ducourtieux, Jouany, Theau and Viegas2009) to supplement the measurements, along with feed values from the literature (INRA, Reference Jouven and Baumont2007).
The validity of the model was assessed based on its ability to accurately predict rabbit herbage intake (g DM/day) and live weight (kg) during grazing, by calculating relative root mean square error (rRMSE), a commonly used (Bellocchi et al., Reference Bellocchi, Rivington, Donatelli and Matthews2010) residual-based statistical indicator of predictive power (Wallach et al., Reference Wallach, Makowski and Jones2006). In this case, rRMSE was the square root of the variance of rabbit herbage intake or live weight residuals divided by the mean observed herbage intake or live weight, respectively. It indicates the relative fit of model predictions to observed data.
 $${\rm rRMSE}{\equals}\surd\left( {1\,/\,n{\times}\Sigma \left( {Y_{{si}} {\minus}Y_{{oi}} } \right)^{2} } \right)\,/\,\bar{\Upsilon }_{o} $$
where n is the number of observations, Ys
i
the predicted herbage intake or live weight of rabbit i, Yo
i
the observed herbage intake or live weight of rabbit i and
 $$\bar{\Upsilon }_{o}$$
the mean observed herbage intake or live weight.
Simulation experiment
We conducted a simulation experiment to illustrate PASTRAB’s potential. A current challenge of French organic rabbit production is to increase pasture use and reduce the use of complementary feed. If complementary feed is reduced, rabbit intake during grazing should increase. The objective of the simulation experiment was to assess the relevance of this strategy. Starting from a ration of complementary feed of 90 g/rabbit per day, we simulated reductions to 50 and 0 g/rabbit per day. We combined these three levels of complementary feed with five stocking rates (0.4, 0.6, 0.8, 1.0 and 1.2 m²/rabbit per day), keeping all other management practices constant. Simulations were initialized with inputs from experiment 1, at Perpignan (Table 2). We compared model predictions (i.e. HUE, average daily growth and gross margin per rabbit) to each other using non-parametric Wilcoxon tests (with α=0.05).
Participatory workshops
We used PASTRAB in three participatory workshops organized in three locations (Perpignan, St Jean sur Erve, St Brieuc) differing especially in the duration and extent of water shortages for pasture growth during the year. These workshops involved six farmers and were intended to simulate alternative management scenarios designed by farmers so that they could explore adaptations of their current practices. We started with visiting the farm hosting the workshop. Then, we presented the simulation model and entered the current practices of the farmer. Afterwards, farmers designed scenarios of alternative management to decrease complementary feed, adjust the stocking rate and increase HUE during specific seasons. Farmers also simulated different mortality levels in their analysis to assess the sensitivity of scenarios to potentially higher mortality levels induced by new practices. After each simulation, the outputs were collectively analyzed and based on the discussions, farmers decided or not to go for an additional simulation. In the end, we asked farmers about their opinions on the reliability and consistency of the simulation outputs and if they would consider using the model to make their decisions.
Results
Model accuracy
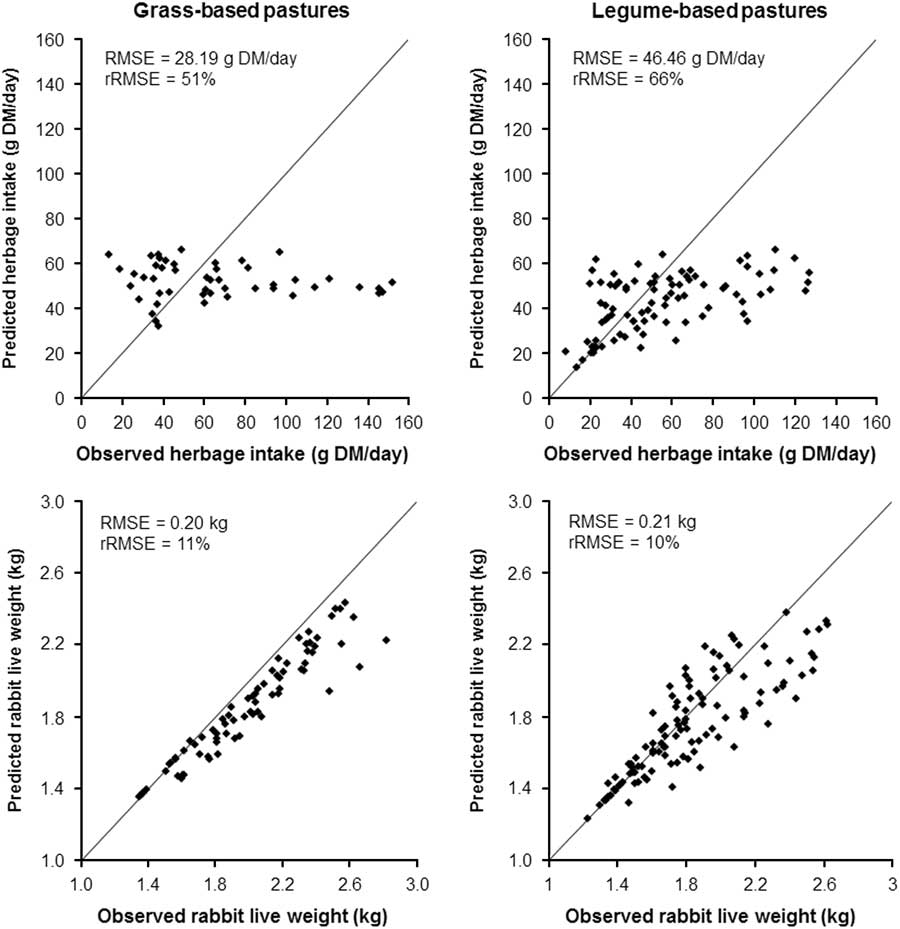
The fit between observed and predicted herbage intake was low, with rRMSE of 51% and 66% on grass- and legume-based pastures, respectively (Figure 2). PASTRAB tended to underestimate high observed intake values (>80 g DM/day) and overestimate the lowest observed intake values. However, standard deviations of observations reached 30.3 and 42.9 g DM/rabbit per day for grass- and legume-based pastures, respectively, which were similar to the root mean square error (RMSE) of predicted herbage intake (28.2 and 46.5 g DM/rabbit per day, respectively).
Observed v. predicted herbage intake (g dry matter (DM)/day; top)) and live weight (kg; bottom) of rabbits raised on grass-based (left) and legume-based (right) pastures. The solid line is the 1 : 1 line. The root mean square error (RMSE) and relative RMSE (rRMSE) are specified.
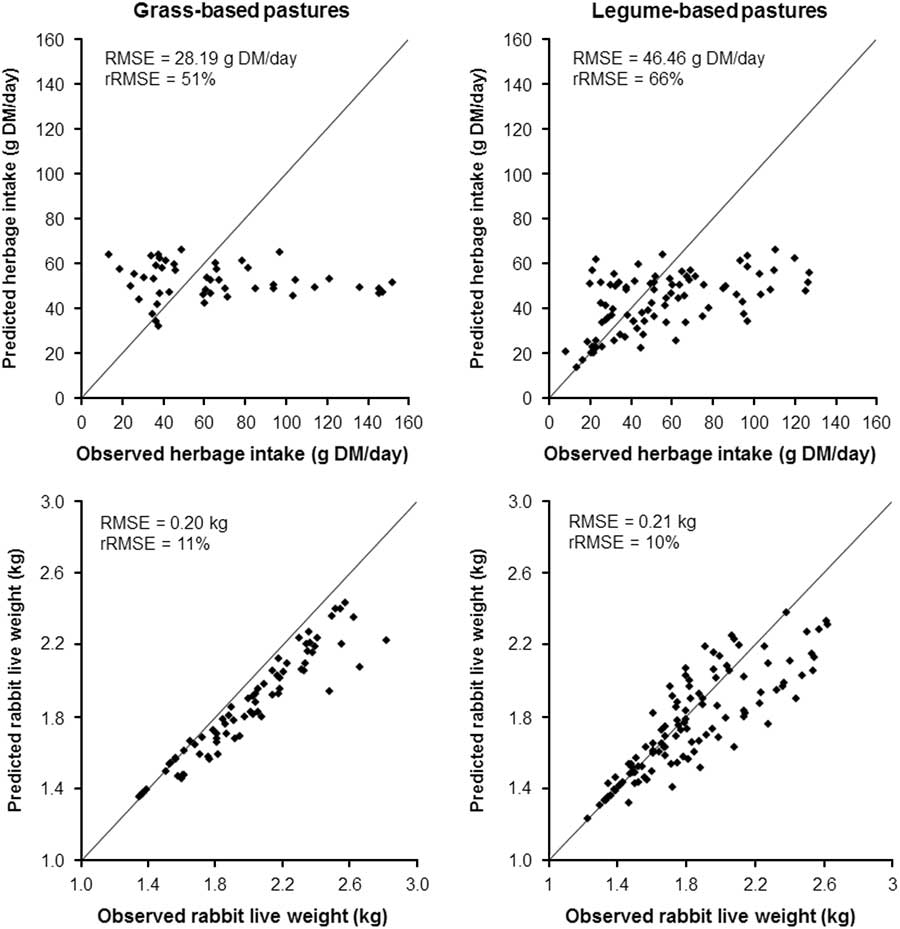
The fit between observed and predicted rabbit live weight was acceptable, with the rRMSE limited to 11% and 10% for grass- and legume-based pastures, respectively. The RMSE of predictions (0.20 and 0.21 kg, respectively) had a smaller range than those of standard deviations of observations (0.35 and 0.42 kg, respectively). PASTRAB consistently underestimated live weight of rabbits raised on legume-based pastures but was satisfactory for rabbits raised on grass-based pastures.
Simulation experiment
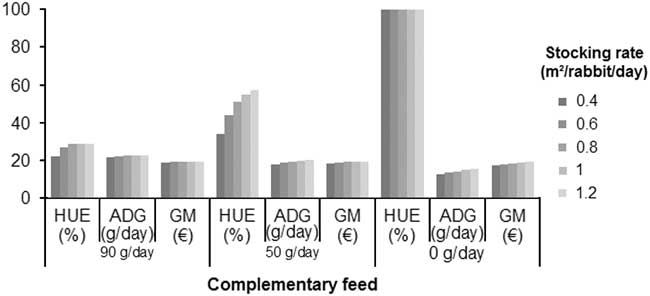
Among the simulated scenarios, rabbit average daily growth ranged from 22.7 g/day (90 g/day of complementary feed and grazing area of 1.2 m²/rabbit per day) to 12.8 g/day (no complementary feed and 0.4 m²/rabbit per day) (Figure 3). However, differences in gross margin were smaller, ranging from 19.60 €/rabbit (50 g/day of complementary feed and 1.2 m²/rabbit per day) to 17.70 €/rabbit (no complementary feed and 0.4 m²/rabbit per day).
Herbage use efficiency (HUE), rabbit average daily growth (ADG) and gross margin (GM) per rabbit according to three levels of complementary feed (90, 50 and 0 g/rabbit per day) and five levels of grazing area per rabbit (0.4, 0.6, 0.8, 1.0 and 1.2 m²/rabbit per day) predicted by the model when initialized with data from experiment 1 (Table 2).

With 90 g of complementary feed per day and 0.4 m²/rabbit per day, HUE was 22%, average daily growth was 21.6 g/day and gross margin was 18.80 €/rabbit. These results were the worst predicted with 90 g of complementary feed per day, indicating that it is beneficial to increase the grazing area per rabbit. When grazing area increased to 0.6 m²/rabbit per day, HUE, average daily growth and gross margin were 27%, 22.4 g/day and 19.20 €/rabbit, respectively. When it increased to 0.8 to 1.2 m²/rabbit per day, however, HUE, average daily growth and gross margin plateaued (29%, 22.7 g/day and 19.30 €/rabbit, respectively). This was because maximum herbage intake capacity was reached at 0.8 m²/rabbit per day. Differences between predictions at 0.6 and 0.8 m²/rabbit per day were not statistically significant.
When complementary feed was decreased to 50 g/day, with grazing area of 0.4 m²/rabbit per day, HUE increased from 22% to 34%, but average daily growth decreased by 3.7 g/day (to 17.9 g/day), which in turn decreased gross margin by 0.40 €/rabbit (to 18.40 €/rabbit). When grazing area increased to 0.8 m²/rabbit per day, HUE increased (to 51%), as did average daily growth and gross margin (to 19.5 g/day and 19.20 €/rabbit, respectively). When grazing area increased to 1.0 m²/rabbit per day, HUE increased (to 55%), as did average daily growth and gross margin (to 20.2 g/day and 19.50 €/rabbit, respectively). When grazing area increased to 1.2 m²/rabbit, HUE changed little, while average daily growth and gross margin per rabbit remained the same.
With no complementary feed, with grazing area of 0.4 m²/rabbit per day, average daily growth decreased sharply (to 12.8 g/day), but gross margin was 17.70 €/rabbit because feed costs were nearly 0. When grazing area increased to 0.8 m²/rabbit per day, average daily growth increased to 14.2 g/day, but gross margin increased by <1 €/rabbit. When grazing area increased to 1.2 m²/rabbit per day, average daily growth increased to 19.2 g/day, leading to a gross margin of 19.20 €/rabbit. For all scenarios with no complementary feed, average daily growth was <20 g/, as observed in experiments 8 and 9, which had no complementary feed.
Wilcoxon tests showed no significant differences among predictions as a function of the amount of complementary feed (Table 5). These simulated scenarios demonstrated that a decrease in complementary feed combined with an increase in grazing area per rabbit had little influence on average daily growth and gross margin per rabbit but increased HUE. Efficient use of pastures is essential to ensure the quality of their subsequent regrowth and their longevity. Thus, from a pasture management and environmental perspective, reducing complementary feed and increasing the grazing area seem the most sustainable option. However, from the farmer’s perspective, this decision depends mainly on work organization, individual objectives and risk aversion. Providing rabbits with complementary feed is a way to secure the production against interannual climatic variability.
Wilcoxon tests (with α=0.05) of herbage use efficiency (HUE), average daily growth (ADG) and gross (GM) margin per rabbit predicted at three levels of complementary feed (90, 50 and 0 g/rabbit per day)

Discussion
Merits and limits of the PASTRAB model
PASTRAB is the first simulation model to focus on the fattening of rabbits raised on pastures. Although this practice began in the 1970s, except for some technical trials (Lebas et al., Reference Martin2002), scientific knowledge about this form of rabbit farming is recent (Martin et al., Reference Martin, Martin-Clouaire and Duru2016), with only a few experiments conducted so far. We pursued several objectives when developing PASTRAB: (i) integrating all available knowledge about the topic (van Ittersum et al., 2003), (ii) combining this knowledge with concepts derived from simulation models of cattle production systems (Romera et al., Reference van Ittersum, Leffelaar, Van keulen, Kropff, Bastiaans and Goudriaan2004) and (iii) producing knowledge about new management practices (Whitbread et al., Reference Whitbread, Robertson, Carberry and Dimes2010) for fattening rabbits on pastures. Simulation modeling limits costly field experiments and provides both new and experienced farmers a way to explore adaptations of their current practices through the lens of biophysical and economic performances (Martin, Reference Martin, Duprat, Goby, Theau, Roinsard, Descombes, Legendre and Gidenne2015).
PASTRAB accurately predicted rabbit live weight, but predicted herbage intake during grazing less accurately. Given the underlying variability in observed herbage intake that yielded high standard deviations, it seems that it would have been difficult to calibrate the model to predict herbage intake during grazing more accurately. It was difficult to measure herbage refusals when herbage allowance was high because the moving cages flattened herbage, making it difficult to determine how much lay inside the area cut with the grass shears. To measure herbage allowance, measurements are taken to the side of the moving cages, where standing biomass might differ slightly (Martin et al., Reference Martin, Martin-Clouaire and Duru2016). As an alternate technique, measuring chemical markers may estimate herbage intake more accurately, as observed for other animal species (Mayes et al., Reference Niggli, Plagge, Reese, Fertl, Schmid, Brändli, Bärtschi, Pöpsel, Hermanowski, Hohenester and Grabmann1986). In addition, key variables (e.g. cage microclimate) that were not monitored during the experiments may explain this variability in herbage intake.
Another error may be related to modeling choices. We modeled herbage intake during grazing as a function of limits of N, OM and ADF intake (equations (4), (5) and (6)), the most restrictive of which was used to determine herbage intake (equation (7)). In practice, these limits may not exist; instead, a hierarchy of nutrients or fill capacity may restrict overall intake, as established for cattle (INRA, Reference Jouven and Baumont2007). Another modeling choice that could explain PASTRAB’s low accuracy in predicting herbage intake is based on our observations (Martin et al. (Reference Martin, Martin-Clouaire and Duru2016) and subsequent experiments). We assumed that rabbits eat all the complementary feed and hay offered, regardless of the herbage allowance. This assumption may be valid only for smaller amounts of herbage allowance. This aspect requires further investigation using larger amounts of herbage allowance.
As the simulation experiment illustrated, PASTRAB successfully produced knowledge about biophysical and economic performances of new management practices for fattening rabbits on pastures. Overall, during participatory workshops, all farmers considered model predictions realistic. A large number of simulations (from 6 to 12 per workshop) were conducted and they stimulated insightful discussions on farmer practices. For example, one farmer realized that he could improve HUE from 30% to 77% by reducing feed supplementation from 90 to 20 g/day and dividing the land area per rabbit by 3. He was positively surprised to realize that this would nearly not affect his gross margin while improving pasture renewal over the years. As observed in other workshops, he decided to adapt some of their management practices immediately after the workshops. Feedbacks from farmers were mainly positive. One farmer said ‘it is interesting to quickly visualize the impacts of a change in practices’. Another one explained that he would use it to adapt his practices depending on the seasons.
Perspectives for model development and use
PASTRAB focuses on the fattening period of rabbit production. For farmers, it is necessary to extend the model to the pre-weaning period, as for simulation models of cattle production systems (Romera et al., Reference van Ittersum, Leffelaar, Van keulen, Kropff, Bastiaans and Goudriaan2004; Jouven and Baumont, Reference Kalaugher, Bornman, Clark and Beukes2008). Decisions during the pre-weaning period can have a strong impact on fattening. Indicators such as average daily growth and gross margin must be calculated over the entire life cycle, because a decision to delay weaning could increase these indicators for the fattening period; however, these benefits of delaying weaning might decrease when including the pre-weaning period in the analysis. Again, simulation models developed for other species, such as cattle (Romera et al., Reference van Ittersum, Leffelaar, Van keulen, Kropff, Bastiaans and Goudriaan2004) and sheep (Cacho et al., Reference Cacho, Finlayson and Bywater1995), are useful sources of inspiration.
PASTRAB would also need to be adapted for farms that fatten rabbits in paddocks. Grazing management using moving cages is similar to rotational grazing. Cages are moved each day as if animals were placed in a new field. When using paddocks, grazing management is similar to continuous grazing, and grazing area per rabbit may be far larger (e.g. 5 to 25 m²/rabbit) than that in moving cages (e.g. 0.4 m²/rabbit per day). PASTRAB could be adapted to simulate the progressive decrease in herbage allowance in paddocks, which is slightly compensated for by herbage growth throughout the fattening period.
Another aspect that needs further development is integrating the effect of rabbit breed on intake and rabbit growth. For cattle, the diversity of existing breeds results in a diversity of animal size, weight, intake capacity, potential growth, etc. (INRA, Reference Jouven and Baumont2007). The same may apply to rabbit production, which requires investigating the influence of rabbit breed on overall performance. However, unlike cattle production systems in temperate areas, in which animals are mainly purebred, most conventional rabbit production systems use crossbreeds. However, some farmers use purebreds in organic rabbit production, but without genetic selection for performances or robustness for outdoor production.
PASTRAB will be made available to organic extension institutes and farmers for strategic planning to explore adaptations of current practices. It could also interest other stakeholders, including newcomers willing to design their production practices, consultants who support farmers, and educators who teach agricultural students interested in organic rabbit production. It will come with user guidelines and data on the feed values of several pasture types during different seasons so that users can use PASTRAB autonomously.
Acknowledgments
This study was funded by the INRA Metaprogram GISA (project PROF), the INRA division PHASE (project MarkPast) and the INRA AgriBio4 program (project CUNIPAT). The authors thank all the technicians involved in data collection and analysis.