Nomenclature
- UAV
-
unmanned aerial vehicle
- SUAV
-
solar-powered unmanned aerial vehicle
- PV
-
photovoltaic
- FCU
-
flight control unit
- SoC
-
state of charge
- GHI
-
Global Horizontal Irradiance
- DNI
-
Direct Normal Irradiance
- DHI
-
Diffuse Horizontal Irradiance
- AM
-
air mass
- BMS
-
battery management system
- MPPT
-
maximum power point tracking
- DC/DC
-
direct current to direct current
- PVC
-
polyvinyl chloride
- I
-
current
- V
-
voltage
- Li-ion
-
lithium-ion
- Wh
-
watt-hour
- W/m2
-
watts per square meter
- °C
-
degrees Celsius
-
 ${{\rm{G}}_{{\rm{sc}}}}$
-
solar constant
-
${G_{on}}$
-
degrees Celsius
-
${{\rm{G}}_{{\rm{cb}}}}$
-
beam radiation
-
${\rm{k}}$
-
attenuation coefficient
-
${\rm{e}}$
-
Euler’s number
-
${I_O}$
-
hourly radiation
-
${H_o}$
-
daily radiation
-
${\rm{A}}$
-
altitude
-
${\rm{a}}$
-
beam radiation model coefficients
-
${\rm{r}}$
-
empirical correction coefficients
-
${{\rm{I}}_{\rm{c}}}$
-
hourly solar irradiance on surface
-
${T_C}$
-
calculated temperature
-
${T_I}$
-
initial temperature
-
${H_R}$
-
relative altitude
-
${T_D}$
-
temperature lapse rate
-
$C$
-
capacity of the battery
-
${V_t}$
-
total voltage
-
$S$
-
number of series cells
-
${V_n}$
-
nominal voltage of a single cell
-
$P$
-
number of parallel cells
-
${E_t}$
-
total energy


Greek symbols
-
${\rm{\delta }}$
-
declination angle
-
${{\rm{\Omega }}_{\rm{s}}}$
-
sunset hour angle
-
${\theta _z}$
-
zenith angle
-
$n$
-
day of the year
-
$\omega $
-
hour angle
-
${{\rm{\tau }}_{\rm{b}}}$
-
beam transmittance ratio
-
${{\rm{\tau }}_{\rm{d}}}$
-
diffuse transmittance ratio
-
$\varphi $
-
latitude


1.0. Introduction
The demand for renewable energy sources is rapidly increasing due to both environmental sustainability goals and the need to reduce energy costs. Among renewable energy sources, solar energy stands out due to its high energy potential and minimal environmental impact. The advancement of photovoltaic (PV) technologies has enabled the efficient conversion of solar energy into electricity, expanding its potential applications, including unmanned aerial vehicles (UAVs). With ongoing research and development, solar cells are becoming increasingly efficient, allowing sunlight to be directly converted into electrical energy, further enhancing their viability for innovative energy solutions [Reference Guizani1–Reference Wu4].
With advancements in technology in recent years, solar-powered UAVs have been utilised across a wide range of fields. Notable applications include monitoring and spraying for plant health in agriculture, early detection of forest fires, cargo transportation, search and rescue operations, inspection of power lines and bridges, climate change research, monitoring of marine ecosystems, traffic management in smart city applications, as well as security and air quality monitoring. These applications have yielded effective results, demonstrating the versatility and efficiency of solar-powered UAVs [Reference Al Dhafari, Afzal, Al Abri and Khan5–Reference Tian, Haas and Shinde8].
This study examines the effects of solar irradiance, temperature and environmental factors on the flight performance and energy management of a fixed-wing UAV equipped with solar cells. Additionally, a comparative analysis was conducted with an identical UAV operating without solar cells. The primary objective of this study is to identify optimal operational scenarios for enhancing the energy efficiency of solar-powered UAVs and to assess their role in sustainable energy applications.
Over the past decade, a number of studies have advanced the field of solar-powered UAV, focusing on endurance enhancement and energy autonomy. Oettershagen et al. [Reference Oettershagen, Melzer, Mantel, Rudin, Stastny and Wawrzacz9, Reference Oettershagen, Melzer, Mantel, Rudin, Stastny, Wawrzacz, Hinzmann, Leutenegger, Alexis and Siegwart10] demonstrated the AtlantikSolar platform, a lightweight hand-launchable UAV capable of multi-day continuous flight through efficient solar–battery energy management, marking a major step toward perpetual flight capability. Building on this foundation, Mateja et al. [Reference Mateja, Skarka, Peciak, Niestrój and Gude11] developed a simulation model for energy autonomy of small solar UAVs, emphasising the importance of coupling aerodynamic performance with environmental factors such as irradiance and temperature. Similarly, Huang et al. proposed a three-dimensional flight path optimisation method for solar UAVs to maximise solar exposure and minimise power consumption [Reference Huang, Chen, Wang and Su12], while Lee and Yu integrated gravitational potential energy concepts into path planning for improving endurance [Reference Lee and Yu13].
Recent research on solar-powered UAVs has increasingly emphasised the importance of integrated energy management and realistic environmental modeling. For example, Fernandes et al. [Reference Fernandes, Santos and Rego14] conducted experimental evaluation of a small fixed-wing UAV equipped with thin-film photovoltaics and high-efficiency power tracking, demonstrating that the solar subsystem was able to sustain most of the cruise demand under favourable conditions.
Similarly, Zhang et al. [Reference Zhang, Zhang, Li and Guo15] focused on parameter analysis of solar-powered UAV power systems under non-ideal environmental factors (such as irradiance variation and ambient temperature), highlighting how these external conditions can significantly degrade performance if unaddressed. In another contribution, Gao et al. [Reference Gao, Qiao, Pei, Wu and Bai16] proposed an energy-management strategy for solar-powered UAVs that combines particle-swarm optimisation of climb and glide phases, demonstrating up to 68% energy savings in the climb stage under realistic mission profiles. However, most of these studies either rely on generalised atmospheric assumptions or neglect the quantitative influence of localised irradiance and temperature variations on mission-level energy balance. The present work addresses this gap by developing a region-specific numerical model for Central Anatolia, Türkiye, incorporating realistic environmental parameters such as irradiance, temperature and cloud cover into the solar–battery interaction framework.
In this study, a fixed-wing solar-powered UAV was developed and modeled to analyse the influence of solar irradiance, ambient temperature and environmental conditions on flight performance and energy management. A dynamic simulation model was established to estimate the energy flow between the solar panels, battery system and propulsion unit under realistic mission profiles. A comparative analysis was conducted between solar-assisted and conventional battery-powered configurations to quantify the improvement in flight endurance and overall energy efficiency.
The novelty of this work lies in the development of an integrated hybrid energy model that couples solar energy input, battery state of charge and aerodynamic performance under realistic weather conditions. Furthermore, the study provides a comprehensive comparative analysis between solar-assisted and conventional UAV configurations, offering quantitative insights into the endurance and energy balance advantages of solar integration. In addition, the UAV and energy system were specifically designed and modeled for the solar and thermal environment of Central Anatolia, Türkiye, thereby contributing region-specific insights into the operation of solar-powered UAVs under mid-latitude conditions.
The remainder of this paper is structured as follows: Section 2 introduces the UAV system and the mathematical modeling framework. Section 3 presents the simulation setup and analysis methodology. Section 4 discusses the results and comparative findings and Section 5 concludes with key insights and directions for future work, including experimental validation efforts.
2.0. Solar energy generation and environmental factors
2.1. Irradiance
Solar irradiance is a fundamental factor in energy generation for PV cells. Solar cells absorb incoming sunlight on their surface and convert it into electrical energy. The performance of PV cells is directly dependent on irradiance levels, which are significantly influenced by variables such as geographical location, time of day and seasonal variations [Reference Kalogirou17–Reference Rydh and Sandén19]. Although the Sun generates a constant amount of energy, the rotation of the Earth and its elliptical orbit cause variations in the amount of solar irradiance received at a specific location throughout the day. To determine the amount of energy produced by solar cells, it is essential to calculate the solar irradiance reaching the surface. This calculation is performed using mathematical models and radiation transfer equations that account for the Earth’s position relative to the Sun [Reference Kalogirou17, Reference Aktas, Kirçiçek, Hayton and Reading20–Reference Page22]. To calculate the solar energy received at a specific location, equations that incorporate the angular position of the Earth relative to the Sun are used. Declination (
 $\delta $
) is defined as the angle between the line directed toward the Sun and the equatorial plane [Reference Mateja, Skarka, Peciak, Niestrój and Gude11]
 \begin{equation}\delta = 23.45 \times \sin \left( {\frac{{360}}{{365}} \times \left( {284 + n{\rm{\;}}} \right)} \right)\end{equation}
where
 $n$
represents the day of the year. The declination angle varies between (−23.45°) and (+23.45°), reaching its maximum positive value during the summer solstice and its minimum negative value during the winter solstice. Declination remains the same for all locations on Earth and serves as a fundamental parameter in solar irradiance calculations. The hour angle (ω) is an angular measure that represents the position of the Sun relative to the observer’s local meridian, changing approximately 15° per hour [Reference Mateja, Skarka, Peciak, Niestrój and Gude11]. It takes negative values before solar noon and positive values after solar noon. Solar time, which is used in hour angle calculations, differs from local time as it is based on the moment when the Sun reaches its highest point in the sky at a given location. This time system is determined by the apparent daily motion of the Sun. The hour angle can be calculated using Equation (2).
 \begin{equation}\omega = {15^o} \times ( {Solar{\rm{\;}}time - 12})\end{equation}
The hour angle
 $\left( \omega \right)$
ranges from (−180°) to (+180°), where negative values represent the time before solar noon and positive values correspond to the time after solar noon.
The zenith angle
 ${\theta _z}$
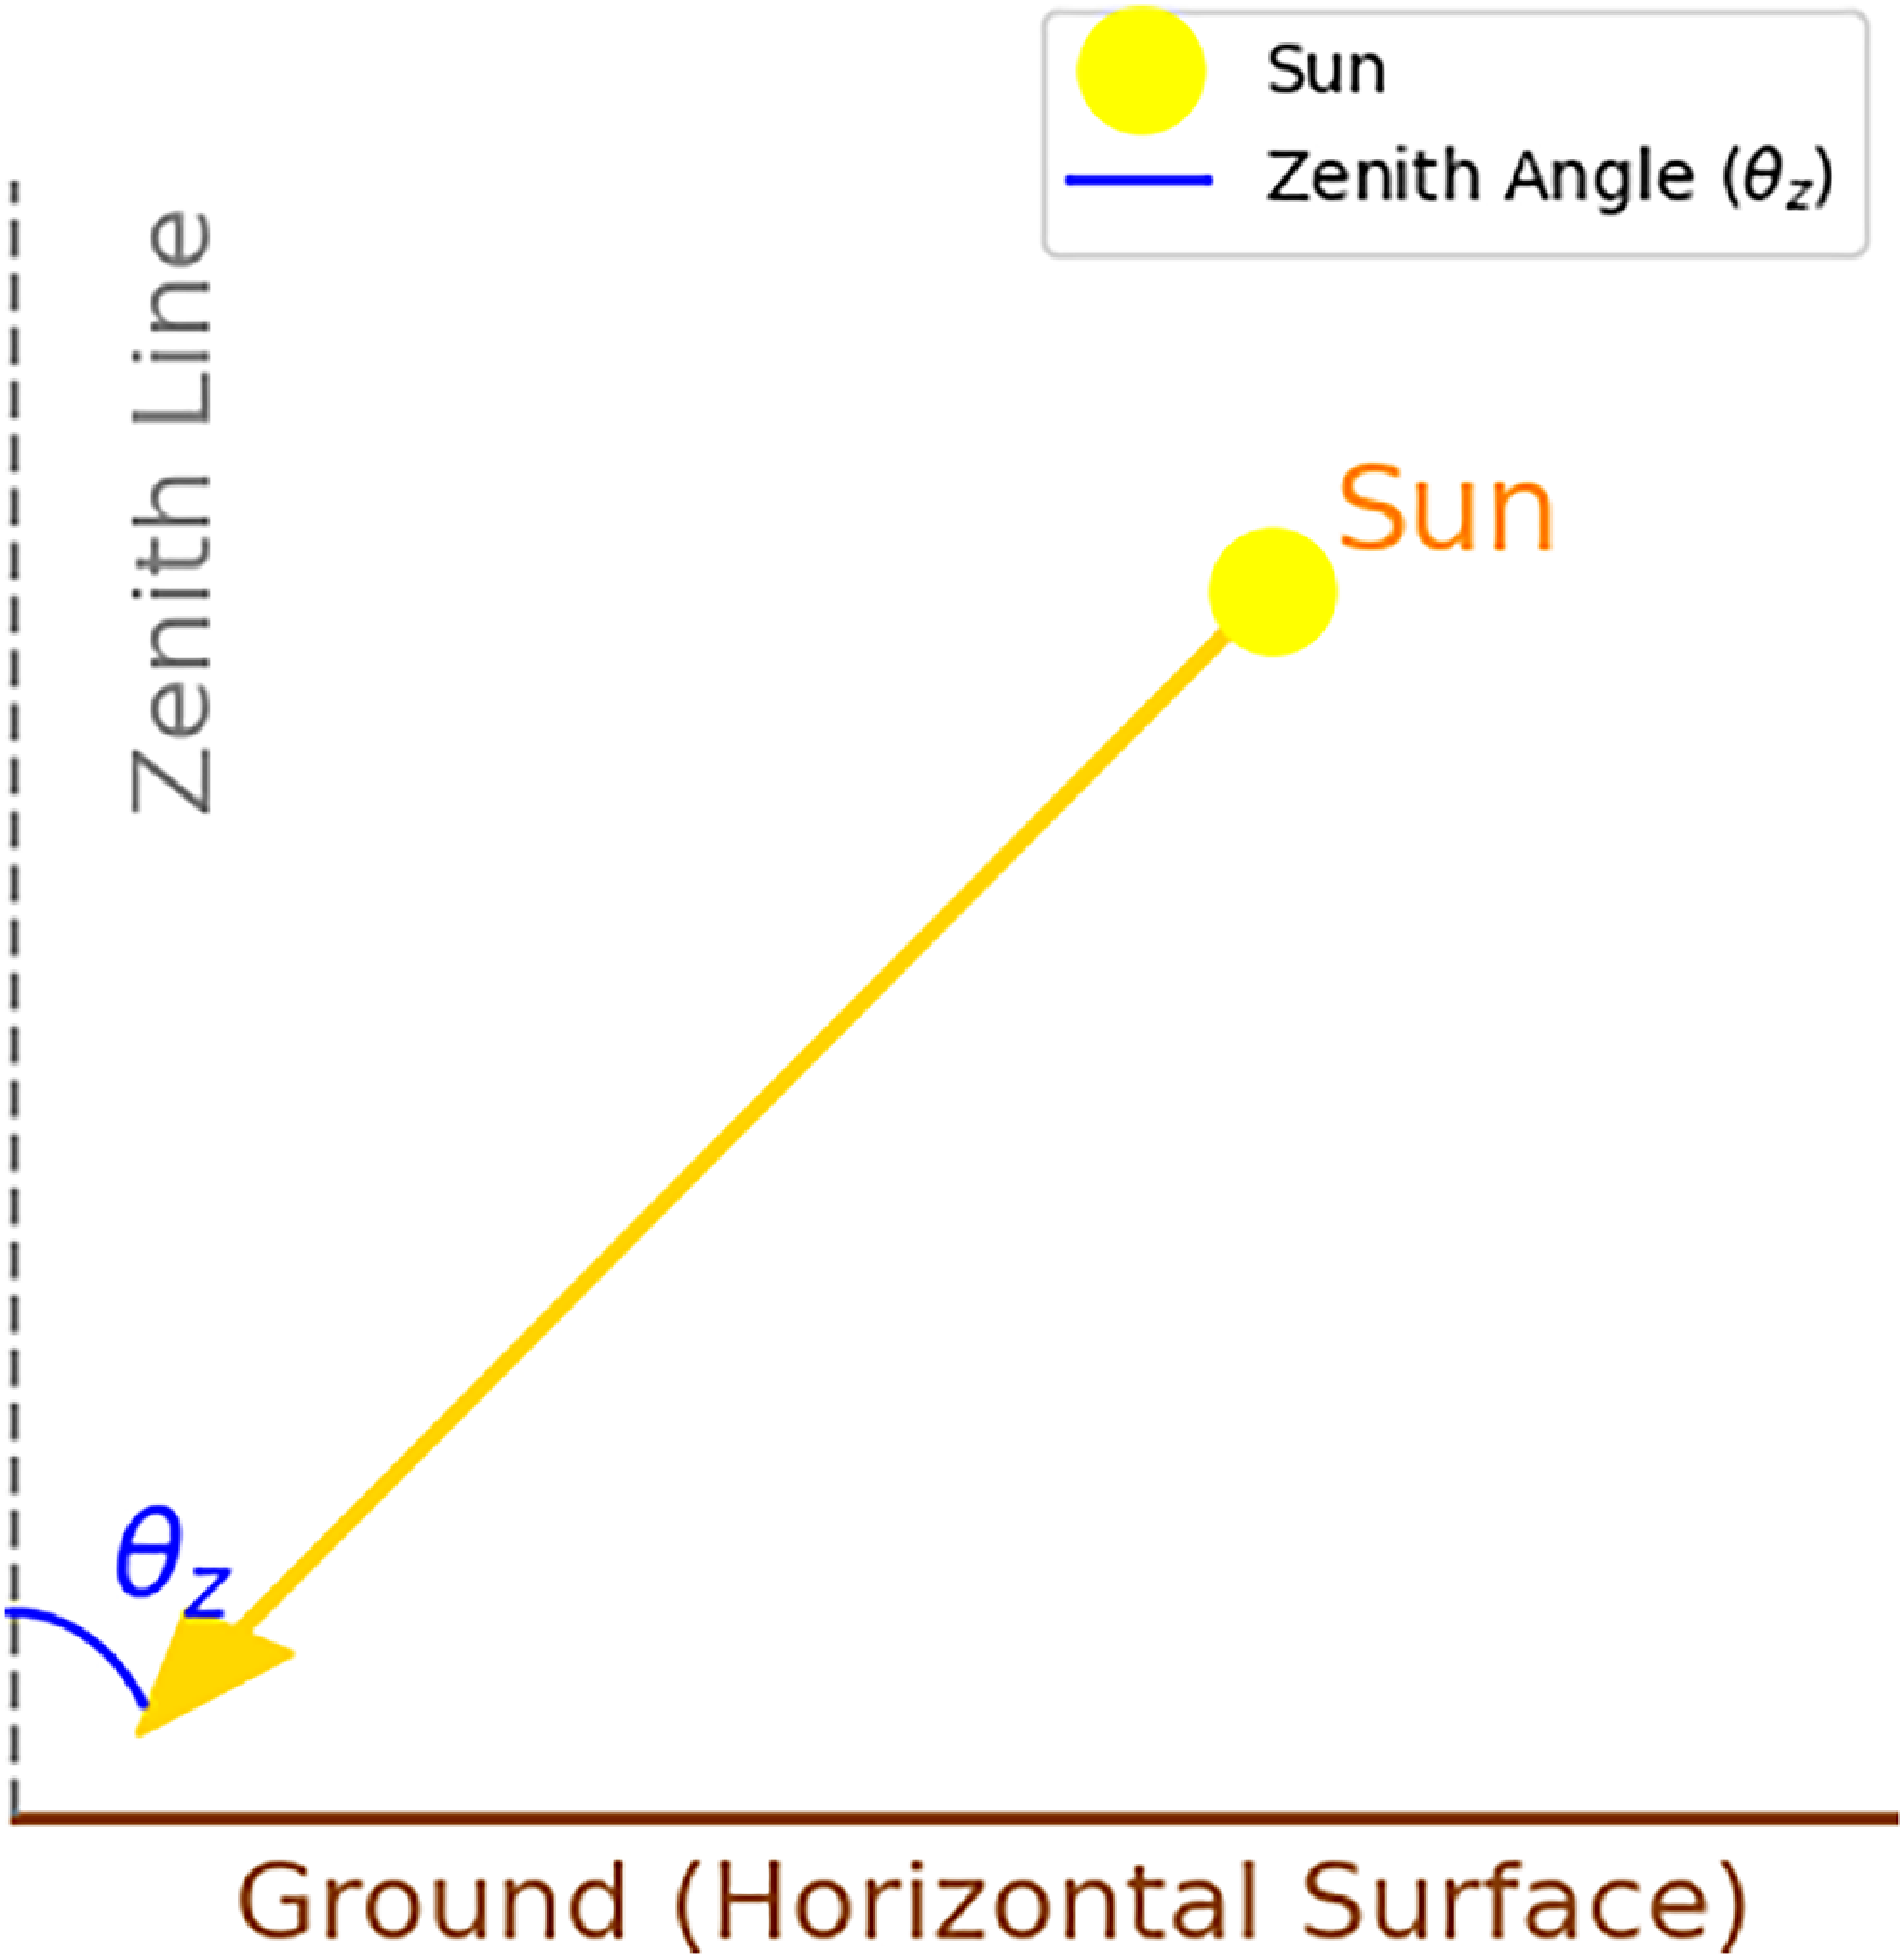
is the angle between the incoming solar irradiation and a horizontal surface, making it a crucial parameter in determining the angle at which solar irradiance reaches the surface. The representation of the zenith angle is illustrated in Fig. 1. The zenith angle can be expressed using the following equation:
 \begin{equation} {\theta _z} = \cos (\varphi ) \times \cos \left( \delta \right) \times \cos \left( {{\rm{\;}}\omega } \right) + {\rm{sin}}\left( {{\rm{\;}}\varphi } \right) \times {\rm{sin}}\left( \delta \right)\end{equation}
 $\varphi $
represents the latitude and is converted to radians using the expression
 $\varphi = latitude{\rm{\;}} \times {\rm{\;}}\pi /180$
. The zenith angle
 $({\theta _z})$
ranges from 0° to 90°, where
 ${\theta _z} = {0^o}$
indicates that the Sun is directly overhead, and
 ${\theta _z} = {90^o}$
corresponds to sunset or sunrise. The day length
 $({\rm{N}}$
) can be calculated using the following equation:
 \begin{equation}{\rm{N}} = \frac{2}{{15}} \times {\rm{Arccos}}\left( { - {\rm{tan\varphi \;}} \times {\rm{tan\delta }}} \right)\end{equation}
when
 ${\theta _z} = {0^o}$
means the Sun is directly overhead at the top of the atmosphere, the solar irradiance reaching the surface
 $\left( {{G_{on}}} \right)$
is determined based on the solar constant
 $({G_{sc}})$
and the specific day of the year
 $\left( n \right)$
. It is calculated using the following equation:
 \begin{equation}{G_{on}} = {G_{sc}} \times \left[ {1 + 0.033 \times {\rm{cos}}\frac{{360 \times {\rm{n}}}}{{365}}} \right]\end{equation}
Illustration of the solar zenith angle.

Since the Earth’s orbit is elliptical, the distance between the Sun and the Earth varies by approximately 3.3% throughout the year. This variation affects the amount of solar irradiance reaching the Earth, contributing to seasonal differences. The solar constant
 ${G_{sc}}$
is considered an average value and is taken as 1367 W/m².
The hourly radiation
 ${I_o}$
and daily radiation
 ${H_o}$
can be calculated using the following equations:
 \begin{eqnarray} {I_O} &=& \frac{{12 \times 3600}}{\Pi } \times {G_{sc}} \times \left[ {1 + 0.033 \times cos\frac{{360 \times n}}{{365}}} \right]\nonumber\\&& \times [cos\left( \varphi \right) \times {\rm{cos}}\left( {{\rm{\;}}\delta } \right) \times \left( {sin{\omega _2} - sin{\omega _2}} \right) \times \frac{{\pi {\rm{\;}} \times {\rm{\;}}({w_2} - {w_{1)}} }}{{180}} \times sin\left( \varphi \right) \times \sin \left( {{\rm{\;}}\delta } \right)\end{eqnarray}
 ${\omega _2}$
and
 ${\omega _1}$
represent the hour angles corresponding to the selected time intervals.
 ${{\rm{\omega }}_{\rm{s}}}$
denotes the solar hour angle at sunrise and sunset, which defines the maximum hour angle, indicating the times when the Sun rises and sets.
 \begin{eqnarray}{{\rm{H}}_{\rm{o}}} &=& \frac{{24 \times 3600}}{{\rm{\pi }}} \times {{\rm{G}}_{{\rm{sc}}}} \times \left[ {1 + 0.033 \times {\rm{cos}}\frac{{360 \times {\rm{n}}}}{{365}}} \right] \nonumber\\&&\times\; {\rm{cos}}\left( {\rm{\varphi }} \right) \times {\rm{cos}}\left( {\rm{\delta }} \right) \times {\rm{sin}}{{\rm{\omega }}_{\rm{s}}} + \frac{{{\rm{\pi }} \times {{\rm{\omega }}_{\rm{s}}}}}{{180}} \times {\rm{sin\;\varphi }} \times {\rm{sin\;\delta }}\end{eqnarray}
The unit of hourly radiation is expressed as
 $\frac{J}{{{m^2}}}$
, while the unit of daily irradiation is
 $\frac{J}{{day{\rm{\;}} \times {\rm{\;}}{m^2}}}$
To convert these values into watt-hours (Wh), appropriate unit conversions are applied.
The air mass (AM) represents the path length that solar irradiation travels through the atmosphere before reaching the Earth’s surface and is calculated using the following equation [Reference Lee and Yu13, Reference Zhang, Zhang, Li and Guo15]:
 \begin{equation} {\rm{AM}} = \frac{{{\rm{path\;length\;travelled}}}}{{{\rm{vertical\;depth\;of\;the\;atmosphere}}}} = \frac{1}{{{\rm{cos}}{{\rm{\theta }}_{\rm{z}}}}}\end{equation}
Studies in the literature have developed a method for estimating solar irradiation transmitted under clear atmospheric conditions, considering zenith angle and altitude for standard atmospheric conditions and four different climate types [Reference Lee and Yu13, Reference Gao, Qiao, Pei, Wu and Bai16]. In solar energy systems, the two most significant types of radiation are beam radiation and diffuse radiation. Beam radiation refers to solar irradiance that reaches the Earth’s surface without being scattered by the atmosphere, while diffuse radiation is scattered in multiple directions by the atmosphere, with only a portion reaching the surface [Reference Mateja, Skarka, Peciak, Niestrój and Gude11]. The beam radiation (G cb ) can be calculated using the following equation:
 \begin{equation} {{\rm{G}}_{{\rm{cb}}}} = {{\rm{\tau }}_{\rm{b}}} \times {{\rm{G}}_{{\rm{on}}}} \times \left[ {{\rm{cos}}\left( {\rm{\varphi }} \right) \times \cos \left( {\rm{\delta }} \right) \times \cos \left( {\rm{\omega }} \right) + \sin \left( {\rm{\varphi }} \right) \times \sin \left( {\rm{\delta }} \right)} \right]\end{equation}
where
 $\tau_{b}$
represents the ratio of transmitted beam radiation to the total radiation incident at the top of the atmosphere. This ratio can be calculated using the following equation:
 \begin{equation} {{\rm{\tau }}_{\rm{b}}} = \frac{{{{\rm{G}}_{{\rm{cb}}}}}}{{{{\rm{G}}_{\rm{o}}}}} = {{\rm{a}}_0} + {{\rm{a}}_1} \times {{\rm{e}}^{\left( {\frac{{ - {\rm{k}}}}{{{\rm{cos}}{{\rm{\theta }}_{\rm{z}}}}}} \right)}}\end{equation}
The hourly solar irradiance reaching the Earth’s surface is represented by
 ${G_o}$
, while the total solar irradiance incident on the surface at the top of the atmosphere is denoted as
 ${G_{on}}$
.
 \begin{equation} {G_o} = {G_{on{\rm{\;}}}} \times cos{\rm{\;}}{\theta _z} \end{equation}
The coefficients
 $\;{{\rm{a}}_0}$
,
 ${{\rm{a}}_1}$
and
 $k$
are constants calculated using Equation (12).
 \begin{align} {{\rm{a}}_0} &= {{\rm{r}}_0} \times (0.4237 - 0.00821 \times {\left( {6 - {\rm{A}}} \right)^2})\nonumber\\ {{\rm{a}}_1} &= {{\rm{r}}_1} \times \left( {0.5055 - 0.00595 \times {{\left( {6.5 - {\rm{A}}} \right)}^2}} \right)\\ {\rm{k}} &= {{\rm{r}}_{\rm{k}}} \times \left( {0.2711 - 0.01858 \times {{\left( {2.5 - {\rm{A}}} \right)}^2}} \right)\nonumber\end{align}
where
 ${\rm{\;}}A$
represents the altitude of the region above sea level, expressed in meters (m). These equations are valid only when the condition
 $A \lt 2.5$
is satisfied. In mid-latitude regions and during summer months, the values of
 ${{\rm{r}}_0}$
,
 ${{\rm{r}}_1}$
and
 ${{\rm{r}}_{\rm{k}}}$
are determined as 0.97, 0.99 and 1.02, respectively [Reference Mateja, Skarka, Peciak, Niestrój and Gude11, Reference Duffie, Beckman and Blair21, Reference Hottel23].
The diffuse solar irradiance (G cd ) can be calculated using the following equation:
 \begin{equation} {{\rm{G}}_{{\rm{cd}}}} = {{\rm{\tau }}_{\rm{d}}} \times {{\rm{G}}_{{\rm{on}}}} \times \left[ {{\rm{cos}}\left( {\rm{\varphi }} \right) \times \cos \left( {\rm{\delta }} \right) \times \cos \left( {\rm{\omega }} \right) + \sin \left( {\rm{\varphi }} \right) \times \sin \left( {\rm{\delta }} \right)} \right]\end{equation}
where
 $\tau_{b}$
, represents the ratio of transmitted diffuse radiation to the total radiation incident at the top of the atmosphere. This ratio can be determined using Equation (14).
 \begin{equation} {{\rm{\tau }}_{\rm{d}}} = \frac{{{{\rm{G}}_{{\rm{cd}}}}}}{{{{\rm{G}}_{\rm{o}}}}} = 0.271 - 0.294 \times {{\rm{\tau }}_{\rm{b}}}\end{equation}
Using the equations above, it is possible to calculate the total irradiance required to determine the energy that can be harvested by solar cells. The total solar irradiance (G c ) reaching a horizontal surface on Earth can be expressed using the following equation.
 \begin{eqnarray} {{\rm{G}}_{\rm{c}}} &=& {{\rm{G}}_{{\rm{cb}}}} + {{\rm{G}}_{{\rm{cd}}}} = \left( {{{\rm{\tau }}_{\rm{b}}} + {{\rm{\tau }}_{\rm{d}}}} \right) \times {{\rm{G}}_{{\rm{sc}}}} \nonumber\\[5pt]&&\times \left[ {1 + 0.033 \times {\rm{cos}}\frac{{360 \times {\rm{n}}}}{{365}}\left] \times \right[{\rm{cos}}\left( {\rm{\varphi }} \right) \times {\rm{cos}}\left( {\rm{\delta }} \right) \times {\rm{cos}}\left( {\rm{\omega }} \right) + {\rm{sin}}\left( {\rm{\varphi }} \right) \times {\rm{sin}}\left( {\rm{\delta }} \right)} \right] \end{eqnarray}
The hourly solar irradiance (I c ) reaching a horizontal surface can be expressed using the following equation.
 \begin{eqnarray} {{\rm{I}}_{\rm{c}}} &=& \frac{{12 \times 3600}}{{\rm{\pi }}} \times \left( {{{\rm{\tau }}_{\rm{b}}} + {{\rm{\tau }}_{\rm{d}}}} \right) \times {{\rm{G}}_{{\rm{sc}}}} \times \left[ {1 + 0.033 \times {\rm{cos}}\frac{{360 \times {\rm{n}}}}{{365}}} \right]\nonumber\\[5pt] && \times \left[ {{\rm{cos}}\left( {\rm{\varphi }} \right) \times \cos \left( {\rm{\delta }} \right) \times \left( {{\rm{sin}}{{\rm{\omega }}_2} - {\rm{sin}}{{\rm{\omega }}_1}} \right) + \frac{{{\rm{\pi }} \times \left( {{{\rm{\omega }}_2} - {{\rm{\omega }}_1}} \right)}}{{180}} \times {\rm{sin\varphi }} \times {\rm{sin\delta }}} \right] \end{eqnarray}
A numerical analysis was conducted using these equations. The results of the sample numerical analysis based on these equations are presented in Fig. 2, illustrating the hourly solar irradiance values obtained for the Kayseri region (38.7°N, 35.5°E; elevation ≍ 1050 m) in July. Kayseri is located in Central Anatolia, Türkiye, and is characterised by a continental climate with high solar irradiance and low humidity, making it a representative location for evaluating the performance of solar-powered UAV systems.
Hourly variation of Global Horizontal (GHI), Direct Normal (DNI) and Diffuse Horizontal (DHI) solar irradiance throughout a typical July day in the Central Anatolia region, illustrating the diurnal distribution of solar energy components under clear-sky conditions.

Figure 2 Long description
A line graph displays the hourly variation of solar irradiance throughout a typical July day in the Central Anatolia region. The graph features three distinct data series: Global Horizontal Irradiance (GHI) in yellow, Direct Normal Irradiance (DNI) in red, and Diffuse Horizontal Irradiance (DHI) in blue. The x-axis represents the hour of the day, ranging from 0 to 22, while the y-axis indicates irradiance in watts per square meter, scaling from 0 to 1000. The graph illustrates the diurnal distribution of solar energy components under clear-sky conditions, with GHI peaking around midday and DNI following a similar pattern but with slightly lower values. DHI shows a smaller peak and remains relatively low throughout the day. The lines for GHI and DNI rise sharply in the morning, reach their maximum around noon, and then gradually decline in the afternoon, while the DHI line shows a more gradual increase and decrease.
As solar radiation passes through the atmosphere, it is divided into different components, which are fundamental parameters in the performance analysis of solar energy systems. Solar irradiance consists of three main components: Global Horizontal Irradiance (GHI), Direct Normal Irradiance (DNI) and Diffuse Horizontal Irradiance (DHI). GHI refers to the total solar irradiance received on a horizontal surface and is the sum of DNI and DHI. DNI represents the amount of solar radiation received directly from the Sun without atmospheric scattering. DHI refers to the fraction of solar radiation that is scattered by atmospheric gases, aerosols and clouds, reaching the surface from multiple directions [Reference Eissa, Marpu, Gherboudj, Ghedira, Ouarda and Chiesa24].
2.2 Effect of cloudiness
Clouds have a significant effect on solar irradiation, and this effect depends on the type, density and location of the clouds. Clouds block solar irradiation, reducing the energy reaching the surface. This negatively affects the performance of PV systems. In general, clouds can be classified into three main categories. These are high-level clouds (e.g. cirrus), mid-level clouds (e.g. altostratus) and low-level thick clouds (e.g. cumulonimbus). While high-level clouds do not significantly affect irradiation, low-level clouds significantly block solar irradiation, negatively affecting energy production [Reference Dumka, Kosmopoulos, Ningombam and Masoom25–Reference Mestnikov, Vasilyev, Davydov, Khoyutanov and Alzakkar27].
Cloud cover is evaluated using the okta scale, which quantifies the proportion of the sky covered by clouds. This scale ranges from 0 (completely clear sky) to 8 (completely overcast) [Reference Jebar, Parisi, Downs and Turner28]. The impact of cloud cover on solar irradiance is illustrated in Fig. 3.
Effect of cloud cover on solar irradiance transmission.

Figure 3 Long description
A line graph titled 'Effect of Cloud Cover on Solar Irradiance' displays the relationship between cloud cover and solar irradiance transmission. The x-axis represents the Okta cloud cover scale ranging from 0 to 8, while the y-axis represents irradiance transmission in percentage, ranging from 0 to 100 percentage. The graph shows a downward trend, indicating that as cloud cover increases, solar irradiance transmission decreases. Key data points include 100 percentage transmission at 0 Okta, 98 percentage at 1 Okta, 94 percentage at 2 Okta, 88 percentage at 3 Okta, 79 percentage at 4 Okta, 70 percentage at 5 Okta, 54 percentage at 6 Okta, 50 percentage at 7 Okta, and 27 percentage at 8 Okta. All values are approximated.
In the cloud cover scale, values above 8 oktas are generally associated with a completely overcast sky, where a significant portion of solar irradiance is lost. Studies in the literature indicate that understanding the impact of cloud cover on solar irradiance is crucial for the efficient design and operation of solar energy systems [Reference Myers29–Reference Wacker, Gröbner, Zysset, Diener, Tzoumanikas, Kazantzidis, Vuilleumier, Stöckli, Nyeki and Kampfer31].
In the simulation model developed for this study, the effect of cloudiness on solar irradiance was explicitly incorporated to ensure realistic environmental modeling. The solar irradiance incident on the PV surface, denoted by I, was adjusted according to the empirical cloud transmittance relationship proposed by Kasten and Czeplak [Reference Kasten and Czeplak32], expressed as:
 \begin{equation} I = {I_0}\left( {1 - 0.75\;X\;c{c^{3.4}}} \right)\end{equation}
where
 ${I_0}$
represents the clear-sky global irradiance (i.e. the irradiance in the absence of clouds) and cc denotes the fractional cloud cover, ranging from 0 (completely clear sky) to 1 (fully overcast conditions). This formulation quantifies the attenuation of solar radiation as a function of cloudiness and has been widely adopted in solar energy performance and atmospheric transmittance modeling.
For the numerical simulations in this study, July was selected as the representative month for the Kayseri region because it exhibits the highest average solar irradiance and the lowest mean cloud cover, providing optimal conditions for evaluating solar-powered UAV performance. According to meteorological data from the Turkish State Meteorological Service (TSMS), the average cloud cover fraction in Kayseri during July ranges between 0.15 and 0.20, corresponding to predominantly clear-sky conditions. Therefore, the inclusion of this cloud attenuation model ensures that the solar energy calculations realistically reflect the influence of atmospheric variability while focusing on the most favourable operational period for solar-powered UAV missions.
2.3 Effect of temperature
Temperature is a critical factor affecting the efficiency of solar cells. As temperature increases, the efficiency of solar cells decreases, negatively impacting the energy conversion process [Reference Wu, Li, Roibás-Millán, Alonso-Moragón and Jiménez-Mateos33]. Each solar cell has a temperature coefficient, which is associated with voltage, current and power parameters, determining the effect of temperature variations on its performance. An increase in temperature degrades the electrical properties of the cells, leading to a reduction in power output and overall efficiency [Reference Duffie and Beckman34, Reference Kazem and Chaichan35].
With every 100-meter increase in altitude, the air temperature decreases by approximately 0,5∼1°C. The distribution of air temperature is largely influenced by latitude, altitude, seasonal variations and topographical features. These temperature drop calculations remain valid up to the tropopause, where the upper atmospheric layer maintains a stable temperature reaching approximately (−51°C). This temperature level is sustained up to an altitude of 20 km [Reference Mateja, Skarka, Peciak, Niestrój and Gude11].
The decline in solar cell efficiency with increasing temperature is primarily related to the heating of the solar cell under solar irradiation and its reduced heat dissipation capacity in high ambient temperatures. Operating PV panels at elevated temperatures not only results in lower electrical power output but also accelerates the degradation process of solar cells, reducing their long-term performance and reliability [Reference Al-Luhaiby36].
The current ambient temperature is correlated with flight altitude and can be calculated using the following equation,
 \begin{equation} {T_C} = {T_I} - \left[ {{H_R}{\rm{\;}}x{\rm{\;}}\left( {{T_D}{\rm{\;}}x{\rm{\;}}100} \right)} \right]\end{equation}
where
 ${T_C}$
represents the temperature at the flight altitude,
 ${T_I}$
is the temperature at ground level,
 ${H_R}$
denotes the relative altitude in meters and
 ${T_D}$
refers to the temperature lapse rate. According to this calculation, when the relative humidity is below 100%, the temperature decreases by approximately 1°C per 100 meters of altitude gain. However, when the relative humidity reaches 100%, the release of latent heat due to condensation slows the temperature decline, resulting in a decrease of approximately 0.6°C per 100 meters [Reference Hemond and Fechner37].
Another critical component affected by temperature is lithium-ion (Li-ion) batteries. The sensitivity of Li-ion batteries to temperature variations is a key factor directly influencing their performance. The optimal operating temperature range for Li-ion batteries is between 25°C and 30°C [Reference Carnovale and Li38]. At low temperatures, the viscosity of the electrolyte increases, leading to a reduction in ionic conductivity and a rise in internal resistance. At (−20°C), in particular, the charge transfer resistance increases significantly, causing a substantial decline in both capacity and power output. Under high temperature conditions, the performance of Li-ion batteries is influenced by more complex mechanisms. Heat generation becomes a significant factor, especially during rapid charging and discharging. Excessive internal temperatures lead to capacity degradation and power loss [Reference Ma, Jiang, Tao, Song, Wu, Wang, Deng and Shang39].
2.4 Pollution of air and solar cells
Air pollution and solar cell contamination are two key environmental factors that significantly reduce the efficiency of PV panels. Air pollution weakens solar irradiation as it enters the atmosphere through reflection, scattering and absorption, thereby reducing the amount of sunlight reaching the panels [Reference Song, Liu and Yang40]. However, it is very difficult to measure these data precisely due to the continuous variability of environmental conditions. Pollutants such as dust layer, smoke and soot particles from industrial emissions, and dew, which accumulate at different levels on the surface of the solar cell, cause negative effects on its performance by reducing the light receiving capacity of the panel [Reference Kazem and Chaichan35].
In order to better understand the effects of pollutants deposited on solar cells and to minimise these effects, the classification of pollutants is of great importance. This classification facilitates the identification of pollution sources and seasonal changes. Pollutants can be generally divided into three main categories. The first category is pollutants of atmospheric origin and includes airborne particulate matter such as dust, smoke and soot. The second category consists of pollutants due to environmental factors. This group includes pollutants of natural origin such as hoarfrost, snow, pollen and organic materials. The third category consists of pollutants of local origin and includes substances such as particles emitted from industrial areas or soil transported from agricultural areas. Such categorisation allows the development of effective cleaning protocols for solar cells in a given geographical area.
The effects of air and surface pollution on the power supply systems of solar-powered UAVs should also be carefully analysed. The intensity and impact of pollutants are directly related to the mission duration of the UAV. While instantaneous pollution is usually negligible during short duration missions, pollutant accumulation becomes a significant problem during long duration missions and necessitates regular cleaning. Therefore, the effects of pollution should be evaluated by considering the time and mission duration parameters.
While some pollutants have instantaneous effects and cause short-term performance losses, others may cause permanent performance decreases in the long term. For example, while the accumulation of hoarfrost and snow in winter months temporarily reduces the radiation absorption capacity of solar cells, dust accumulation in summer months can cause longer and permanent performance losses. These effects are related to both atmospheric pollution and environmental factors and vary depending on seasonal variations [Reference Mateja, Skarka, Peciak, Niestrój and Gude11].
2.5 Flight path and solar irradiation angle
The flight duration of solar-powered UAVs is directly related to solar irradiance angle and flight path optimisation. To achieve maximum energy generation, the irradiance angle must be maintained at an optimal level. The angle of incoming sunlight is determined by the aircraft’s position, tilt angle and orientation. An optimal flight path should be designed considering these factors to ensure maximum solar irradiance exposure throughout the day [Reference Huang, Chen, Wang and Su12].
In this study, gravitational potential energy utilisation is incorporated into flight path optimisation to extend the flight duration of solar-powered UAVs. Particularly during night flights, the excess energy harvested during the daytime allows the UAV to ascend to higher altitudes, accumulating potential energy. This stored energy is then gradually released during the night, enabling the UAV to glide downward efficiently, thereby optimising energy consumption and extending operational endurance [Reference Lee and Yu13].
Additionally, meteorological variables must be considered during flight path planning. For instance, UAVs operating at lower altitudes are more susceptible to atmospheric variations, while determining the optimal flight angle and altitude enhances long-term endurance. Real-time optimisation algorithms can continuously adjust the UAV’s flight path by accounting for variables such as wind conditions, air density and cloud cover. The optimisation of flight trajectory and solar irradiance angle is regarded as a critical parameter for maximising energy harvested from solar cells and extending the UAV’s flight duration [Reference Tkachyck, Kotcemyr, Sokolovskyi and Bilous41].
3.0 Materials and methods – simulation model
In this study, a simulation model was developed to evaluate the effects of solar cell integration on energy consumption, flight duration and battery management in fixed-wing UAVs. The simulation models flight dynamics by considering the aerodynamic performance, energy management system and environmental factors of the UAV.
3.1 UAV characteristics
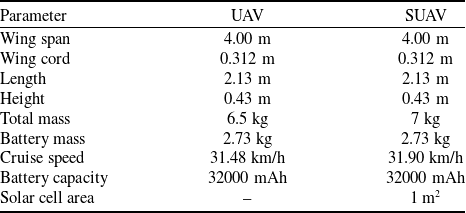
To compare two different flight scenarios, two UAV models with identical physical characteristics and aerodynamic parameters were utilised. The key distinction between these models is that one is equipped with solar cells integrated into the wing surface, while the other operates solely on battery power. Additionally, the integration of solar cells on the wing surface results in a 500 g increase in weight. The fundamental technical specifications of the UAV models used in this study are presented in Table 1.
Technical specifications of UAV with solar cells and UAV without solar cells models

Table 1 Long description
The table compares the technical specifications of two UAV models, one with solar cells and one without. It has two columns and eight rows. The columns are labeled UAV and SUAV. The rows are labeled with parameters: Wing span, Wing cord, Length, Height, Total mass, Battery mass, Cruise speed, Battery capacity, and Solar cell area. Both models have identical wing spans of 4.00 meters, wing cords of 0.312 meters, lengths of 2.13 meters, and heights of 0.43 meters. The UAV without solar cells has a total mass of 6.5 kilograms, while the UAV with solar cells has a total mass of 7 kilograms due to the added weight of solar cells. Both models have the same battery mass of 2.73 kilograms and battery capacity of 32000 milliampere-hours. The cruise speed of the UAV without solar cells is 31.48 kilometers per hour, while the UAV with solar cells has a cruise speed of 31.90 kilometers per hour. The solar cell area for the UAV with solar cells is 1 square meter.
Table 1 presents the main technical specifications of the two UAV configurations analysed in this study: the conventional UAV (without solar cells) and the solar-powered UAV (SUAV). Both platforms share the same geometric characteristics, featuring a wingspan of 4.0 m, a mean aerodynamic chord of 0.312 m and an overall fuselage length of 2.13 m with a height of 0.43 m.
The total mass of the conventional UAV is 6.5 kg, whereas the solar-powered variant weighs 7.0 kg due to the addition of solar modules and related power electronics. Both configurations utilise the same battery system, consisting of 60 Panasonic NCR18650B Li-ion cells connected in a 6S10P configuration, providing a total capacity of 32 Ah (32,000 mAh) and a battery mass of 2.73 kg. The cruise speed for the UAV and SUAV is approximately 31.48 km/h and 31.90 km/h, respectively. The SUAV version includes PV cells covering an active surface area of approximately 1 m², installed on the upper surface of the wings, which contributes to in-flight power generation and enhanced endurance. These specifications ensure that both aircraft are aerodynamically identical, allowing direct comparison of performance differences solely due to the inclusion of solar energy harvesting.
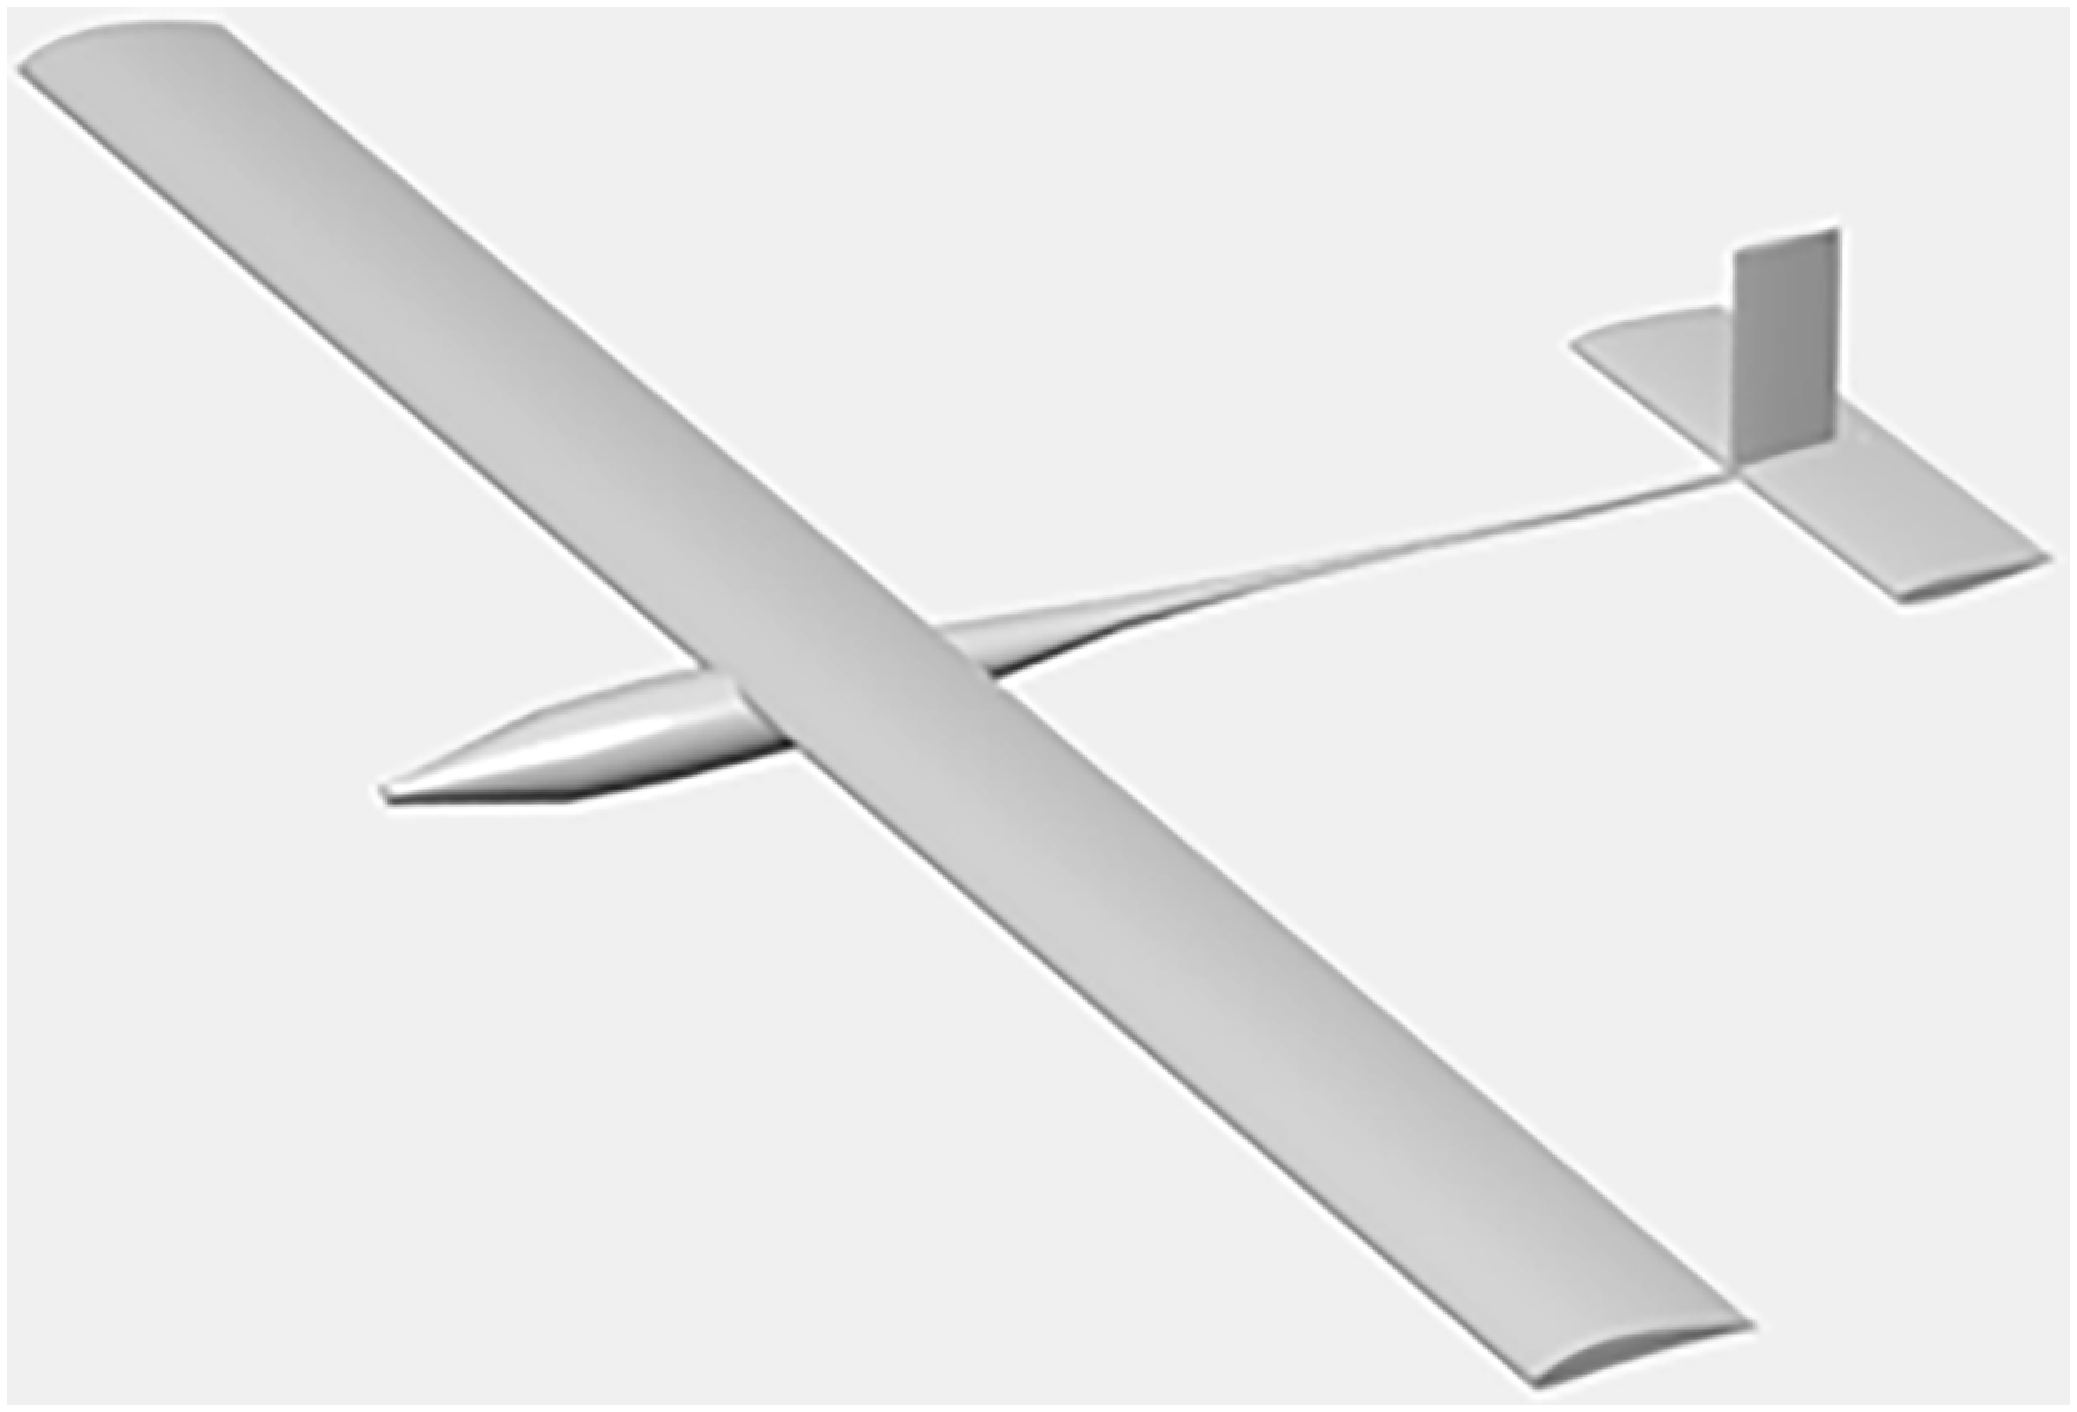
Figure 4 illustrates the geometric configuration of the designed fixed-wing UAV, which was developed for low-altitude, long-endurance solar-powered missions. The UAV features a high-aspect-ratio straight wing with a 4.0 m wingspan and a mean aerodynamic chord of approximately 0.31 m. The selected NACA 6412 aerofoil provides balanced lift-to-drag performance in the low Reynolds number range (Re ≈ 2 × 10⁵), supporting efficient low-speed flight and stable loitering. The fuselage length is 2.13 m, accommodating the flight control electronics, battery pack and power electronics. A conventional tail configuration was selected to ensure control effectiveness, simplicity of construction and ease of maintenance during field operations. The SUAV version includes solar cells mounted on the upper surface of the wing, resulting in a total active PV area of approximately 1 m², as detailed in Table 1.
General configuration of the designed UAV with NACA 6412 aerofoil and conventional tail layout.

Figure 4 Long description
The image depicts a UAV, or unmanned aerial vehicle, featuring a NACA 6412 aerofoil and a conventional tail layout. The aircraft has a sleek, elongated body with a straight wing configuration. The tail section includes a vertical stabilizer and horizontal stabilizers, typical of conventional aircraft designs. The overall design suggests a focus on aerodynamic efficiency and stability.
The aerodynamic characteristics of the UAV were analysed using the NACA 6412 aerofoil, which provides a favourable lift-to-drag ratio in the low Reynolds number regime
 $(\mathrm{Re} \approx 2\times 10^5)$
. The total drag was modeled as the sum of induced and profile drag, and the resulting drag polar was expressed as
 ${C_D} = 0.033 + 0.026C_L^2$
, where the constant term represents profile drag while the quadratic term accounts for the induced drag contribution.
Figure 5 presents the variation of drag components with velocity. The minimum total drag occurs near a flight speed of 17–18 kn (8.7–9.3 m/s), identified as the cruise condition. At this point, the lift and drag coefficients are
 ${C_L} \approx 0.68$
and
 ${C_D} \approx 0.045$
, respectively, yielding an efficient lift-to-drag ratio suitable for long-endurance low-speed flight.
Variation of induced, profile and total drag with velocity for the designed UAV.

Figure 5 Long description
A line graph presents the variation of induced, profile, and total drag with velocity for a designed unmanned aerial vehicle. The x-axis represents velocity in knots, ranging from 14 to 23 knots. The y-axis represents drag in pounds, ranging from 0 to 5 pounds. The graph includes three data lines: induced drag in blue, profile drag in red, and total drag in yellow. Induced drag decreases as velocity increases, while profile drag increases slightly. Total drag, which is the sum of induced and profile drag, initially decreases and then slightly increases. All values are approximated.
3.2 Power consumption analysis
In the simulation model of the UAV, power consumption is evaluated under three main components: propulsion system, avionics systems and auxiliary electronic systems. The total energy consumption of the UAV varies depending on the flight scenario, operational conditions and environmental factors. In this context, various assumptions and systematic modeling approaches were used in power consumption calculations during the simulation process.
The propulsion system is the highest power-consuming component in the model and includes the energy consumed by the electric motors. This energy consumption reaches its highest level during the takeoff and climb phases, approaches a relatively constant value during cruise flight, and decreases to a minimum level during the glide phases. In the model, it is assumed that the power consumption of the electric motors during gliding can be neglected.
Avionic systems include the fixed energy consumption required for the control, navigation and communication systems of the UAV. In the simulation, the power consumption of the electric motors is considered as a variable, while the power consumption of the avionics systems is modeled as a fixed value. Although the total energy consumption of the avionics systems is a low percentage compared to the propulsion system, it is included in the total power consumption calculations of the model.
In the simulation model, four main subsystems are defined to calculate the power consumption of the UAV. These are Flight Control Unit (FCU), environmental model, airframe dynamics and power management system. The FCU manages the mission scenario of the UAV and determines the required flight parameters. The environmental model calculates environmental variables depending on the flight altitude and atmospheric conditions. The airframe dynamics determines the required torque and power demand using data from the flight control module and the environmental model. The power management system manages the total energy consumption of the UAV and calculates the energy balance provided by the battery and solar cell.
The working principle of the implemented model can be explained as follows: the FCU determines the altitude changes appropriate to the flight scenario by taking into account the environmental variables. The environmental model calculates the lift-and-drag forces, depending on the atmospheric conditions. The body dynamics determines the torque and power demand required by the engine using these inputs. Finally, the power management system optimises the energy balance provided by the battery and solar cell to meet the power needs of the propulsion system and avionics components.
The modeled energy management system of the solar-powered UAV is illustrated in Fig. 6, detailing its components and functionality. The system diagram presented in Fig. 6 depicts an integrated structure that encompasses solar energy conversion, power transformation, energy storage and consumption processes. The model consists of four main components: the propulsion system, energy conversion systems, battery management and avionics components.
General energy management diagram.

Figure 6 Long description
The flowchart depicts the energy management system of a solar-powered unmanned aerial vehicle. It starts with solar cells that collect input data such as irradiation, temperature, cloudiness, and pollutants. This data is processed by a maximum power point tracking converter and then passed through DC/DC converters. The system includes a storage management system that interfaces with energy storage components. The BLDC motor control devices and measurement devices receive input data related to the flight scenario and power consumption. The output data includes the state of charge, time to discharge, and energy balance. The flowchart highlights the interaction between various components and data inputs to manage the energy efficiently.
The primary energy source of the UAV is provided by PV solar cells integrated into the wing surface. These cells convert solar irradiation into electrical energy, thereby meeting the power requirements of the system. However, the efficiency of solar cells is influenced by various environmental factors, including irradiation levels, temperature, cloud cover and air pollution.
The primary energy source of the UAV is provided by PV solar cells integrated into the wing surface. These solar cells convert solar irradiation into electrical energy, thereby meeting the power requirements of the system. However, the efficiency of solar cells is influenced by various environmental factors, including irradiation levels, temperature, cloud cover and air pollution.
The energy generated by the solar cells is regulated to meet the UAV’s power requirements through DC/DC converters. These converters not only facilitate the charging of the battery system but also ensure proper energy distribution by supplying appropriate power levels to the propulsion and avionics systems.
The energy harvested from the solar cells is stored in the energy storage system, ensuring a continuous power supply throughout the flight. The optimal management of the batteries plays a critical role in extending the flight duration.
In this context, the energy storage management system continuously monitors the state of charge (SoC) of the battery and regulates the energy flow to ensure efficient power distribution. The output data of the model includes several key parameters. The SoC represents the current charge level of the battery, providing insights into its available capacity. The time to discharge indicates the estimated operational duration of the battery based on the current power consumption. Additionally, the energy balance reflects the equilibrium between the generated and consumed energy, ensuring optimal energy utilisation within the system. These data are utilised to optimise the UAV’s energy consumption and ensure operational continuity.
The model is designed to maximise the efficient utilisation of energy harvested from solar cells, ensure effective battery management and optimise the power requirements of the propulsion system. The FCU determines the energy demand by considering environmental variables, while the energy management system balances the energy supplied from the battery and solar cells accordingly. Aimed at optimising the power management processes of solar-powered UAVs, the model focuses on analysing the impact of battery capacity and solar energy generation on flight duration, without directly targeting range or aerodynamic performance.
The model is designed to maximise the efficient utilisation of energy harvested from solar cells, ensure effective battery management and optimise the power requirements of the propulsion system. The FCU determines the energy demand by considering environmental variables, while the energy management system balances the energy supplied from the battery and solar cells accordingly. Aimed at optimising the power management processes of solar-powered UAVs, the model focuses on analysing the impact of battery capacity and solar energy generation on flight duration, without directly targeting range or aerodynamic performance.
3.3 Power supply elements
3.3.1 Solar cells
In this study, SunPower C60 solar cells were utilised to meet the UAV’s energy requirements. These cells are distinguished by their high efficiency, lightweight structure and durability. According to the manufacturer’s specifications, the maximum efficiency of these cells is 22.5%, with each unit generating approximately 3.46 W of power. Each SunPower C60 monocrystalline silicon cell has physical dimensions of approximately 125 mm × 125 mm and an average mass of 3 g per cell, providing a compact and lightweight design suitable for UAV applications [Reference Chu, Ho, Lee and Li42].
A total of 64 SunPower C60 solar cells were installed on the UAV’s wing surface. The configuration of the solar cells connections was determined by considering the nominal voltage of the battery and the voltage range of the maximum power point tracking (MPPT) converter. Parallel and series connection options were evaluated to select the most optimal configuration. Figure 7 presents the voltage-current (V-I) characteristics of the SunPower C60 solar cell, illustrating its performance under varying irradiation levels and temperature conditions.
Irradiation-dependent I-V characteristics of the SunPower C60 solar cell [Reference Dwivedi, Kumar, Ghosh and Kamath43].

Figure 7 Long description
The line graph displays the current versus voltage characteristics of a SunPower C60 solar cell under varying irradiation conditions. The x-axis represents voltage in volts, ranging from 0 to 0.8 volts. The y-axis represents current in amperes, ranging from 0 to 7 amperes. The graph includes five data lines corresponding to different irradiation levels: 1000 watts per square meter, 1000 watts per square meter at 50 degrees Celsius, 800 watts per square meter, 500 watts per square meter, and 300 watts per square meter. Each line shows how the current changes with voltage under these specific conditions. All values are approximated.
During the integration of the solar cells onto the UAV’s wing surface, a 100 μm thick polyvinyl chloride (PVC) coating was applied to enhance mechanical durability and provide protection against environmental factors. Although this coating causes a slight decrease in the efficiency of the solar cells, it significantly improves their resistance to impacts, weather conditions and wear over long-term use.
In the series connection structure of the solar cells, it was considered that the current value of the entire connection chain could decrease if a single cell were damaged. To enhance the system’s durability, parallel connection options were evaluated, providing redundancy in energy production. As a result, even in the event of a cell failure, the impact on the total energy production of the system was minimised.
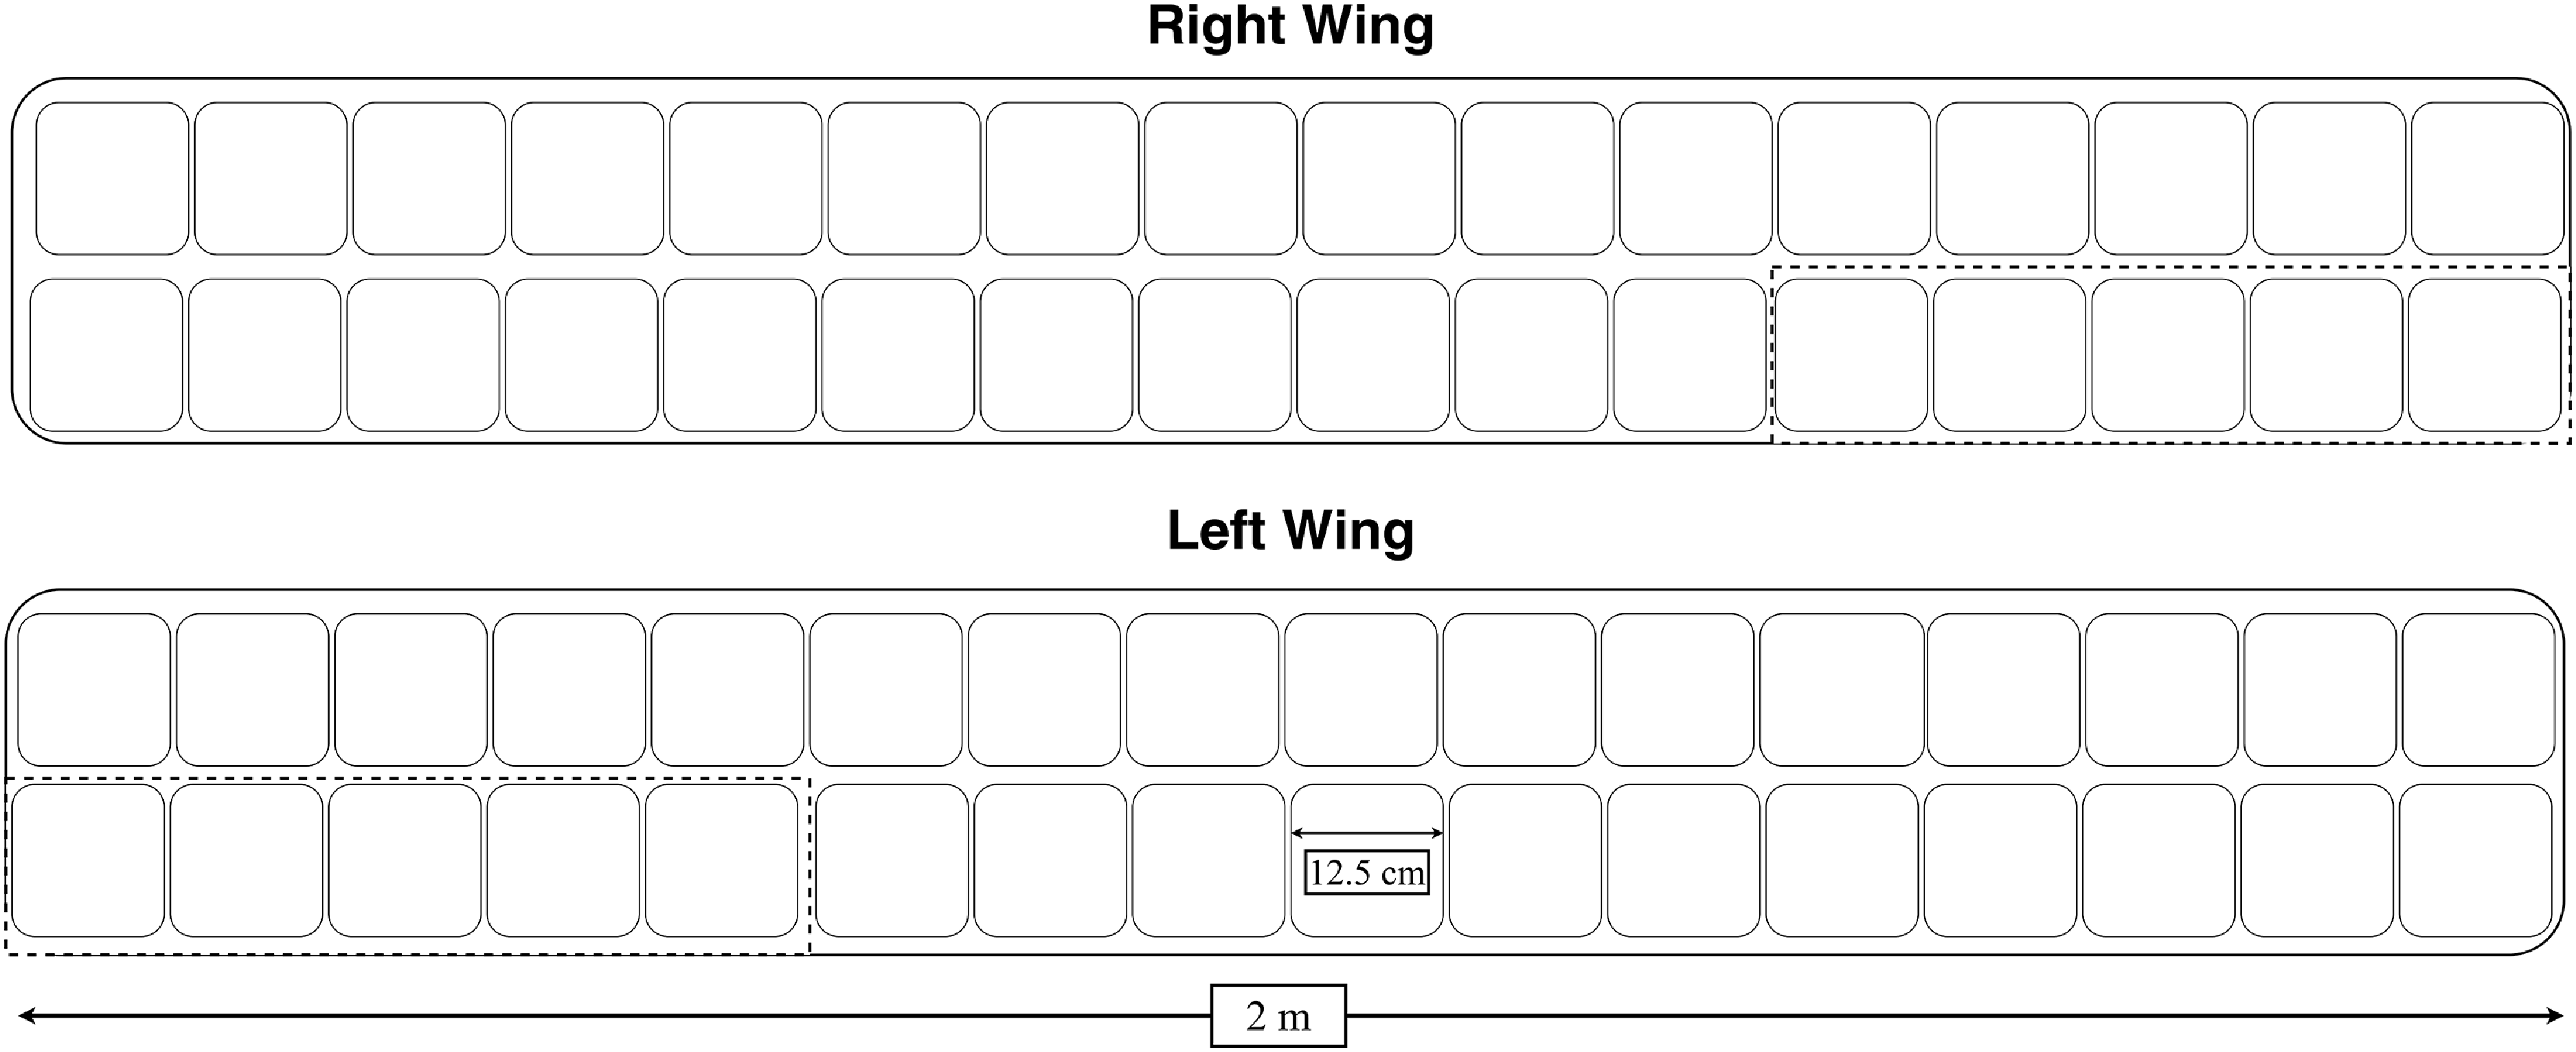
The solar PV modules are installed exclusively on the upper surfaces of the left and right wings, as illustrated in Fig. 8. The panels are arranged symmetrically along a total wingspan of 4 m, ensuring uniform exposure to solar irradiance during level flight. The dashed lines in the figure indicate the boundaries of the ailerons. This configuration allows efficient utilisation of the available wing surface area for maximum solar energy harvesting.
Solar cell layout on the UAV wings showing the 32S2P configuration. Dashed lines represent aileron boundaries.

Figure 8 Long description
The diagram illustrates the layout of solar cells on the wings of an unmanned aerial vehicle (UAV), specifically a solar-powered unmanned aerial vehicle (SUAV). The layout follows a 32S2P configuration, where 32 cells are connected in series and 2 of these series are connected in parallel. Dashed lines in the diagram indicate the boundaries of the ailerons. The right wing and left wing each contain multiple solar cells arranged in this configuration. The diagram also includes dimensions, with the left wing measuring 2 meters in length and a specific section measuring 12.5 centimeters. The layout is designed to optimize the use of photovoltaic (PV) cells for energy generation, which is crucial for the operation of the UAV.
In the final configuration, each wing incorporates 32 solar cells connected in series, providing a nominal voltage suitable for the UAV’s DC/DC converter input. The left and right wings are connected in parallel, resulting in an overall 32S2P configuration. This design ensures symmetrical power generation from both wings and provides a balanced voltage and current output for the power management and storage subsystems.
3.3.2 Battery cells
In this study, a battery pack was created for the UAV using Panasonic NCR18650B Li-ion battery cells, which are distinguished by their high energy density, lightweight design and long cycle life. These cells provide a nominal voltage of 3.6V, a capacity of 3200mAh, and a maximum continuous discharge current of 4.87A. Furthermore, these cells, which maintain up to 80% of their capacity for up to 500 cycles, can operate safely over a wide temperature range (−20°C) to (60°C).
To meet the energy requirements of the UAV, a total of 60 battery cells were arranged in a 6S10P configuration. This structure provides a system voltage of 21.6V through series connections, while the parallel connections enable the total capacity to reach 32Ah. This configuration is ideal for high power output, stable voltage balance and long flight durations [Reference Oettershagen, Melzer, Mantel, Rudin, Stastny, Wawrzacz, Hinzmann, Leutenegger, Alexis and Siegwart10].
Studies in the literature have reported that the SoC of Li-ion batteries is temperature-sensitive, with approximately a 23% decrease when the temperature drops from (25°C) to (−15°C) [Reference Ma, Jiang, Tao, Song, Wu, Wang, Deng and Shang39]. Therefore, temperature-dependent battery performance and energy efficiency calculations were considered and integrated into the numerical analysis and simulation environment.
According to data obtained from the General Directorate of Meteorology in Turkey, the average night temperatures in Kayseri province during the summer months range between 12°C and 14°C. Since the flights are planned to be conducted at an altitude of 1000 meters in the simulation, it is expected that the ambient temperature during level flight will be approximately 6°C lower. Accordingly, it is anticipated that the average ambient temperature during flights after sunset will be around 6°C to 8°C [44].
Figure 9 presents the temperature-dependent discharge curves of the Panasonic NCR18650B Li-ion battery, illustrating the variation in capacity and voltage under different thermal conditions. Especially at temperatures below 0°C, there is a considerable decline in the battery’s energy storage and transmission capacity. To achieve optimal performance, it is recommended that the battery be used within temperature range of 25°C to 40°C.
Discharge performance of the NCR18650B lithium-ion battery based on temperature variation [45].

Figure 9 Long description
The line graph illustrates the discharge performance of the NCR18650B lithium-ion battery across different temperatures. The x-axis represents the discharge capacity in milliamp hours, ranging from 0 to 3500 milliamp hours. The y-axis represents the voltage in volts, ranging from 2.5 to 4.5 volts. The graph includes five data lines, each corresponding to a different temperature: negative 20 degrees Celsius, negative 10 degrees Celsius, 0 degrees Celsius, 25 degrees Celsius, and 40 degrees Celsius. Each line shows how the voltage decreases as the discharge capacity increases at the respective temperature. The charge conditions are constant current-constant voltage at 0.5 C (maximum) with a 4.20-volt cut-off at 25 degrees Celsius and a 65 milliamp cut-off. The discharge conditions are constant current at 1 C with a 2.50-volt cut-off at each temperature. All values are approximated.
In this study, the expression provided in Equation (18) was used to calculate how the battery capacity is affected by temperature variations. In this expression,
 ${C_{eff}}$
represents the available battery capacity at the current temperature,
 $C$
is the nominal capacity of the battery,
 $T$
is the ambient temperature and the coefficient 0.006 represents the capacity loss that occurs as the temperature increases [Reference Linden and Reddy46]. While this coefficient is not a precise value, it is presented as a generalised approach based on studies in literature.
 \begin{equation} {C_{eff}} = C{\rm{\;}}x{\rm{\;}}\left( {1 - 0.006 \times \left( {T - 25} \right)} \right)\end{equation}
The total energy calculation
 ${E_t}$
is determined using the following formulas. Here,
 ${V_t}$
resents the total voltage of the battery pack,
 $S$
is the number of cells connected in series,
 ${V_n}$
is the nominal voltage of a single cell,
 ${C_t}$
is the capacity of a single cell and
 $P$
denotes the number of cells connected in parallel.
 \begin{equation*} {V_t} = S{\rm{\;}}x{\rm{\;}}{V_n}\end{equation*}
 \begin{equation} {C_t} = P{\rm{\;}}x{\rm{\;}}{C_{eff}}{\rm{\;}}\end{equation}
 \begin{equation*} {E_t} = {V_t}{\rm{\;}}x{\rm{\;}}{C_t}\end{equation*}
This 6S10P battery pack is designed to meet the energy requirements of the UAV during flight. The total energy capacity of the battery provides sufficient power for long duration flights. Furthermore, the high capacity and series connection arrangement offer a stable power source for the motors and other flight systems.
The battery pack, working in conjunction with the solar cells during flight, has created a hybrid energy system. The energy generated by the solar cells allows for the recharging of the battery, optimising energy consumption. Additionally, by using an energy management system, the voltage and current levels of the battery were kept under control, thereby enhancing system safety.
3.4 Simulation model
In this study, the flight simulation model developed for the solar-powered UAV was created to analyse the interaction between aircraft dynamics, energy management and environmental factors. The flowchart presented in Fig. 10 outlines the key components and decision mechanisms of the simulation process.
Basic components and decision mechanisms of the simulation process.

Figure 10 Long description
The flowchart begins with the initialization of parameters for the UAV, environment, and mission. It then branches into generating weather data and computing solar power. The next step involves computing aerodynamics, including lift, drag, and power. Following this, the flight dynamics are updated, considering position, velocity, and energy. The process checks end conditions such as landing, energy, and time. A decision point evaluates if the battery is less than 10% or if the end point is reached. If yes, it proceeds to descent and landing planning; if no, it maintains cruising altitude and speed, looping back to the initialization step.
The simulation process begins with the initialisation of the aircraft parameters (UAV, environmental conditions and mission definitions), followed by two key external factors: the generation of weather data and the calculation of solar energy. The energy harvested from the solar cells is calculated in coordination with the battery management system (BMS), determining the available power for use during the flight.
Subsequently, aerodynamic calculations such as lift, drag and power requirements are performed, and the aircraft’s position, speed and energy status are continuously updated. Throughout the flight process, factors that may lead to the termination of the flight, such as battery status, reaching target points and energy consumption, are monitored. These target points are planned such that the flight will last more than 24 hours.
In the simulation model, the transition to landing and the termination of the flight occur either when the battery level drops below 10% or when the aircraft reaches its target point. If the battery level is sufficient and the flight process continues, calculations are made to maintain cruising altitude and speed. The flight dynamics are updated, and the process continues cyclically.
3.5 Flight path scenarios
In this study, flight path scenarios were developed for two different UAVs with the same physical characteristics and initial parameters. One of these aircraft, capable of generating energy through solar cells during flight, is referred to as the SUAV. The other UAV operates solely by utilising the energy stored in its battery at the beginning, without any additional energy generation mechanism. The developed flight scenarios were modeled considering the flight altitude, energy management and battery SoC for both the SUAV and the UAV without solar cells.
The flight path scenario developed for the solar-powered UAV is based on a dynamic model that varies depending on the battery status and flight altitude. The flowchart presented in Fig. 11 illustrates how the UAV operates in terms of altitude management, SoC and flight strategies. According to the diagram, the flight scenario begins with the definition of the UAV’s starting position, followed by the climb phase. Once the UAV reaches an altitude of 1000 meters, the level flight mode is activated. While continuing flight at this altitude, the SoC is continuously monitored. When the SoC reaches 99% or higher, the UAV initiates a second climb to reach a higher altitude, targeting 2000 meters. If the battery level falls below 98%, in order to maintain energy efficiency, the UAV descends back to 1000 meters and continues flying at this altitude.
Altitude control algorithm for the solar-powered UAV. The flowchart outlines the decision logic governing climb, cruise and descent phases based on altitude targets and battery state of charge (SoC) thresholds, ensuring energy-aware and continuous flight operation.

Figure 11 Long description
The flowchart illustrates the altitude control algorithm for a solar-powered unmanned aerial vehicle (UAV). The process begins with defining the initial position in three-dimensional space (x, y, z). The UAV then enters a climbing phase until it reaches an altitude of 1000 meters. Once this altitude is achieved, the UAV transitions to a cruising phase at 1000 meters. During the cruise, the state of charge (SOC) of the battery is monitored. If the SOC is greater than or equal to 99 percent, the UAV continues climbing to an altitude of 2000 meters. If the SOC falls to or below 10 percent, the UAV begins its descent. If the SOC is between 10 and 98 percent, the UAV maintains its cruise at 2000 meters. The flowchart includes decision points for altitude and SOC, guiding the UAV through climbing, cruising, and descending phases to ensure continuous and energy-aware flight operation.
On the other hand, when the SoC drops to 10% or lower, the UAV enters the descent phase. If the battery level rises above 10%, the flight continues at the current altitude. However, if the battery level falls below 10%, the landing phase is initiated, and the flight is terminated.
This flight scenario is based on dynamically changing two different altitude levels in terms of energy management. The solar-powered UAV can fly at higher altitudes when sufficient energy is produced, and when the battery level decreases, it transitions to a lower altitude to optimise energy consumption. This ensures that flight duration is maximised and energy management is maintained at an optimal level. On the other hand, the UAV without solar cells operates solely based on the initial battery capacity and does not generate energy during flight. After climbing to 1000 meters, this UAV transitions to level flight and continues the flight duration depending on the battery level. However, since there is no energy generation mechanism, when the SoC falls below 10%, the landing procedure is initiated.
This modeling demonstrates comparative analysis of the effects of solar energy utilisation on the operational durations and flight altitudes of UAVs. Specifically, the SUAV is able to dynamically manage its flight altitude and duration using the energy provided by the solar cells, thereby increasing energy usage efficiency. In contrast, the UAV without solar cells operates based on battery capacity, resulting in a more limited operational profile in terms of flight duration and altitude management.
4.0 Results and discussion
4.1 Power consumption analysis
In this study, a power consumption analysis has been conducted for two UAVs with the same physical characteristics and flight scenarios. The only difference is that one UAV is equipped with solar cells, while the other model is without solar cells and is 500 g lighter. Figure 12(a) and (b) presents the power consumption analysis of UAVs with and without solar cells, respectively.
(a) Power analysis of UAV without solar cells. (b) Power analysis of UAV with solar cells.

Figure 12 Long description
Two line graphs titled Power Analysis compare the power consumption and generation of a UAV with and without solar cells over time. The x-axis represents time in hours, ranging from 0 to 14 hours in graph (a) and 0 to 45 hours in graph (b). The y-axis represents power in watts, ranging from -100 to 200 watts. In graph (a), the red line represents net power (P_net), the blue line represents propulsion power (P_prop), and the dashed blue line represents solar power (P_solar). In graph (b), the same color scheme is used. In both graphs, the net power fluctuates, showing periods of positive and negative values, indicating times when the UAV is generating more power than it consumes and times when it is consuming more power than it generates. The solar power in graph (b) shows significant fluctuations, indicating the varying availability of solar energy over time. All values are approximated.
Examining the graphs in Fig. 9, it is evident that the power consumption dynamics of the solar-powered UAV vary depending on solar irradiation. The solar energy produced during the day,
 ${P_{Solar}}$
, partially meets the energy requirements of the motor and other systems, thereby reducing the load on the battery. During the night or under low irradiation levels, when the solar cells are unable to generate energy, the UAV becomes fully dependent on battery power.
In contrast, the power consumption graph of the UAV without solar cells shows a constant and continuous energy consumption, as this model relies solely on battery power. The changes in power consumption are observed to be dependent on the flight dynamics; however, since there is no external energy source, the
 ${P_{Solar}}$
component is zero.
The UAV without solar cells is 500 g lighter, which results in a reduction in the total power demand of the propulsion system. However, this difference does not provide a significant advantage for long duration flights, as the energy consumed from the battery continues to decrease at a steady rate.
On the other hand, despite the increased weight disadvantage, the solar-powered UAV demonstrates a longer flight duration due to the support provided by solar energy. The additional energy derived from the solar cells compensates for the power requirement caused by the weight difference, making the overall energy balance more sustainable.
The solar-powered UAV has an energy management system that reduces battery consumption and increases flight duration. Although the UAV without solar cells is lighter, its dependence on the battery results in a more limited flight time. The energy produced by the solar cells contributes to maintaining the battery capacity and allows for recharging during daylight hours. While the weight difference may impact energy consumption in the short term, the operational advantages of the solar-powered system, which ensures sustainable energy production, become more apparent in the long term.
4.2 Battery cell efficiency
In order to simplify the simulation model, the effects of temperature have been integrated into the model; however, the degradation effects of the battery have not been considered. This is because the capacity loss during the operational period of the system remains below a certain threshold, and the decrease in battery capacity after several hundred charge and discharge cycles is negligible [Reference Mateja, Skarka, Peciak, Niestrój and Gude11]. With this approach, the ability of the model to represent real systems in practice has been enhanced, and the changes in battery performance under different operational conditions have been analysed with greater accuracy.
In this study, the SoC of two UAV models with the same physical properties – one with solar cells and the other powered solely by the battery – has been analysed. In Fig. 13(a) and (b), the time-dependent variation of the SoC for the solar-powered UAV and the UAV without solar cells is shown, respectively. The SoC of the solar-powered UAV follows a variable trend, depending on solar irradiation. The periodic fluctuations observed in the SoC curve indicate that during daylight hours, the solar cells charge the battery, while at night, energy is consumed from the battery. During periods of high solar irradiation (daytime), the battery is charged, and the SoC reaches 100%. At night or during low irradiation conditions, since energy consumption is solely from the battery, the SoC level decreases. Full charge and discharge cycles show that the battery can be recharged, and the energy management system remains sustainable. The battery level may drop to around 20%, but it is recharged by the solar cells, bringing the SoC back to 100%. This demonstrates that the solar-powered UAV significantly increases its operational duration and optimises battery consumption. Particularly in areas with sufficient solar irradiation, even when the battery level is low, energy production continues, thus extending the flight time.
(a) Time-dependent variation in the SoC for the UAV without solar cells. (b) Time-dependent variation in the SoC for the UAV with solar cells.

Figure 13 Long description
The line graph illustrates the time-dependent variation in the state of charge for the unmanned aerial vehicle without solar cells. The x-axis represents time in hours, ranging from 0 to 14 hours. The y-axis represents the state of charge in percentage, ranging from 0 to 100 percentage. The state of charge starts at 100 percentage and decreases linearly to 0 percentage over the 14-hour period. All values are approximated.", "EDH": "Time-dependent variation in the SoC for the UAV without solar cells" } { "short_alt_text": "A line graph shows the time-dependent variation in the state of charge for the unmanned aerial vehicle with solar cells.", "long_alt_text": "The line graph illustrates the time-dependent variation in the state of charge for the unmanned aerial vehicle with solar cells. The x-axis represents time in hours, ranging from 0 to 45 hours. The y-axis represents the state of charge in percentage, ranging from 0 to 100 percentage. The state of charge fluctuates over time, with peaks and troughs indicating periods of charging and discharging. The state of charge starts at 100 percentage, drops to around 20 percentage, rises back to 100 percentage, and then follows a similar pattern of fluctuation. All values are approximated.", "EDH": "Time-dependent variation in the SoC for the UAV with solar cells.
The battery SoC of the UAV without solar cells exhibits a linear decrease over time. Due to the absence of energy generation, the battery is directly consumed without any recharging process. At the beginning of the flight, the SoC level is at 100%, but it continuously declines as time progresses. After approximately 14 hours, the battery is fully depleted, and the SoC level reaches 0%, indicating the end of the UAV’s operational duration. Since there is no energy input from solar cells, the battery cannot be recharged once it is discharged, rendering the UAV inoperable.
4.3 Comparison of flight path and flight endurance
In this study, the flight paths and endurance durations of two different UAV models, one equipped with solar cells and the other without, were compared. Both UAV models share the same initial conditions, propulsion system and aerodynamic characteristics, with the primary distinction being that the solar equipped model can harness solar energy during flight to recharge its battery.
Figure 14(a) and (b) illustrates the variations in flight altitude over time for the UAV equipped with solar cells and the UAV without solar cells.
(a) Time-dependent variation of flight altitude for the UAV without solar cells. (b) Time-dependent variation of flight altitude for the UAV with solar cells.

Figure 14 Long description
Two line graphs showing time-dependent variation of flight altitude for UAV without and with solar cells. The first line graph on the left shows the altitude of the UAV without solar cells over a period of 14 hours. The altitude starts at 0 meters, increases to 1000 meters around 2 hours, and then remains constant until around 12 hours, after which it decreases back to 0 meters. The second line graph on the right shows the altitude of the UAV with solar cells over a period of 40 hours. The altitude starts at 0 meters, increases to 1000 meters around 10 hours, then increases to 2000 meters around 20 hours, remains constant until around 30 hours, and then decreases back to 0 meters. All values are approximated.
The UAV without solar cells initially ascends to an altitude of 1000 meters and maintains level flight until the battery is fully depleted. After approximately 14 hours of operation, when the battery level reaches a critical threshold, the UAV initiates its descent. Since no additional energy generation is available, the flight duration is strictly limited by battery capacity. When the battery level drops below 10%, a safe landing procedure is executed.
In contrast, the flight path analysis of the solar-powered UAV reveals a more dynamic flight profile in terms of energy management. As long as the battery level remains sufficient, the UAV initially ascends to 1000 meters and transitions into level flight. During periods of high solar irradiance, when the battery is fully charged, the UAV climbs to 2000 meters to utilise the excess generated energy. When the battery level drops below a certain threshold, the UAV descends back to 1000 meters to optimise energy consumption. This process repeats throughout the day, forming a dynamic energy management strategy that extends the flight duration.
The solar-powered UAV successfully completed a 24-hour flight cycle, demonstrating its capability for continuous flight through effective solar irradiance utilisation and battery management. Although the simulation continued for 45 hours, the UAV’s descent occurred not due to energy depletion but as a result of reaching its designated destination in the operational scenario. This finding suggests that, under appropriate flight strategies and sufficient solar irradiance conditions, a solar-powered UAV could potentially achieve indefinite flight endurance.
According to the simulation results, the solar UAV optimised battery consumption, completed a full 24-hour cycle, and theoretically demonstrated the capability for indefinite flight under suitable temperature and irradiance conditions In contrast, the UAV without solar cells, being entirely dependent on its initial battery capacity, could sustain operation for only 14 hours before being forced to land due to complete battery depletion. By dynamically adjusting its altitude, the solar UAV optimised energy management, utilised excess energy efficiently and ensured operational continuity. During daylight hours, when solar irradiance was available, battery charging enabled extended flight durations.
5.0 Conclusion
This study investigates the effects of solar cells on the flight duration, power consumption and battery management of a fixed wing UAV. Two UAV models with identical aerodynamic characteristics were compared: one powered solely by battery energy and the other equipped with solar cells for additional energy generation. The simulation results demonstrated that solar cells significantly contribute to UAV energy management and play a crucial role in extending flight duration. This model was developed to analyse how solar-powered UAVs can be optimised in terms of flight dynamics, energy management and operational sustainability. Particularly in terms of battery management and aerodynamic calculations, the model provides a realistic assessment, helping to balance energy production and consumption and facilitating the modeling of long-term and sustainable flight scenarios.
According to power consumption analyses, the battery powered UAV exhausted its energy after approximately 14 hours of flight, constrained by battery capacity. In contrast, the solar-powered UAV was able to utilise solar energy during daylight hours to recharge its battery, reaching full capacity and completing a 24-hour flight cycle. This result indicates that, under sufficient irradiance conditions, continuous flight is theoretically possible. However, the UAV’s 24-hour continuous flight capability is not solely dependent on daylight duration or irradiance levels. Since battery capacity fluctuates with ambient temperature, lower temperatures can reduce flight duration. For this reason, the simulations were conducted during summer conditions.
SoC analyses have demonstrated that solar cells help maintain the SoC level, enabling extended flight durations. While the battery level of the UAV without solar cells decreases linearly until depletion at the end of the flight, the battery in the solar-powered model is recharged during daylight hours, and energy consumption is optimised during nighttime, thereby extending the operational duration.
In terms of flight altitude, it has been observed that the solar-powered UAV ascends to 2000 meters when excess energy is available, increasing its potential energy, and descends to 1000 meters when the battery level decreases to optimise energy consumption. This dynamic flight management strategy enhances energy efficiency and extends operational duration. In contrast, the UAV without solar cells remains at a constant altitude of 1000 meters, solely dependent on battery capacity, and continues its flight until the battery is depleted. The integration of solar cells emerges as a crucial factor in extending the flight duration and operational efficiency of fixed wing UAVs. By utilising solar energy, battery consumption is optimised, flight duration is extended and energy management becomes more sustainable. This study highlights the potential of renewable energy supported aerial vehicles for long duration operations, particularly in reconnaissance, surveillance and logistics applications. Future research may focus on evaluating the performance of solar cells under different geographical and atmospheric conditions and optimising energy management strategies.
This study highlights the potential of renewable energy supported UAVs for long duration operations, particularly in reconnaissance, surveillance and logistics applications. Future research may focus on evaluating solar cell performance under different geographic and atmospheric conditions and optimising energy management strategies.
The present study established a numerical framework to evaluate the impact of solar energy integration on the performance of a fixed-wing UAV under representative summer conditions for the Central Anatolia region. The developed simulation model incorporates key environmental factors such as solar irradiance, temperature and cloud cover and provides a reliable analytical basis for understanding the energy balance of solar-powered UAVs. However, this work is limited to numerical validation, and real flight testing has not yet been performed. As part of future research, limited experimental flights will be conducted to validate the simulation outcomes. In addition, to mitigate the high cost of solar panels and reduce the risk of airframe damage, a ground-based test bench will be developed to emulate real flight loads and irradiance conditions, enabling controlled performance evaluations. Furthermore, Monte Carlo and sensitivity analyses will be carried out to assess the influence of stochastic weather variations and model uncertainties, while the framework will be extended to cover different geographical regions and seasonal conditions. These efforts aim to achieve a comprehensive and experimentally supported understanding of the long-endurance potential of solar-powered UAVs.
Future studies could explore solar cell performance under various environmental and operational scenarios, optimise battery management algorithms and integrate next generation energy solutions into UAV systems. Additionally, new systems could be developed to ensure battery operation is unaffected by external temperatures and to enable 24-hour continuous flight even in winter conditions with shorter daylight durations. Advancements in this direction will further enhance the viability of solar energy for long duration reconnaissance, surveillance and autonomous aerial vehicles, laying the foundation for sustainable aviation in the future.
Acknowledgements
The authors would like to thank the Erciyes University Scientific Research Projects Unit for their financial support (Project No: FDK-2024-13545).