





Introduction
Children with complex CHD carry the risk for impaired neurological development that can impede cognition, executive functioning, self-regulation, communication, social-emotional functioning, and motor skills, especially in those who underwent open-heart surgery within their first year of life. Reference Marino, Lipkin and Newburger1 Although many potential risk factors have been identified, Reference Wernovsky2 there is a lack of knowledge concerning the impact of cardiac catheterisation and effect of conscious sedation. Moreover, little is known about the incidence of seizures during sedation since the patient’s clinical demeanour can be suppressed.
Near-infrared spectroscopy and amplitude-integrated electroencephalography are two standard noninvasive techniques for bedside neurological monitoring. Amplitude-integrated electroencephalography is the time-compressed, filtered, and rectified presentation of the amplitude-integrated electroencephalography. Reference Hellström-Westas, de Vries, Rosén and Inder3 Current evidence reveals that amplitude-integrated electroencephalography is useful to monitor cerebral background activity, diagnose and treat seizures, and predict neurodevelopmental outcomes. Reference Latal, Wohlrab and Brotschi4–Reference Gunn, Beca, Hunt, Olischar and Shekerdemian6 Near-infrared spectroscopy can determine tissue oxygenation, changes in haemoglobin volume and, indirectly, brain blood flow by analysing the extinction of emitted near-infrared light of different wavelengths within the cerebral cortex. Reference Murkin and Arango7
The aim of this study was to implement and thereby test the feasibility of extended neurological function monitoring via near-infrared spectroscopy and amplitude-integrated electroencephalography during paediatric cardiac catheterisation under conscious sedation and to report on our findings. Second, we examined if there are signs of seizures during cardiac catheterisation and if specific cardiac interventions impact electrocortical activity and cerebral tissue oxygenation.
Materials and methods
Patients
This prospective observational single-centre feasibility study was conducted with the aim of including more than 50 patients aged 1 day–17 years undergoing cardiac catheterisation under conscious sedation between 08/2018 and 05/2020. Informed consent was obtained from each study participant´s parents or legal guardian. Exclusion criteria were any neurological disease diagnosed before cardiac catheterisation and procedures under anaesthesia. Genetic disorders (i.e., trisomy 21, 22q11.2 deletion syndrome) did not preclude participation. Our local ethics committee approved the study; the application number was 298/19. Baseline demographics comprised age, gender, body surface area, and patients´ diagnoses. Moreover, the indication for catheterisation and procedure-related data were reviewed. Our standard monitoring during cardiac catheterisation consists of 4-channel-electrocardiogram, non-invasive blood pressure measurement, and pulse oximetry. Patients for all cardiac catheterisations were consciously sedated. Sedation was initiated by intravenous midazolam (0.1 mg/kg IV) and maintained with continuous administration of propofol (1–3 mg/kg/hr IV) plus bolus (0.5–1.0 mg/kg IV) if necessary.
Extended neurological function monitoring
The amplitude-integrated electroencephalography continuously measured electrocortical activity via the Olympic Brainz Monitor Natus Medical Inc., San Carlos, CA, USA. This monitor applies a computer-generated algorithm to filter and compress raw data for each cerebral hemisphere. With a standardised template, four needle electrodes (MedCare® Visions, Unterschleißheim/München, Germany) were positioned in the C3/P3 on the left and C4/P4 positions in the right hemisphere of the international 10 to 20 EEG system, one self-adhesive reference electrode was placed on the patient’s forehead. This two-channel electroencephalography yields separate data from each hemisphere. Background patterns were classified according to the dominant pattern into five different activity types according to Hellström-Westas. Reference Hellström-Westas, Rosén, De Vries and Greisen8 For this study only, we introduced a new term for the background pattern we refer to as high voltage. We subsumed all patterns presenting continuous activity with minimum amplitude >10vµV to ease comprehension of the changes in amplitude-integrated electroencephalography we observed and enable better legibility. We defined seizures as repetitive waveforms evolving over a minimum of 10 seconds in either hemisphere. The raw electroencephalography signal was used to confirm suspected seizures on the amplitude-integrated component.
The principles of near-infrared spectroscopy are described elsewhere. Reference Murkin and Arango7 We used NIRO-200NX (Hamamatsu Photonics®, Japan) consisting of two reusable photodiodes, one emission probe and one detection probe. Both were placed in probe holders size S or L depending on the child´s age and secured supraorbital onto the patient’s forehead with double-sided adhesive tape. NIRO-200NX continuously determines changes in oxygenated (ΔHbO2), deoxygenated (ΔHb), and total haemoglobin (ΔcHb). The tissue oxygenation index and normalised tissue haemoglobin index are computed via spatially resolved spectroscopy for which the probe holders provide fixed distances between the emitting and detecting probe. Reference Suzuki, Takasaki, Ozaki and Kobayashi9 Normal tissue oxygenation index values are defined as 60–80% in acyanotic humans. Reference Scott and Hoffman10 The haemoglobin-difference (ΔHbD = ΔHbO2−ΔHb) was also assessed as it correlates with the cerebral blood flow. Reference Tsuji, Duplessis, Taylor, Crocker and Volpe11
We documented the mean values of near-infrared spectroscopy-derived tissue oxygenation index, normalized tissue hemoglobin index, ΔHbO2, ΔHb, ΔcHbO2, and the amplitude-integrated electroencephalography trace´s dominant pattern as well as the vital signs (heart rate, mean arterial pressure, and pulse oximetry) at each predefined time point (over five minutes each):
-
T0: at baseline after initiating conscious sedation with midazolam.
-
T1: after propofol administration to maintain conscious sedation.
-
T2: at the end of cardiac catheterisation and half of the intravenous propofol dosage rate.
-
T3: end of conscious sedation.
During cardiac catheterisation we additionally analysed vital parameters and near-infrared spectroscopy-derived data and recorded the amplitude-integrated electroencephalography pattern every 10 minutes. The usage of catecholamines, bolus administration of propofol during catheterisation as well as continuous infusions, the occurrence of cardiac arrhythmias, and type of procedural interventions (i.e. stent-implantation, balloon angioplasty) were documented.
Statistical analysis
Near-infrared spectroscopy and amplitude-integrated electroencephalography data were analysed exclusively from the dominant left hemisphere. A paediatric neurologist reviewed suspicious amplitude-integrated electroencephalography data. Categorical variables are presented as absolute numbers and percentages. Continuous data are summarised as median (range). The non-parametric Wilcoxon signed-rank test served to assess statistical significance. All values were considered significant at p < 0.05. Data were analysed using IBM SPSS Statistics 27.
Results
Patients´ characteristics and procedure-related data
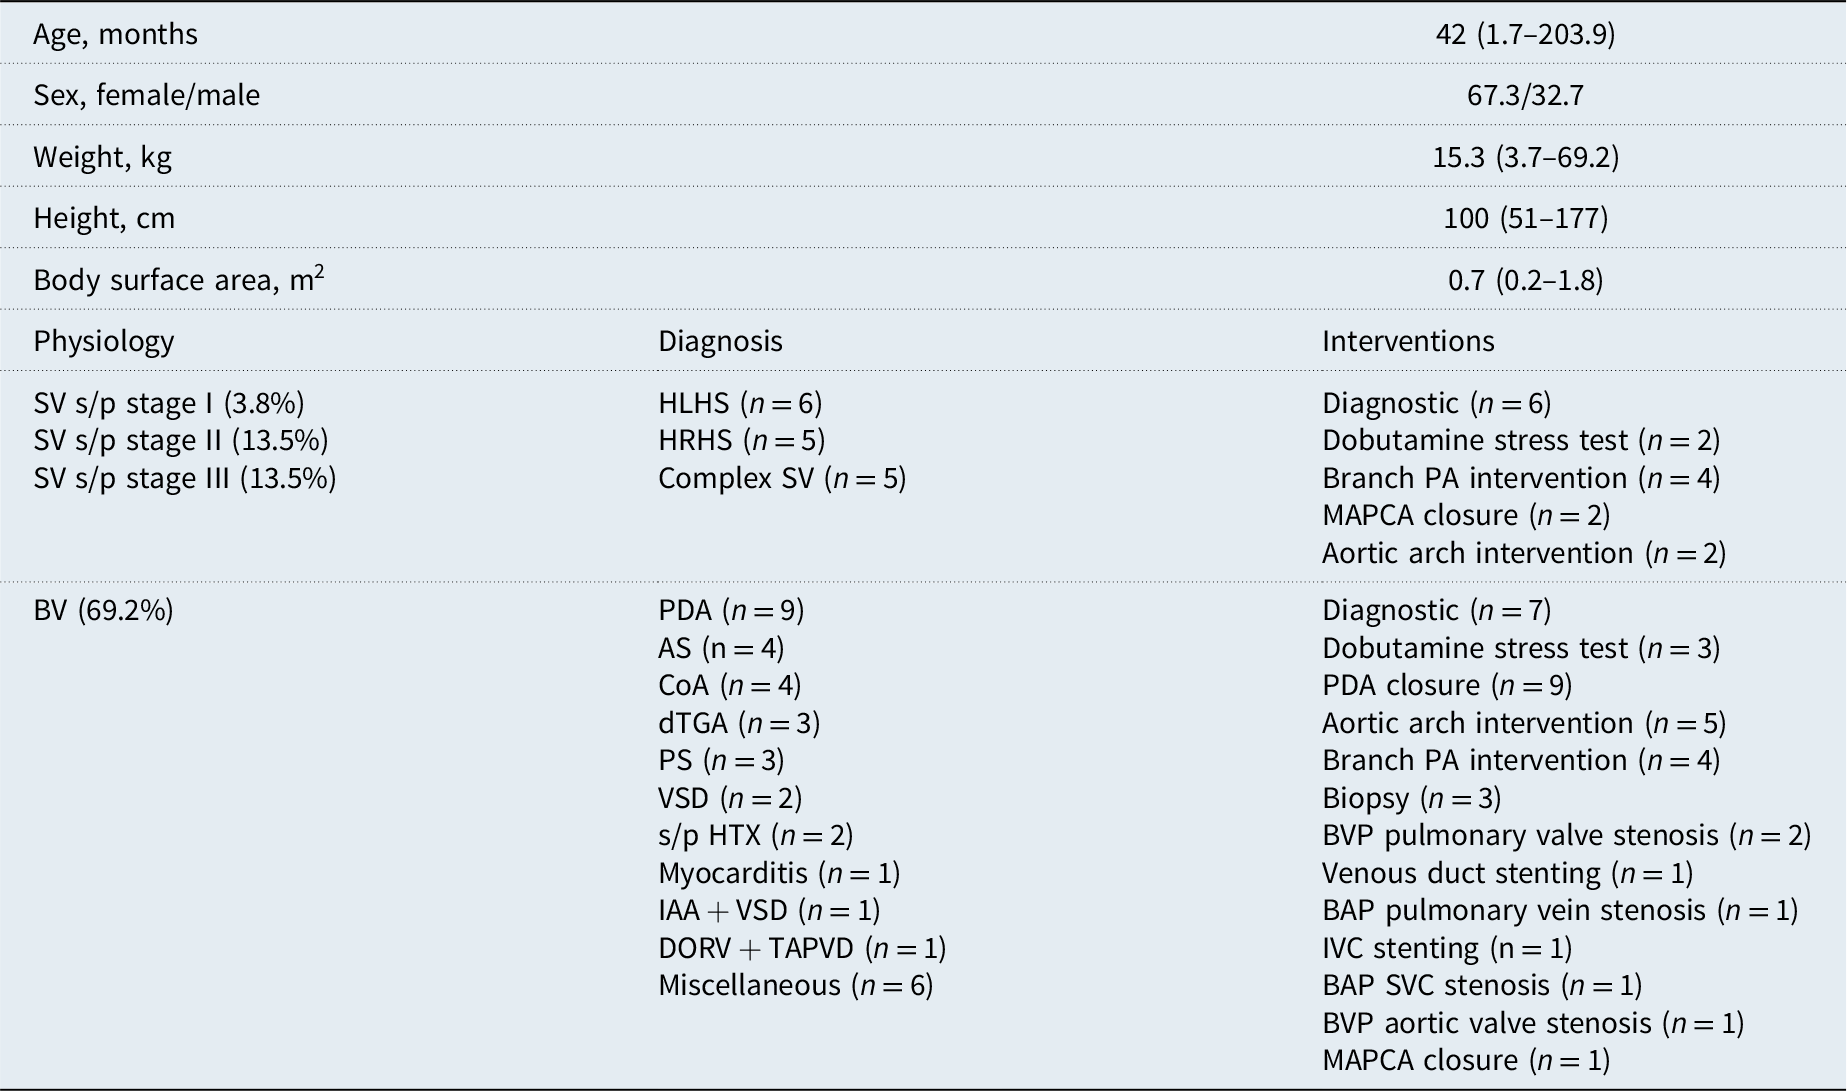
52 patients (67.3% male) with a median age and body weight of 3.5 years (51 days–17 years) and 15.3 kg (3.7–69.2) were included. Patients’ characteristics and procedure-related data are shown in Table 1. The median duration of extended neurological function monitoring was 130 minutes (range 80–275). Thirty-six patients (69.2%) had biventricular physiology. In the single ventricle group (30.8%), two patients presented in Norwood stage I, seven in stage II, and the remaining seven children had undergone stage III palliation. All 52 patients were initially given only midazolam; 30 patients received ketamine additionally. To maintain conscious sedation, 48 children received intravenous propofol bolus followed by continuous infusion; relying on the physician’s recommendation, four patients received merely continuous intravenous propofol infusion without prior bolus administration.
Patients´ characteristics, diagnosis and procedures (n = 52)

Table 1. Long description
A table detailing patient characteristics, diagnoses, and procedures for 52 patients. The table has 15 rows and 4 columns. Column headers are Age, Sex, Weight, Height, Body surface area, Physiology, Diagnosis, and Interventions. Row labels include various patient characteristics and procedures. The table lists specific diagnoses and interventions performed on patients, including different stages of single ventricle procedures and various diagnostic and interventional procedures. Notable entries include the distribution of sexes, weights, heights, and body surface areas, as well as specific physiological and diagnostic categories.
Data are presented as median (min-max) or % if needed. AS = aortic valve stenosis; BAP = balloon angioplasty; BV = biventricular heart; BVP = balloon valvuloplasty; CoA = Coarctation of the aorta; DORV = double outlet right ventricle; dTGA = dextro transposition of the great arteries; HLHS = hypoplastic left heart syndrome; HTX = heart transplantation; HRHS = hypoplastic right heart syndrome; IAA = interrupted aortic arch; IVC= inferior vena cava; MAPCA = major aortic pulmonary collateral artery; PA = pulmonary artery; PDA = patent ductus arteriosus; PS = pulmonary valve stenosis; SV = single ventricle, SVC = superior vena cava; s/p = status post; TAPVD = total anomalous pulmonary venous connections; VSD = ventricular septal defect.
Alterations in vital signs, cerebral oxygenation, and cerebral activity after propofol administration
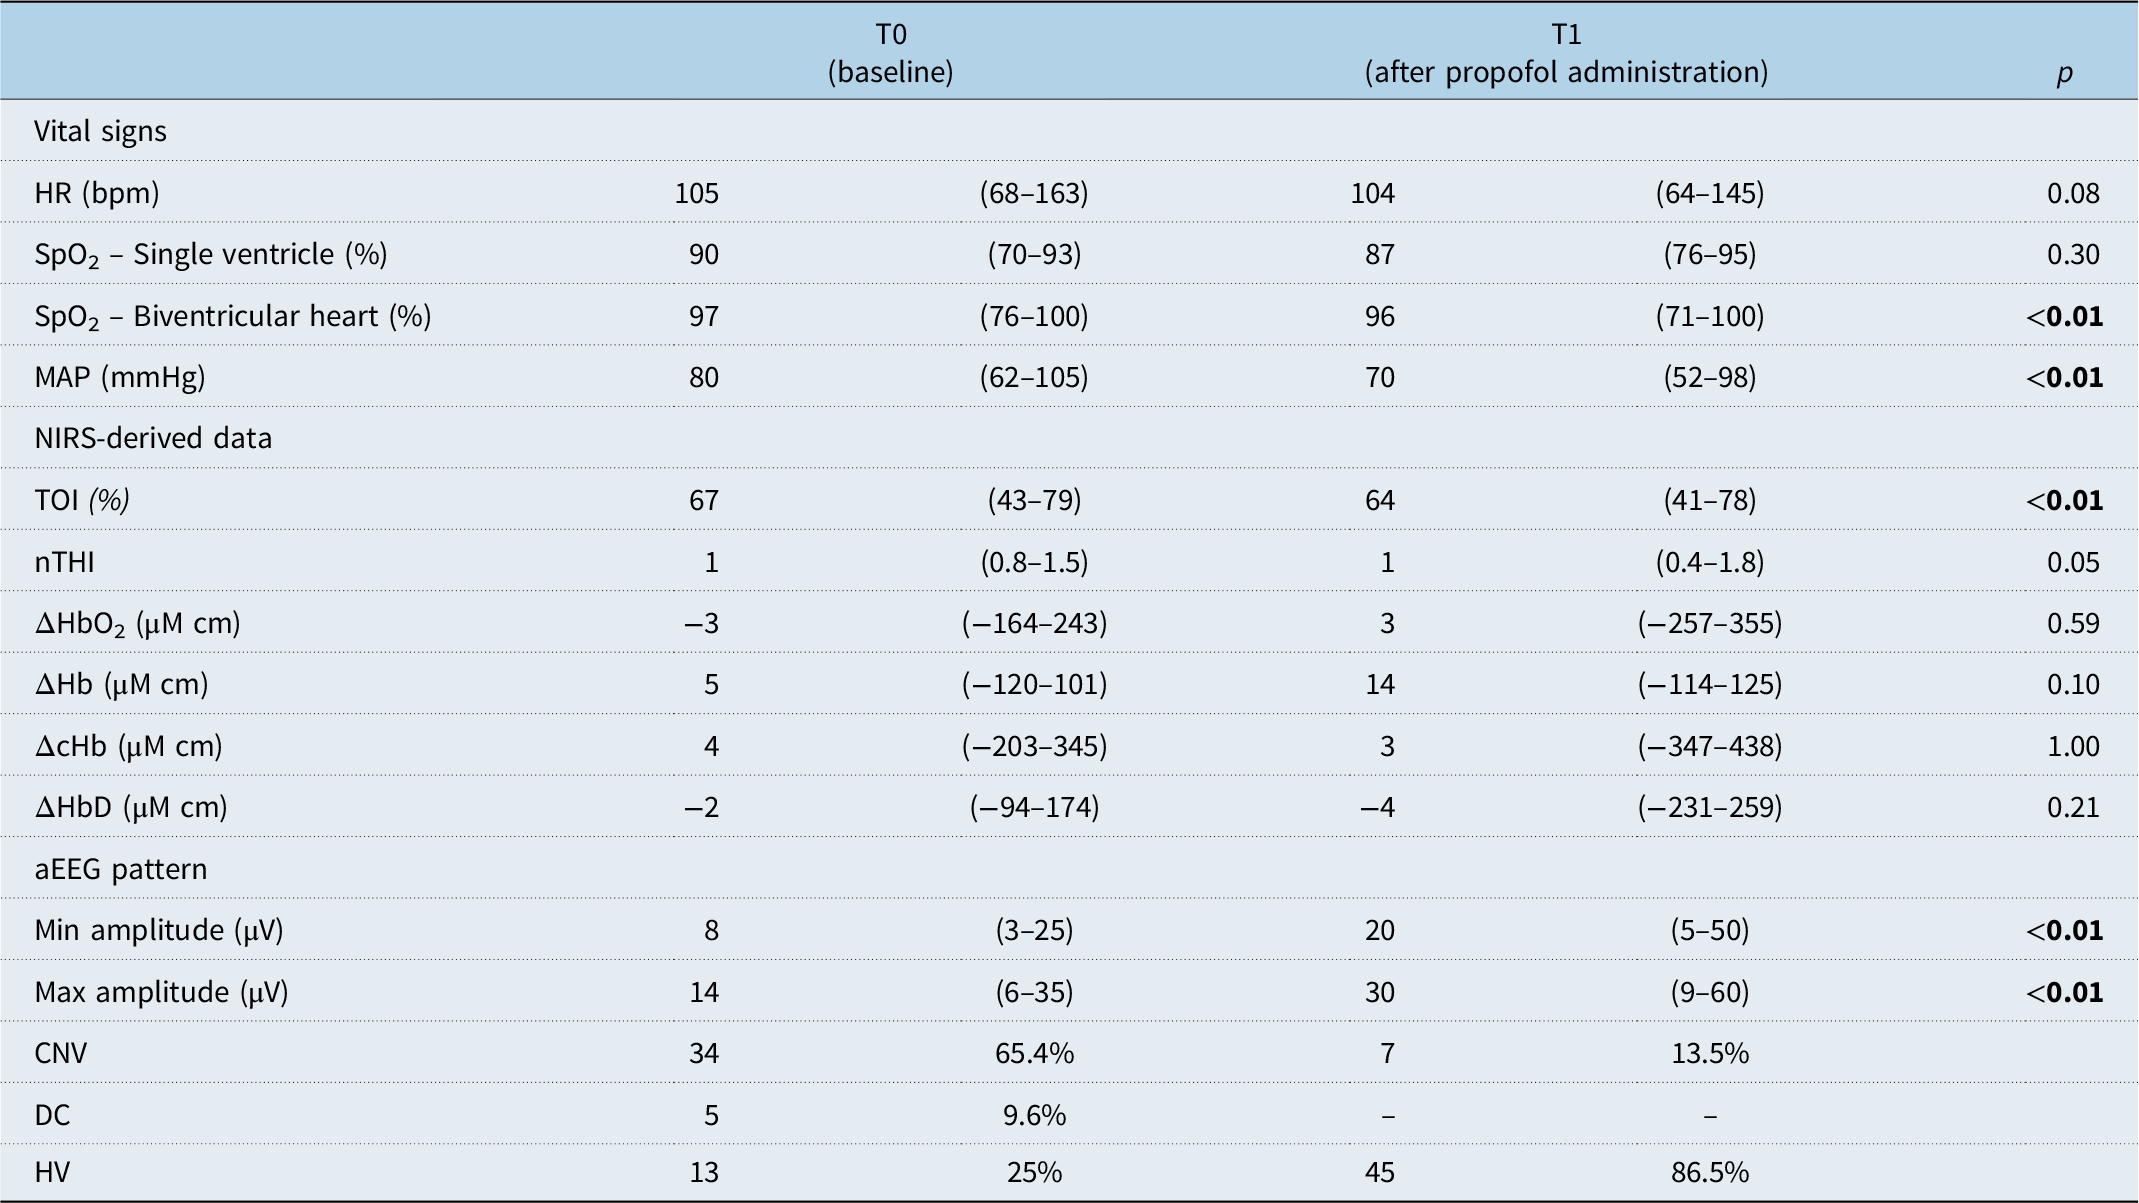
As shown in Table 2, after propofol administration, we recorded a drop in mean arterial pressure [p < 0.01] and in saturation levels. No relevant drug-related hypotension was diagnosed. Oxygen supplementation was started in case of hypoxia. Near-infrared spectroscopy-derived data revealed a decrease in tissue oxygenation index [p < 0.01] and ΔHb. Tissue oxygenation index dropped a median 2.5% from baseline values (range −12–16.8%). Six of our patients revealed a drop of over 10%, but no patient presented a drop in tissue oxygenation index over 20% from baseline. Amplitude-integrated electroencephalography showed a significant increase in both minimum and maximum amplitudes [p < 0.01]. amplitude-integrated electroencephalography changed to mainly HV pattern unlike the continuous and discontinuous pattern during the baseline.
Alterations in vital signs, NIRS-derived data, and aEEG patterns (n = 52)

Table 2. Long description
A table comparing vital signs, NIRS-derived data, and aEEG patterns before and after propofol administration. The table has 12 rows and 4 columns. Column headers are T0 (baseline), T1 (after propofol administration), and p. Row labels include HR (bpm), SpO2 - Single ventricle (percent), SpO2 - Biventricular heart (percent), MAP (mmHg), TOI (percent), nTHI, ΔHbO2 (μM cm), ΔHb (μM cm), ΔcHb (μM cm), ΔHbD (μM cm), Min amplitude (μV), Max amplitude (μV), CNV, DC, and HV. Each row provides median values and ranges for T0 and T1, along with p-values indicating statistical significance. Notable trends include decreases in MAP, TOI, and increases in min and max amplitudes of aEEG patterns after propofol administration.
Data are presented as median (min-max) or number (%). CNV = continuous normal voltage; DC = discontinuous; HR = heart rate; HV = high voltage; MAP = mean arterial blood pressure; SpO2 = oxygen saturation; T0 = baseline after initiation of conscious sedation with midazolam; T1 = after propofol administration to maintain conscious sedation. Statistically significant values are highlighted in bold.
Near-infrared spectroscopy and amplitude-integrated electroencephalography alterations after propofol administration
We observed a rise in amplitude-integrated electroencephalography amplitudes in 90.4% of patients immediately after propofol bolus administration. Forty-five children exhibited an high voltage pattern after a median of one minute (0−5 minutes), whereas two children showed a continuous pattern. The raw EEG revealed a transition from a high-frequency, low-amplitude rhythm to a lower-frequency, higher-amplitude rhythm (Figure 1a). The amplitude-integrated electroencephalography of three children without initial propofol bolus administration, but continuous propofol infusion also revealed a rise in amplitudes but with a 10-minute median latency (10−15 minutes). During cardiac catheterisation, 36 patients received at least one and up to seven additional propofol bolus doses. A renewed increase in amplitude-integrated electroencephalography was reproduced immediately after each bolus (Figure 1b). We observed a pathological amplitude-integrated electroencephalography pattern in one patient following repeated bolus applications. This child received, in total, five bolus doses within 30 minutes, with a cumulative IV dosage of 9.7 mg/kg combined with an increase in the propofol infusion rate up to a max. of 14 mg/kg/hr. Interestingly, after his fifth bolus, we recorded a sudden transition from high voltage to flat tracing for seven minutes, which returned to the previous pattern passing through an intermediate burst-suppression pattern. After receiving another bolus 40 minutes later, the child again displayed an abrupt transition to flat tracing. The raw electroencephalography during this episode revealed no electrocortical activity. After a 10-minute flat pattern episode, a 20-minute phase with burst-suppression pattern followed, and the initial high voltage pattern finally reappeared (Figure 1c). At timepoint T2, we recorded a slow decline to baseline in 28 patients; at (T0) we noted an amplitude-integrated electroencephalography pattern after a median two minutes (0−5 minutes) (Figure 1d). Thirty patients demonstrated a baseline amplitude-integrated electroencephalography pattern at timepoint T3. We observed neither clinical nor electrocortical seizures at any time among the entire study cohort during cardiac catheterisation.
Alterations in aEEG patterns after propofol administration* (modified original screenshots). ( a ) Two screenshots from the same patient each with aEEG marked with timepoint t0 and t1 (top) and a corresponding raw EEG (bottom). Timepoint of raw EEG indicated by dashed line in both screenshots, upper picture during t0 and lower picture during t1. aEEG amplitudes increased after propofol bolus administration (P1) to HV, at that time the EEG shows a transition to a lower frequency with higher amplitudes. ( b ) P1 indicates initial Propofol Bolus. P2 to P5 indicate the timepoints of additional propofol bolus doses. The aEEG pattern had almost returned to baseline values before administration, whereas there was a renewed increase after additional administration of propofol. ( c ) Overview of the aEEG recording. P1 marks the initial Propofol-Bolus, P5 and P7 mark the 5th and 7th Bolus respectively. Additionally, the arrow with Phenobarbital written above, marks a bolus of Phenobarbital. After P5 and P7 flat tracing pattern occurs with slow restitution via a burst suppression pattern. ( d ) Two screenshots from the same patient each with aEEG marked with timepoint t0, t2 and t3 (top) and a corresponding raw EEG (bottom). Timepoint of raw EEG indicated by dashed line in both screenshots, upper picture during t3 and lower picture during t0. After initial propofol bolus administration P1, there is a 10-minute gap due to the loss of electrodes. During t2 and t3 a slow but continuous decline in the high-voltage pattern has occurred. The corresponding raw EEG shows a high-frequency, low-amplitude rhythm consistent with the baseline level.

Near-infrared spectroscopy-derived data showed variable alterations with a predominant decrease in tissue oxygenation index, normalized tissue hemoglobin index, ΔcHb, ΔHbO2 and an increase in ΔHb, although these changes were not consistent in every patient (Figure 2a). Repetitive propofol bolus doses also showed no consistent pattern within the near-infrared spectroscopy parameters we examined.
Alterations in NIRS during propofol administration, cardiac interventions and cardiac arrhythmias. (Original NIRS data screenshot. Red = ΔHbO2, white = ΔcHb, blue = ΔHb, green = TOI, yellow = nTHI) ( a ) NIRS while inducing conscious sedation (red line). After propofol administration, NIRS showed a decrease in TOI, nTHI, ΔcHb and ΔHbO2, with an increase in ΔHb. ( b ) Balloon valvuloplasty of the aortic valve (red line). NIRS showed a sharp drop in TOI, nTHI, ΔHbO2, and ΔcHb with concurrently increased ΔHb after balloon inflation, followed by recovery to baseline levels after deflation. ( c ) Balloon angioplasty of the aortic arch (red line). NIRS showed an increase in TOI and ΔHbO2 with simultaneously lower ΔHb during balloon inflation, 30 seconds after deflation the opposite changes occurred, followed by a normalization to baseline levels. ( d ) Two balloon valvuloplasties of a pulmonary valve (each red line). A decrease in TOI and ΔHbO2 accompanied by a simultaneous rise in ΔHb were recorded, followed by a complete recovery to baseline levels. ( e ) Episode of transient supraventricular tachycardia (red line). Note the short-term decrease in TOI, nTHI and ΔHbO2, ΔcHb and nTHI with a concomitant increase in ΔHb.

Amplitude-integrated electroencephalography and near-infrared spectroscopy alterations during specific cardiac interventions and cardiac arrhythmias
The dobutamine stress test and interventions such as patent ductus arteriosus closure, myocardial biopsy, major aortopulmonary collateral artery closure, and vena cava interventions revealed no consistent impact on amplitude-integrated electroencephalography patterns or on near-infrared spectroscopy-derived data during diagnostic cardiac catheterisation,
Five out of the six patients who underwent balloon valvuloplasty of the aortic valve or aortic arch interventions experienced changes in cerebral tissue oxygenation. One child showed a sharp, one-minute drop in tissue oxygenation index, normalized tissue hemoglobin index, ΔHbO2, and ΔcHb with concurrently increased ΔHb during balloon inflation for valvuloplasty of the aortic valve, followed by recovery to baseline levels after deflation (Figure 2b). Four children showed an increased tissue oxygenation index and ΔHbO2 with simultaneously lower ΔHb during balloon inflation for aortic arch intervention; 30 seconds after deflation, the opposite changes occurred, followed by a return to baseline levels (Figure 2c). Five of eight patients showed a decrease in tissue oxygenation index and ΔHbO2 with a simultaneous increase in ΔHb for 1−5 minutes followed by complete return to baseline levels during branch PA intervention. We observed a similar pattern in two patients who underwent repetitive balloon valvuloplasty for pulmonary valve stenosis (Figure 2d). No other intervention showed any influence on near-infrared spectroscopy values. None of the interventions performed in our study population resulted in any amplitude-integrated electroencephalography abnormality.
Two patients experienced cardiac arrhythmias during catheterisation. One patient suffered from supraventricular tachycardia, which we terminated with electrical cardioversion, which had no effect on the near-infrared spectroscopy. The other patient experienced an atrioventricular block with 2:1 conduction. During both episodes we identified a short-term drop in tissue oxygenation index, normalized tissue hemoglobin index, ΔcHb, and ΔHbO2 with a concomitant rise in ΔHb (Figure 2e). This patient’s amplitude-integrated electroencephalography revealed no irregularities during these transient cardiac arrhythmias.
Discussion
Noninvasive, extended neurological function was successfully monitored in this study in 52 paediatric patients undergoing cardiac catheterisation while consciously sedated. The simultaneous use of amplitude-integrated electroencephalography and near-infrared spectroscopy proved to be feasible and yielded important data on cerebral oxygenation and electrocortical activity.
In our population, the administration of propofol resulted in a significant increase in amplitude-integrated electroencephalography amplitude with a concomitant change in the background pattern from continuous to high voltage in 86.5% of patients. In contrast, a shift from a predominantly continuous to a discontinuous pattern was observed in previous amplitude-integrated electroencephalography studies in neonates during heart surgery. Reference Gunn, Beca and Penny5,Reference Gunn, Beca, Hunt, Olischar and Shekerdemian6,Reference Muehlschlegel, Kubicki and Jacobs-LeVan12 Hypothermia often causes additional suppression of electrocortical activity with burst-suppression or even flat tracing patterns. The amplitude-integrated electroencephalography pattern begins to regenerate upon rewarming. Reference Gunn, Beca and Penny5,Reference Muehlschlegel, Kubicki and Jacobs-LeVan12 Studies of heart-healthy preterm and full-term neonates under general anaesthesia reported similarly suppressed amplitude-integrated electroencephalography patterns. Reference Thewissen, Caicedo and Dereymaeker13 On the other hand, McKeever et al. observed an increase in amplitude-integrated electroencephalography amplitudes in children of a widely varying ages undergoing volatile or intravenous anaesthesia. Reference Mckeever, Johnston and Davidson14 Parallels are often drawn between the state of conscious sedation and sleep. Therefore, our findings align with the results of Löffelhardt et al., who also demonstrated increased amplitude-integrated electroencephalography amplitudes in healthy children during natural sleep. Reference Löffelhardt, Della Marina and Greve15 Propofol is thought to promote reduced brain activity via GABAA receptors, which is reflected in the electroencephalography as a lower frequency and higher amplitude, resembling natural sleep. Reference Moody, Zhang and Vincent16,Reference Brown, Lydic and Schiff17 In line with this, we obtained similar amplitude-integrated electroencephalography results immediately after administering propofol boluses, matching its pharmacokinetic properties. Reference Chidambaran, Costandi and D’Mello18 Propofol boluses during catheterisation led to renewed increases in amplitude-integrated electroencephalography amplitudes, possibly due to reestablished effective concentrations and propofol´s GABAA interaction. Incidentally, higher concentrations of propofol trigger a GABAA-independent inhibitory effect reflected in reduced electrocortical activity. Reference Sahinovic, Struys and Absalom19 This may underlie the amplitude-integrated electroencephalography phenomenon detected in one of our patients, who showed flat tracing with subsequent burst-suppression and a return to the previous high-voltage pattern after repeated propofol boluses. The reason for repeated bolus administrations was usually that the patient seemed to be “wake up” and began moving, which interfered with the interventionist’s work. As shown in Figure 1b, the aEEG correlated with the onset of an arousal response. Our results demonstrate that amplitude-integrated electroencephalography suppression patterns (indicative of excessive sedation depth) are not uncommon in children receiving continuous propofol infusions supplemented by bolus doses. These effects of propofol bolus administration on brain activity are of practical significance. We recommend carefully evaluating the depth of sedation, the bolus doses, and the total dose of propofol in such situations; alpha-2 agonists such as dexmedetomidine can help reduce propofol consumption. For this reason, we would propose using amplitude-integrated electroencephalography, especially for clinicians with less experience in administering conscious sedation, as it provides valuable insight into the depth of sedation. This can enhance patient safety. Our findings indicate that the amplitude-integrated electroencephalography alterations we observed during conscious sedation with propofol reveal reduced but preserved electrocortical activity. However, the implications for long-term neurological development are unclear. There is strong evidence that an amplitude-integrated electroencephalography pattern recovery within 48 h post-surgery is linked to better motor development, while a delayed recovery correlates with cognitive and motor deficits. Burst-suppression, low voltage, and flat tracing are all associated with a poorer outcome. Reference Latal, Wohlrab and Brotschi4–Reference Gunn, Beca, Hunt, Olischar and Shekerdemian6 Our cohort’s amplitude-integrated electroencephalography normalised within minutes after propofol cessation, consistent with propofol’s rapid offset. Reference Chidambaran, Costandi and D’Mello18
We fortunately observed no seizures during our study. Seizures are frequently documented preoperatively in neonatal cardiac surgery and are associated with a worse neurological outcome. Reference Marino, Lipkin and Newburger1,Reference Gunn, Beca, Hunt, Olischar and Shekerdemian6,Reference Muehlschlegel, Kubicki and Jacobs-LeVan12,Reference Sanchez-de-Toledo, Chrysostomou and Munoz20 However, although paediatric case reports of seizures following cardiac catheterisation do exist, their incidence is only 0.6%, making this a rare complication. Reference Liu, Wong and Leung21 That said, it is important to acknowledge the antiepileptic action of propofol and to keep in mind that amplitude-integrated electroencephalography has been validated in neonates and young children, but there is little data indicating whether it is still a sensitive method in adolescents. Conventional full scalp EEG remains the gold standard in seizure diagnostics.
The tissue oxygenation index decreased significantly in our cohort after conscious sedation was initiated. This evidence aligns with observations of decreased tissue oxygenation after propofol during neonatal intubation. Reference Thewissen, Caicedo and Dereymaeker13 Furthermore, we demonstrated that a drop in pulse oximetry-measured oxygen saturation is associated with a decreasing tissue oxygenation index. Chaix et al. reported stable tissue oxygenation during preoxygenation in adults, but tissue oxygenation decreased during continuous anaesthesia with a reduced oxygen supply, suggesting that the oxygen supply may have a stronger influence on near-infrared spectroscopy than sedation alone. Reference Chaix, Manquat and Liu22 A Fleck et al. study finding seems to stand in contradiction to ours, as they observed increasing tissue oxygenation index during sedation. Reference Fleck, Schubert and Ewert23 One explanation for this difference may be their different approach to additive oxygen supplementation, where Fleck et al. excluded these patients from their study, which we did not. The need for additive oxygen supplementation is usually indicated by a drop in pulse oximetry-measured oxygen saturation, which, as we demonstrated, is associated with a decreasing tissue oxygenation index.
Contrary to propofol’s known reduced cerebral metabolism and oxygen demand effects, the drop in tissue oxygenation index our study cohort revealed suggests an unmet cerebral oxygen need, supported by elevated ΔHb values. The decrease in tissue oxygenation index may also indicate a reduced oxygen supply to the brain, possibly caused by reduced cerebral blood flow, potentially attributable to propofol’s hypotensive effect. Although our cohort’s mean drop in blood pressure was 12.8%, less than the 50% hypotension induced by Tsuji et al. in animal models, one cannot rule out a contributing effect on lowering the cerebral blood flow. Reference Tsuji, Duplessis, Taylor, Crocker and Volpe11 The implications of reduced tissue oxygenation for neurological outcomes in CHD are not fully understood. Reference Simons, Sood, Derby and Pizarro24,Reference Kussman, Wypij and Laussen25 Drops exceeding 20% from baseline are considered potential risk factors for poorer neurodevelopmental outcomes. Reference Sanchez-de-Toledo, Chrysostomou and Munoz20,Reference Simons, Sood, Derby and Pizarro24 In this study, the tissue oxygenation index fell by only 3.6 in absolute percentage points and 2.5% from baseline.
We have also demonstrated that certain interventions that influence cardiac output, e.g., balloon valvuloplasty of the aortic valve, balloon angioplasty of the aortic isthmus, and pulmonary artery interventions, induce specific alterations in near-infrared spectroscopy. Balloon angioplasties of the aortic isthmus triggered a consistent biphasic pattern of briefly elevated followed by decreased tissue oxygenation. During balloon inflation, the stroke volume may be transiently redirected towards the cerebral vessels, increasing cerebral blood flow. Balloon deflation restores the descending aortic flow, potentially reducing cerebral perfusion. Since no other intervention led to changes in near-infrared spectroscopy values, these interventions seem to have a stronger impact on haemodynamics than others. The brief nature of these interventions may temporarily overwhelm cerebral autoregulation—a hypothesis supported by Tsuji et al., who observed reduced cerebral blood flow within seconds of a blood pressure drop of over 50%, and by Abdul-Khaliq et al., who observed the most changes in cerebral oxygenation during alternating haemodynamics, e.g., changes due to cardiopulmonary bypass in neonatal piglet heart surgery. Reference Tsuji, Duplessis, Taylor, Crocker and Volpe11,Reference Abdul-Khaliq, Troitzsch and Schubert26 Similarly, the abrupt reductions in tissue oxygenation index observed during balloon valvuloplasty of the aortic valve stenosis can be attributed to transient cessation of the systemic cerebral blood flow. A brief decrease in the tissue oxygenation indexduring pulmonary valve and artery interventions is likely due to altered lung haemodynamics. These findings are consistent with the results from Tanidir and De Vries et al. Reference Tanidir, Ozturk and Ozyilmaz27,Reference De Vries, Hoorntje and Sreeram28 Finally, the changes we observed probably have no neurological consequences, as tissue oxygenation index differences were small and normalised quickly. Supraventricular tachycardia can impair cardiac output and systemic haemodynamics, thus affecting cerebral blood flow and oxygenation—consistent with our findings in two patients with cardiac arrhythmias. Reference Hershenson, Ro and Miao29
We observed no specific amplitude-integrated electroencephalography changes in either cardiac catheter interventions or cardiac arrhythmias. This could be due to amplitude-integrated electroencephalography´s low sensitivity to brief events, as it displays an average amplitude over 15-second electroencephalography segments. In addition, the raw electroencephalographies showed no changes, suggesting that brief catheter interventions might not affect electrocortical activity.
For clinical practice, we recommend a risk-adapted, tiered approach: near-infrared spectroscopy as a selective standard add-on for high-risk patients, and amplitude-integrated electroencephalography in selected high-risk scenarios, particularly in neonates, patients with complex heart defects, haemodynamic instability, patients with pulmonary hypertension, interventions associated with alterations in cardiac output, as well as during anticipated prolonged, complex procedures. Furthermore, cost-effectiveness and resource utilisation currently support a selective approach. Near-infrared spectroscopy is technically easy to integrate; the practical effort involved stems less from attaching the sensors than from the subsequent steps: setting alarm thresholds, analysing the data, etc. In this regard, amplitude-integrated electroencephalography is more resource intensive, as it requires more effort to interpret the data and therefore offers plausible added value only in high-risk scenarios. In addition to the cost of consumables, there are costs for equipment, maintenance, and calibration. Neuromonitoring can assist in procedure-related decision-making. It should be viewed as a multimodal safety strategy, for example, in limiting periods of hypoperfusion, but should not serve as the sole parameter for determining the duration of balloon inflation or other interventions.
Finally, with this study, we were able to demonstrate that the use of conscious sedation during a cardiac catheterisation procedure is not inferior to general anaesthesia. No sustained adverse effects on cerebral monitoring parameters were observed. Moreover, conscious sedation during cardiac catheterisation can often prevent or reduce unpleasant haemodynamic side effects. This can be particularly beneficial for patients in whom positive-pressure ventilation is haemodynamically unfavourable, such as those with Fontan circulation. This finding reinforces confidence in the use of conscious sedation for paediatric catheter interventions.
Study limitations
Our feasibility study has several limitations that could affect our results. For one, our study cohort with just 52 paediatric patients is relatively small and heterogeneous because of the broad range of various heart diseases included and the children’s wide age range. This means that our data cannot be readily generalised across a population of patients with congenital heart defects. Second, the amplitude-integrated electroencephalography classification by L. Hellström-Westas is used predominantly in neonates and infants, which restricts the comparability with older patients in our study. Additionally, there are insufficient data showing that amplitude-integrated electroencephalography is capable of accurately detecting seizures in adolescent patients. Finally, our study patients have not yet been neurologically reassessed.
Conclusion
Paediatric cardiac catheterisation under conscious sedation is associated with a high degree of patient safety. This study highlights the importance of extended neurological monitoring during paediatric cardiac catheterisation, revealing that while propofol sedation can temporarily reduce cerebral tissue oxygenation, it also preserves electrocortical activity resembling natural sleep. By providing real-time insights into brain function and oxygenation, this approach may be helpful in optimising sedation management, especially in high-risk patients and for less experienced medical staff.
Acknowledgements
We thank Carole Cürten for language editing.
Financial support
We are deeply grateful for the amplitude-integrated electroencephalography kindly donated by the “Kinderherzen, Fördergemeinschaft Deutsche Kinderherzzentren e.V.,” Elsa-Brandström-Str. 21, 53225 Bonn, Germany.
Competing interests
None.
Ethical standard
The authors assert that all procedures contributing to this work comply with the ethical standards and with the Helsinki Declaration of 1975, as revised in 2008, and have been approved by the institutional committees (University of Freiburg Medical Centre; the application number was 298/19).


 Open access

