1. Introduction
Simultaneous localization and mapping (SLAM), aiming to estimate the moving system’s pose and construct a 3D map for the unknown environments, is widely used in applications such as self-driving cars, AGV, and unmanned aerial vehicles [Reference Cadena, Carlone, Carrillo, Latif, Scaramuzza, Neira and Reid1–Reference Yekkehfallah, Yang, Cai, Li and Wang3]. Among all SLAM techniques, the visual SLAM, which utilizes a camera as the primary sensor, has attracted more and more attention due to its simple configuration and low cost. In the last decade, various visual SLAM programs have been proposed, such as PTAM [Reference Klein and Murray4], SVO [Reference Forster, Pizzoli and Scaramuzza5], and ORB-SLAM [Reference Mur-Artal, Montiel and Tardos6]. Compared with the pure vision methods, with the aid of an inertial measurement unit (IMU), the visual-inertial odometry (VIO) [Reference Nützi, Weiss, Scaramuzza and Siegwart7–Reference Leutenegger, Lynen, Bosse, Siegwart and Furgale9] can achieve better accuracy and robustness.
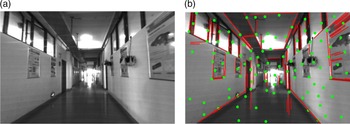
Most current popular SLAM/VIO systems only use point features as landmarks and rarely use the environment’s prior geometric information. When the scene is poorly texture or has weak illumination, the quality of point features worsens and results in a large drift of the reconstructed map and low positioning accuracy. In such cases, line features are good complements to point landmarks. Compared with point features, line features can better depict the geometric structure information of the environment. More importantly, as shown in Fig. 1, in such a structural building scene that can be seen everywhere, most spatial straight lines are parallel or orthogonal to each other. These parallel or orthogonal structural lines encode the global orientation information of the scene. If these structural lines are used as landmarks in a VIO system, the accumulated orientation errors can be eliminated, thereby improving the positioning accuracy.
(a) Typical structured environment; (b) point features and line features extracted from the environment.

The Manhattan world assumption [Reference Coughlan and Yuille10] can be used to describe such a structural scene. In a Manhattan world frame, the three axes are orthogonal to each other, and all structural lines are aligned with the directions of the three axes. A Manhattan world frame can be seen as a structural scene with a unified orientation. The structural scene is modeled as a Manhattan world, and its global orientation can be roughly estimated according to the image observations of structural lines and optimized later. With the Manhattan world assumption, the structural lines can be parameterized simply.
Previous works [Reference Pumarola, Vakhitov, Agudo, Sanfeliu and Moreno-Noguer11–Reference Zhao, Huang, Yan and Dissanayake13] have demonstrated that using both points and lines as landmarks in SLAM systems can achieve better performance than only using one of them. However, researchers seldomly consider the correlation between points and lines. They often separately establish the visual measurement residual constraints of points and lines and then add these residuals to a unified optimization framework. Such operations mean that the point features and line features are treated independently. However, as shown in Fig. 1(b), most point features belong to the line features. If the property of point belonging to a line (PPBL) can be included, more prior geometric information can be introduced into the VIO system. On the one hand, it facilitates the initialization of structural line features. On the other hand, the distance constraints between a feature point and the line landmarks it belongs to in the reconstructed 3D map can be established as residual items added to optimization, thereby further reducing mapping errors and improving the positioning accuracy.
Based on the ideas mentioned above, this paper presents the SLC-VIO system, a stereo VIO that takes structural lines and points as landmarks and utilizes the PPBL. The experiments have been conducted on both public data sets and in real-world scenes to test the performance of the proposed system. The results show that compared to the existing VIO methods that do not consider the structural regularity of environments, the proposed SLC-VIO achieves higher positioning accuracy and constructs 3D maps that better reflect the structure of scenes. The main contributions of this paper are as follows:
-
(1) We take structural lines as additional landmarks in the optimization-based VIO system. The 2-DoF spatial structural lines are defined based on the Manhattan world assumption. Moreover, the Jacobian matrices related to structural lines are derived.
-
(2) We take into account the property of PPBL. This property is used to initialize the spatial structural lines and establish distance-residual constraints between spatial point and line landmarks in the reconstructed map.
-
(3) The positioning accuracy and mapping performance of the proposed SLC-VIO were tested on some public data sets and real-world experiments and compared with VINS-Fusion [Reference Qin, Li and Shen8] and PL-VIO [Reference He, Zhao, Guo, He and Yuan14].
2. Related work
Although point feature-based methods are popular in visual SLAM/VIO systems, some researchers have also tried to use line features as landmarks for pose estimation in the early years. In 1997, Neira et al. [Reference Castellanos and Tardós15] first proposed a monocular SLAM system using vertical line segments as landmarks to construct a 2D map. Their system utilizes two endpoints to denote a spatial straight line and optimizes the estimated variables based on the EKF (Extended Kalman filter) framework. Gee et al. [Reference Gee and Mayol-Cuevas16] proposed a real-time UKF-based (Unscented Kalman filter) SLAM system using line segments, where the spatial line segments are also denoted by two endpoints. Recently, Ruben et al. [Reference Gomez-Ojeda, Moreno, Zuiga-Nol, Scaramuzza and Gonzalez-Jimenez12] proposed PL-SLAM, a stereo SLAM system using both point and line features. Their system uses LSD [Reference von Gioi, Jakubowicz, Morel and Randall17] and LBD [Reference Zhang and Koch18] algorithms to detect and match 2D line features in images. The estimated variables are refined by the nonlinear optimization in the system, which minimizes a cost function composed of the re-projected errors of both points features and line features. However, they used two endpoints to denote a spatial straight line. The disadvantage of parameterizing spatial straight lines by endpoints is obvious: a spatial straight line has 4 DoF, while two endpoints introduce six parameters, thereby resulting in over-parameterization. It increases the number of variables to be optimized and makes the convergence worse during optimization.
To avoid over-parameterization, Bartoli et al. [Reference Bartoli and Sturm19] proposed the orthonormal representation, which uses four parameters to define a spatial straight line. Since then, the orthonormal representation has been adopted in many SLAM systems, which takes the line features as landmarks. In these systems, they often use Plücker coordinates to denote spatial straight lines when calculating re-projected errors and then convert the Plücker coordinates to orthogonal representation during optimization. Apart from pure visual SLAM systems, some researchers have integrated line features into VIO systems. Zheng et al. [Reference Zheng, Tsai, Zhang, Liu, Chu and Hu20] proposed a tightly coupled filtering-based stereo VIO system using both points and lines. Nevertheless, they still used two endpoints to represent a spatial straight line. In a recent work called PL-VIO [Reference He, Zhao, Guo, He and Yuan14], built upon VINS [Reference Qin, Li and Shen8], a state-of-the-art VIO system, they used both points and lines as landmarks and adopted the Plücker coordinates and orthogonal representation for line parameterization.
In recent years, some researchers considered using structural regularity in man-made building scenes to improve SLAM/VIO performance. In some pure visual SLAM [Reference Lee, Nam, Lee, Li, Yeon and Doh21] systems or VIO [Reference Camposeco and Pollefeys22] systems, they used vanishing points to reduce the accumulated orientation errors, thereby improving positioning accuracy. However, they only used line features detected in images to calculate vanishing points and then used the vanishing points to get the global orientation information of scenes. They did not use lines as landmarks. Kim et al. [Reference Kim and Oh23] proposed a SLAM method using vertical lines detected from an omni-direction camera image. In ref. [Reference Zhang, Kang and Suh24], Zhang et al. proposed a monocular SLAM system that used vertical lines and floor lines as landmarks. Besides, they also used vanishing points to reduce accumulated heading error and to perform loop closing. Zhou et al. [Reference Zhou, Zou, Pei, Ying, Liu and Yu25] proposed an EKF-based visual SLAM system using the building’s structure lines. In their system, each structural line is represented by a point on a parameterizing plane and a dominant direction. Another VIO system [Reference Tardif26] also uses similar methods for representing structural lines. In the recent work named StructVIO [Reference Zou, Wu, Pei, Ling and Yu27], Zou et al. proposed an EKF-based VIO system that adopts multiple Manhattan worlds to model the structural scenes. In their work, structural lines are defined in a local Manhattan world, which allows their system to deal with structural lines in multiple different orientations. However, among all these SLAM/VIO systems that adopt both points and lines or structural lines as landmarks, the correlation between points and lines is not considered.
3. System overview
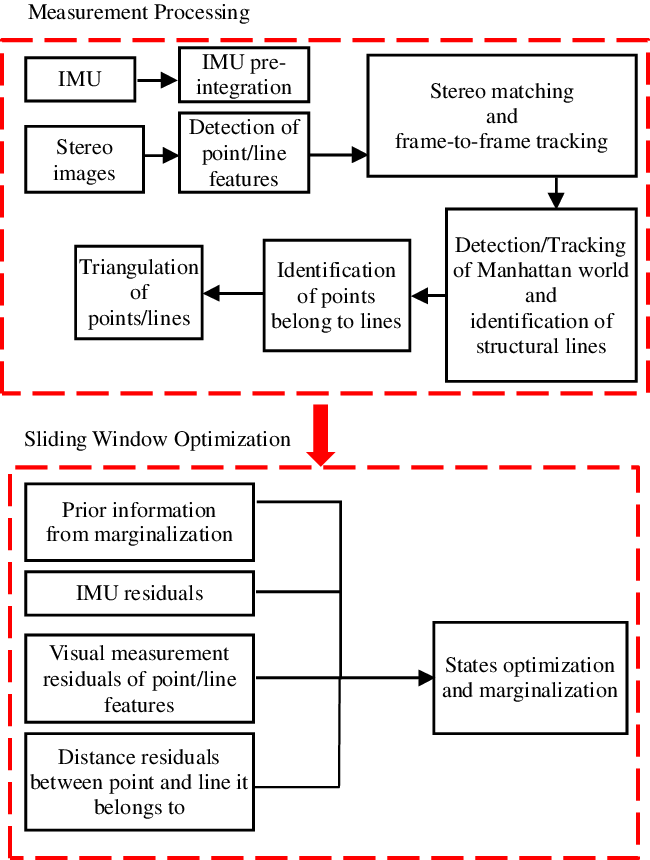
The framework of the proposed SLC-VIO system is shown in Fig. 2. It is divided into two sections: measurement processing and sliding window optimization. The system starts with the measurement processing, where the measurements from IMU and stereo images are processed. By propagating the IMU measurements forward, the initial value of the latest IMU pose can be obtained. In addition, the residual for preintegrating IMU measurements within two consecutive camera frames are added to sliding window optimization. The point and line features are detected and tracked by two separate threads in stereo image processing. Based on the detected 2D line features, the system detects the Manhattan world and identifies structural lines. Then, according to the image observations in images, the system identifies the PPBL. Finally, points and structural lines are triangulated to obtain an initial estimation of their spatial position.
Flowchart of the proposed SLC-VIO.

The sliding window optimization proceeds with a sliding window-based tightly coupled optimization framework that fuses the preintegration constraints of IMU, the visual measurement constraints of point and structural line features, and the distance constraints between the point and the line landmarks it belongs to. In the sliding window, to limit the size of the state vector, marginalization is adopted. Some measurements related to marginalized states are converted into prior information.
4. Definition of structural lines
A structural scene is modeled as a Manhattan world. The Manhattan world frame
 $ \left\{\boldsymbol{{M}}\right\}$
is established with its origin coinciding with the origin of the global world frame
 $ \left\{\boldsymbol{{W}}\right\}$
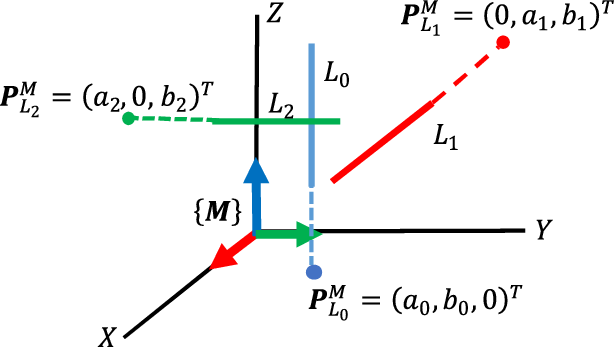
where odometry starts. The three coordinate axes of the Manhattan world frame are aligned with the structural lines. Especially, the Z-axis of the Manhattan world frame is aligned with the vertical lines. The orientation of the Manhattan world frame in the global world frame can be initially estimated according to the image observations of structural lines. Figure 3 shows the Manhattan world model and the structural lines in it.
Illustration of the Manhattan world model and the structural lines.
 ${L_0}$
,
 ${L_1}$
, and
 ${L_2}$
are 3D structural lines.
 ${\textit P}_{{L_0}}^M$
,
 ${\textit P}_{{L_1}}^M$
, and
 ${\textit P}_{{L_2}}^M$
are their respective intersection point on coordinate planes of the Manhattan world frame
 $\left\{{\textit {M}} \right\}$
.

For a spatial structural line, regardless of its endpoints, there must be an intersection point on the Manhattan world frame’s coordinate plane. For example, as shown in Fig. 3,
 $ {L}_{0}$
is a vertical line and intersects the X-Y plane of the Manhattan world frame
 $ \left\{\boldsymbol{{M}}\right\}$
with point
 $ {\boldsymbol{{P}}}_{{L}_{0}}^{M}={\left({a}_{0},{b}_{0},0\right)}^{T}$
The direction vector of
 $ {L}_{0}$
in the Manhattan world frame is
 $ {\boldsymbol{{d}}}_{{L}_{0}}^{M}={\left(0,0,{1}\right)}^{T}$
. Similarly, for the horizontal structural lines such as
 $ {L}_{1}$
and
 $ {L}_{2}$
, their intersection points on the coordinate planes of
 $ \left\{\boldsymbol{{M}}\right\}$
are
 $ {\boldsymbol{{P}}}_{{L}_{1}}^{M}={\left({a}_{1},0,{b}_{1}\right)}^{T}$
and
 $ {\boldsymbol{{P}}}_{{L}_{2}}^{M}={\left(0,{a}_{2},{b}_{2}\right)}^{T}$
, respectively, and their direction vectors in
 $ \left\{\boldsymbol{{M}}\right\}$
are
 $ {\boldsymbol{{d}}}_{{L}_{1}}^{M}={\left(\textrm{0,1,0}\right)}^{T}$
and
 $ {\boldsymbol{{d}}}_{{L}_{2}}^{M}={\left(\textrm{1,0,0}\right)}^{T}$
, respectively. Generally, the direction vector
 $ {\boldsymbol{{d}}}_{{L}_{l}}^{M}$
of a spatial structural line
 $ {L}_{l}$
can be obtained by identifying structural line features from all detected line features in the image and then used as fixed parameters. Each spatial structural line is considered as an infinitely long straight line. So, as long as the two nonzero parameters
 $ \left({a}_{l},{b}_{l}\right)$
of the intersection point
 $ {\boldsymbol{{P}}}_{{L}_{l}}^{M}$
are determined, the 3D structural line
 $ {L}_{l}$
in the Manhattan world can also be determined. As a result, a spatial straight line with 4-DoF becomes a structural line with only 2-DoF in the Manhattan world frame.
In the following descriptions, in order not to consider the camera intrinsic parameters, all image observations are transformed from pixel coordinates to homogeneous coordinates in the camera frame. To re-project a spatial structural line
 $ {L}_{l}$
onto the homogeneous coordinate plane in the camera frame
 $ \left\{{\boldsymbol{{C}}}_{i}\right\}$
(i is the sequence number of camera frames in sliding window), it requires to transform its intersection point
 $ {\boldsymbol{{P}}}_{{L}_{l}}^{M}$
and direction vector
 $ {\boldsymbol{{d}}}_{{L}_{l}}^{M}$
from
 $ \left\{\boldsymbol{{M}}\right\}$
to the camera frame (
C
i
).
 \begin{align} {\boldsymbol{{P}}}_{{L}_{l}}^{{C}_{i}}={\boldsymbol{{R}}}_{{WC}_{i}}^{-1}\left({\boldsymbol{{R}}}_{WM}{\boldsymbol{{P}}}_{{L}_{l}}^{M}-{\boldsymbol{{t}}}_{{WC}_{i}}\right)\end{align}
 \begin{align} {\boldsymbol{{d}}}_{{L}_{l}}^{{C}_{i}}={\boldsymbol{{R}}}_{{WC}_{i}}^{-1}{\boldsymbol{{R}}}_{WM}{\boldsymbol{{d}}}_{{L}_{l}}^{M}.\end{align}
 $ {\boldsymbol{{R}}}_{WM}$
in (1) and (2), a rotation matrix, represents the orientation of the Manhattan world frame
 $ \left\{\boldsymbol{{M}}\right\}$
in the global world frame
 $ \left\{\boldsymbol{{W}}\right\}$
.
 $ {\boldsymbol{{R}}}_{W{C}_{i}}$
and
 $ {\boldsymbol{{t}}}_{W{C}_{i}}$
represent the orientation and translation of the camera frame
 $ \left\{{\boldsymbol{{C}}}_{i}\right\}$
in the global world frame
 $ \left\{\boldsymbol{{W}}\right\}$
, respectively.
 $ {\boldsymbol{{P}}}_{{L}_{l}}^{{C}_{i}}={\left({p}_{1},{p}_{2},{p}_{3}\right)}^{T}$
and
 $ {\boldsymbol{{d}}}_{{L}_{l}}^{{C}_{i}}={\left({d}_{1},{d}_{2},{d}_{3}\right)}^{T}$
are coordinates of the intersection point and direction vector in the camera frame
 $ \left\{{\boldsymbol{{C}}}_{i}\right\}$
, respectively. The corresponding ones in homogeneous coordinates are
 $ {\boldsymbol{\mathcal{P}}}_{{L}_{l}}^{{C}_{i}}={\left({p}_{1}/{p}_{3},{p}_{2}/{p}_{3},1\right)}^{T}$
and
 $ {\boldsymbol{{d}}}_{{L}_{l}}^{{C}_{i}}={\left({d}_{1}/{d}_{3},{d}_{2}/{d}_{3},1\right)}^{T}$
, respectively.
The homogeneous coordinate of a direction vector in the camera frame represents a vanishing point that is a common intersection point of a set of observed 2D line features. The spatial lines corresponding to the set of observed 2D line features are aligned with this direction vector. So, the homogenous coordinate
 $ {\boldsymbol{{d}}}_{{L}_{l}}^{{C}_{i}}$
is a vanishing point corresponding to the direction vector
 $ {\boldsymbol{{d}}}_{{L}_{l}}^{M}$
.
Therefore, the theoretical re-projected line
 $ {\boldsymbol{{l}}}_{l}^{{C}_{i}}$
of the spatial structural line
 $ {L}_{l}$
on the homogeneous coordinate plane is given by
 \begin{align} {\boldsymbol{{l}}}_{l}^{{C}_{i}}={\boldsymbol{\mathcal{P}}}_{{L}_{l}}^{{C}_{i}}\times {\boldsymbol{{{d}}}}_{{L}_{l}}^{{C}_{i}}.\end{align}
With the above definitions, the re-projected line is expressed as
 \begin{align} {\boldsymbol{{l}}}_{l}^{{C}_{i}}=f\big({\boldsymbol{{P}}}_{{L}_{l}}^{M},{{\boldsymbol{{d}}}_{{L}_{l}}^{M},\boldsymbol{{R}}}_{WM},{\boldsymbol{{R}}}_{W{C}_{i}}{,\boldsymbol{{t}}}_{W{C}_{i}}\big)\end{align}
In a VIO system, the camera pose is usually represented by the IMU pose. Therefore, the above expression is further rewritten as
 \begin{align} {\boldsymbol{{l}}}_{l}^{{C}_{i}}=f\big({\boldsymbol{{P}}}_{{L}_{l}}^{M},{{\boldsymbol{{d}}}_{{L}_{l}}^{M},\boldsymbol{{R}}}_{WM},{\boldsymbol{{R}}}_{W{I}_{i}}{,\boldsymbol{{t}}}_{W{I}_{i}},{\boldsymbol{{R}}}_{IC},{\boldsymbol{{t}}}_{IC}\big)\end{align}
where
 $ {\boldsymbol{{R}}}_{W{I}_{i}}$
and
 $ {\boldsymbol{{t}}}_{W{I}_{i}}$
denote the IMU pose in the global word frame
 $ \left\{\boldsymbol{{W}}\right\}$
.
 $ {\boldsymbol{{R}}}_{IC}$
and
 $ {\boldsymbol{{t}}}_{IC}$
are extrinsic parameters between the IMU and the camera, which can be obtained by calibration. If only considering the variables to be refined in the VIO system, the simplified version of the above expression is as follows:
 \begin{align} {\boldsymbol{{l}}}_{l}^{{C}_{i}}=f\left({\boldsymbol{{P}}}_{{L}_{l}}^{M},{\boldsymbol{{R}}}_{WM},{\boldsymbol{{R}}}_{W{I}_{i}}{,\boldsymbol{{t}}}_{W{I}_{i}}\right)\end{align}
As a result, the relationship between the spatial structural line
 $ {L}_{l}$
and the corresponding 2D re-projected line
 $ {\boldsymbol{{l}}}_{l}^{{C}_{i}}$
is established.
5. Measurement processing
The measurement processing involves both inertia and visual measurements. The visual measurements involve point and structural line features. Here we only present the details of the processing of structural line features. The processing of IMU and point features can be found in VINS [Reference Qin, Li and Shen8].
5.1. Detection and tracking of line features
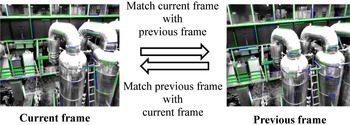
The LSD line detector [Reference Huang, Fan and Song28] is employed to detect line features from images. For stereo matching and frame-to-frame tracking, the binary descriptor of the LBD method [Reference Zhang and Koch18] is used to find correspondences among line features in different images. To improve the match of line features, as shown in Fig. 4, a bidirectional matching strategy is presented.
Illustration of the bidirectional matching strategy. The current frame is first matched with the previous frame. And then, the previous frame is matched with the current frame. The green lines are successful matches, and the blue lines are failed matches.

First, we match line features in the current frame with line features in the previous frame by the LBD descriptor with a relatively loose threshold to get as many candidate matches as possible. Second, some outliers are removed according to geometric constraints between the two matched line features, such as the difference of orientation and length, and the distance between their respective endpoints. Lastly, we match line features in the previous frame to line features in the current frame with the same method used in the first matching. For a line feature, only when the correspondences obtained in the bidirectional matching are the same, its match is regarded as correct. The bidirectional matching strategy is also used when matching left and right stereo images. The bidirectional matching strategy can improve the accuracy of matching considerably without reducing the number of candidate matches.
5.2. Detection of the Manhattan world and identification of structural line features
Detection of the Manhattan world is conducted independently in the first ten left images during the initialization. Due to errors in the extraction of vanishing points, more than one Manhattan world could be detected. The most frequently detected Manhattan world is identified as the global Manhattan world. It involves clustering 2D line features into three groups to identify structural lines in three orthogonal directions based on the vanishing points. Our system clusters line features by the RANSAC algorithm to identify structural line features and obtain a rough estimation of the corresponding vanishing points. After that, the vanishing points are refined by nonlinear least-squares optimization. The details about the identification of structural lines by the RANSAC clustering algorithm and the optimization of vanishing points can be found in ref. [Reference Nieto and Salgado29].
The normalized coordinates of a vanishing point are also the direction vectors of the corresponding spatial structural lines in the camera frame [Reference Andrew30]. If the normalized coordinates of the three detected vanishing points are approximately orthogonal, the Manhattan world is detected in the current image. Due to errors in observation and calculation, the three vanishing points need to be orthogonalized by the Schmidt method.
 \begin{align} {\boldsymbol{{V}}}_{X}&={\boldsymbol{{V}}}_{X}^{\prime}\nonumber\\[3pt] {\boldsymbol{{V}}}_{Y}&={\boldsymbol{{V}}}_{Y}^{\prime}-\frac{{\boldsymbol{{V}}}_{X}^{T}{\boldsymbol{{V}}}_{Y}^{\prime}}{{\boldsymbol{{V}}}_{X}^{T}{\boldsymbol{{V}}}_{X}}{\boldsymbol{{V}}}_{X} \nonumber \\[3pt] {\boldsymbol{{V}}}_{z}&={\boldsymbol{{V}}}_{Z}^{\prime}-\frac{{\boldsymbol{{V}}}_{X}^{T}{\boldsymbol{{V}}}_{Z}^{\prime}}{{\boldsymbol{{V}}}_{X}^{T}{\boldsymbol{{V}}}_{X}}{\boldsymbol{{V}}}_{X}-\frac{{\boldsymbol{{V}}}_{Y}^{T}{\boldsymbol{{V}}}_{Z}^{\prime}}{{\boldsymbol{{V}}}_{Y}^{T}{\boldsymbol{{V}}}_{Y}}{\boldsymbol{{V}}}_{Y}\end{align}
where
 $ {\boldsymbol{{V}}}_{i}^{\prime}$
(i = X,Y,Z) are the normalized coordinates of the three detected vanishing points,
 $ {\boldsymbol{{V}}}_{i}(I=X,Y,Z)$
are the results of the orthogonalization.
After that, the orientation
 $ {\boldsymbol{{R}}}_{{C}_{i}M}$
of the detected Manhattan world frame
 $ \left\{\boldsymbol{{M}}\right\}$
relative to the current camera frame
 $ \left\{{\boldsymbol{{C}}}_{i}\right\}$
is denoted by
 \begin{align} {\boldsymbol{{R}}}_{{C}_{i}M}=\left[{\boldsymbol{{V}}}_{X},{\boldsymbol{{V}}}_{Y},{\boldsymbol{{V}}}_{z}\right]\end{align}
where the column vectors of
 $ {\boldsymbol{{R}}}_{{C}_{i}M}$
are three unit vectors obtained from the homogeneous coordinates of the three orthogonal vanishing points. Among them, the vertical direction is set as
 $ {\boldsymbol{{V}}}_{z}$
, and the direction close to the camera heading is set to
 $ {\boldsymbol{{V}}}_{X}$
. Then, the rotation matrix
 $ {\boldsymbol{{R}}}_{WM}$
is given by
 \begin{align} {\boldsymbol{{R}}}_{WM}={\boldsymbol{{R}}}_{W{C}_{i}}{\boldsymbol{{R}}}_{{C}_{i}M},\end{align}
where the rotation matrix
 $ {\boldsymbol{{R}}}_{W{C}_{i}}$
can be initially estimated by the EPnP [Reference Lepetit, Moreno-Noguer and Fua31] method.
The rotation matrix
 $ {\boldsymbol{{R}}}_{WM}$
is obtained by the above procedures on each left image during system initialization. When the difference between the obtained rotation matrices is less than a preset threshold, it is regarded that the Manhattan worlds detected in each image are the same. In such a case, the Manhattan world is successfully detected, and its orientation is also roughly obtained. After initialization, the Manhattan world orientation
 $ {\boldsymbol{{R}}}_{WM}$
is further refined in sliding window optimization.
A straightforward method, rather than clustering, is used to identify structural line features in the subsequent images. Once the rotation matrices
 $ {\boldsymbol{{R}}}_{WM}$
of the Manhattan world and
 $ {\boldsymbol{{R}}}_{W{C}_{i}}$
of the current camera frame have been estimated, the orientation of the Manhattan world
 $ \left\{\boldsymbol{{M}}\right\}$
relative to the current camera frame
 $ \left\{{\boldsymbol{{C}}}_{i}\right\}$
is given by
 \begin{align} {\boldsymbol{{R}}}_{{C}_{i}M}={\boldsymbol{{R}}}_{W{C}_{i}}^{-1}{\boldsymbol{{R}}}_{WM}\end{align}
Then, with the rotation matrix
 $ {\boldsymbol{{R}}}_{W{C}_{i}}$
, we can get three vanishing points corresponding to three coordinate axis directions of the Manhattan world frame in the current image. Note that, when detecting a Manhattan world during initialization, three vanishing points are used to obtain the rotation matrix
 $ {\boldsymbol{{R}}}_{{C}_{i}M}$
, whereas here, the rotation matrix
 $ {\boldsymbol{{R}}}_{{C}_{i}M}$
is used to obtain three vanishing points.
For a newly detected line feature in the current image, an auxiliary line connecting the line feature’s midpoint and one of the vanishing points is drawn. By checking the angle between the auxiliary line and the line feature, it can be determined that whether the line feature is a structural line that belongs to the vanishing point. In this way, the structural lines can be identified from all newly detected line features.
5.3. Identification of points belonging to lines
The points belonging to lines are identified by two steps:
-
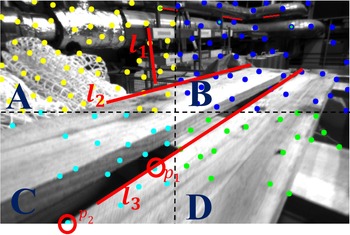
(1) A point feature is classified into one of four areas according to its pixel coordinates. A line feature is classified into areas according to the coordinates of points on it, as illustrated in Fig. 5.
Figure 5.Illustration of the line features’ search areas. The search area of
 ${l_1}$
,
${l_2}$
, and
${l_3}$
are area A, area A+B and area B+C+D, respectively.
${p_1}$
and
${p_2}$
are point features that may belong to
${l_3}$
.
-
(2) The PPBL between candidate point features and line features in the same area is checked and identified if both the following two conditions are satisfied:


Condition A: The vertical distance between the line feature and the point feature is less than a preset threshold.
Condition B: The point feature is inside the line feature, such as
 $ {p}_{1}$
inside
 $ {l}_{3}$
in Fig. 5; or the point feature is outside the line feature, such as
 $ {p}_{2}$
outside
 $ {l}_{3}$
in Fig. 5, but the distance from the point feature to the nearest endpoint of the line feature is less than a preset threshold.
When a point feature and a line feature satisfy the above two conditions, it is deemed that the point belongs to the line. However, due to the influence of visual angle, the PPBL in one image does not mean an authentic one. Only when the PPBL is detected in both left and right images and continues for at least four consecutive frames, the PPBL is verified.
5.4. Triangulation of structural lines
The direction of a structural line
 $ {L}_{l}$
in the Manhattan world frame
 $ \left\{\boldsymbol{{M}}\right\}$
can be directly obtained. Therefore, triangulation is carried out to acquire the initial value of the intersection point
 $ {\boldsymbol{{P}}}_{{L}_{l}}^{M}$
. There are two ways to triangulate the structural lines, one is to triangulate by the points belonging to lines and the other is to triangulate by the midpoints. And for a structural line, if there exist triangulated point features belonging to it, its triangulation can be simplified.
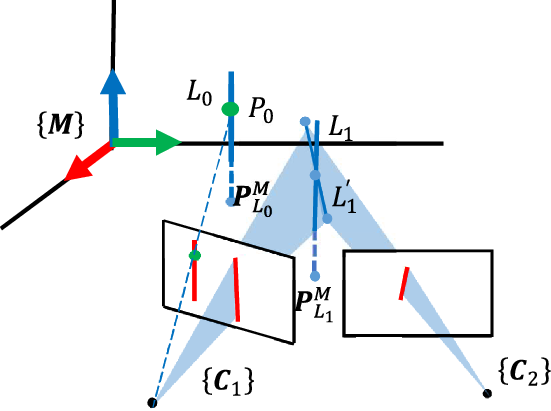
As shown in Fig. 6,
 $ {P}_{0}$
belongs to line
 $ {L}_{0}$
and has been triangulated. To triangulate the structural line
 $ {L}_{0}$
,
 $ {P}_{0}$
is transformed from the global world frame
 $ \left\{\boldsymbol{{W}}\right\}$
to the Manhattan world frame
 $ \left\{\boldsymbol{{M}}\right\}$
.
 \begin{align} {\boldsymbol{{P}}}_{{P}_{0}}^{M}={\boldsymbol{{R}}}_{WM}^{-1}{\boldsymbol{{P}}}_{{P}_{0}}^{W}\end{align}
 $ {\boldsymbol{{P}}}_{{P}_{0}}^{W}$
in (10) are the coordinates of
 $ {P}_{0}$
in the global world frame
 $ \left\{\boldsymbol{{W}}\right\}$
. And
 $ {\boldsymbol{{P}}}_{{P}_{0}}^{M}={\left({p}_{1},{p}_{2},{p}_{3}\right)}^{T}$
are the coordinates of
 $ {P}_{0}$
in the Manhattan word frame
 $ \left\{\boldsymbol{{M}}\right\}$
. Assuming that
 $ {L}_{0}$
is identified as a structural line parallel to the Z-axis of the Manhattan world frame
 $ \left\{\boldsymbol{{M}}\right\}$
, so its corresponding intersection point is
 $ {\boldsymbol{{P}}}_{{L}_{0}}^{M}={\left({p}_{1},{p}_{2},0\right)}^{T}$
. Similarly, for structural lines in other directions, the initial value of their intersection points
 $ {\boldsymbol{{P}}}_{{L}_{l}}^{M}$
can also be easily obtained according to triangulated points belonging to them.
Triangulation of structural lines.
 ${P_0}$
has been identified as belonging to structural line feature
 ${L_0}$
. The red lines are observations of structural lines in the image, and the blue dotted lines are the results of the triangulation.

For other structural lines, like
 $ {L}_{1}$
in Fig. 6, if there are no triangulated points belonging to them, an initial estimation for the endpoints is obtained by a conventional method [Reference He, Zhao, Guo, He and Yuan14]. Due to the calculation and observation errors, the direction of the 3D line
 $ {L}_{1}^{\prime}$
composed of these two endpoints is not precisely parallel to the direction obtained in the identification procedures. So, in the Manhattan world frame
 $ \left\{\boldsymbol{{M}}\right\}$
, the midpoint of these two endpoints is projected onto the plane perpendicular to the structural line. And then, the projection point is taken as the intersection point
 $ {\boldsymbol{{P}}}_{{L}_{1}}^{M}=({a}_{0}\text{, }{b}_{0}\text{,0}{)}^{T}$
(
 $ {a}_{0}=\frac{{P}_{sX}^{M}+{P}_{eX}^{M}}{2},{b}_{0}=\frac{{P}_{sY}^{M}+{P}_{eY}^{M}}{2}$
) of the structural line
 $ {L}_{1}$
.
6. Sliding window optimization
After the initial values of camera pose and landmarks position are estimated by the measurement processing, the state variables are optimized in a tightly coupled sliding window. The landmarks consist of spatial point features and structural line features.
6.1. Sliding window formulation
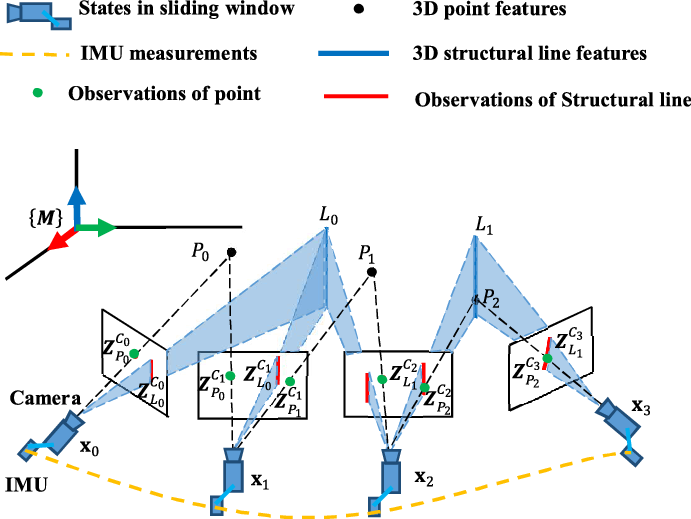
Figure 7 illustrates the sliding window formulation. The state vector in the sliding window is defined as
 \begin{align} {\boldsymbol\chi }&=\left[{\textbf{x}}_{0},{\textbf{x}}_{1},\cdots {\textbf{x}}_{n},{\boldsymbol{{R}}}_{WM},{\lambda }_{0},{\lambda }_{1},\cdots {\lambda }_{m},{\boldsymbol{{L}}}_{0},{\boldsymbol{{L}}}_{1},\cdots {\boldsymbol{{L}}}_{k}\right]\nonumber\\[3pt] {\textbf{x}}_{i}&=\left[{\boldsymbol{{R}}}_{{WI}_{i}},{\boldsymbol{{t}}}_{{WI}_{i}}{,\boldsymbol{{v}}}_{{WI}_{i}}{,\boldsymbol{{b}}}_{a},{\boldsymbol{{b}}}_{g}\right],i\in \left[0,n\right]\nonumber\\[3pt] {\boldsymbol{{L}}}_{l}&={\left[{\theta }_{l},{\rho }_{l}\right]}^{T}={\left[{\textit{tan}}^{-1}\left({b}_{l}/{a}_{l}\right),1/\sqrt{{a}_{l}^{2}+{b}_{l}^{2}}\right]}^{T},l\in \left[0,k\right]\end{align}
where
 $ {\textbf{x}}_{i}$
represents the IMU states, including rotation
 $ {\boldsymbol{{R}}}_{{WI}_{i}}$
, position
 $ {\boldsymbol{{t}}}_{{WI}_{i}}$
, velocity
 $ {\boldsymbol{{v}}}_{{WI}_{i}}$
in the global world frame, biases of acceleration
 $ {\boldsymbol{{b}}}_{a}$
, angular velocity
 $ {\boldsymbol{{b}}}_{g}$
in the IMU body frame at the
 $ {i}^{th}$
time step when an image is captured, and n is the number of keyframes in the sliding window. Since the use of polar coordinate and inverse depth
 $ {\left[{\theta }_{l},{\rho }_{l}\right]}^{T}$
has better optimization performance [Reference Zou, Wu, Pei, Ling and Yu27], we convert Cartesian coordinate parameters
 $ {\left[{a}_{l},{b}_{l}\right]}^{T}$
into
 $ {\left[{\theta }_{l},{\rho }_{l}\right]}^{T}$
. This work is under a keyframe-based paradigm, and the selection strategy of keyframe is the same as VINS [Reference Nützi, Weiss, Scaramuzza and Siegwart7]. m and k are the numbers of spatial point features and structural line features observed by keyframes in the sliding window, respectively.
 $ {\boldsymbol{{R}}}_{WM}$
represents the orientation of the Manhattan world frame
 $ \left\{\boldsymbol{{M}}\right\}$
in the global world frame
 $ \left\{\boldsymbol{{W}}\right\}$
.
 $ {\lambda }_{p}$
is the inverse depth of the
 $ {p}^{th}$
spatial point feature from its first observed keyframe.
 $ {\boldsymbol{{L}}}_{l}$
represents two nonzero parameters of the intersection point
 $ {\boldsymbol{{P}}}_{{L}_{l}}^{M}$
of the
 $ l\textrm{t}\textrm{h}$
spatial structural line in the Manhattan world frame
 $ \left\{\boldsymbol{{M}}\right\}$
. Considering numerical stability [Reference Civera, Davison and Montiel32], the inverse depth representation
 $ ({\theta }_{l},{\rho }_{l})$
, instead of
 $ ({a}_{l},{b}_{l})$
, is used as a parameter of structural lines.
Illustrating the sliding window formulation. Among the points and lines,
 ${P_2}$
belongs to the structural line
 ${L_1}$
. The state variables to be optimized are the IMU states, the spatial position of points and structural lines, and the orientation of the Manhattan world frame.

All the state variables mentioned above are optimized in the sliding window by minimizing the sum of cost functions:
 \begin{align} &\underset{{\chi }}{\textrm{m}\textrm{i}\textrm{n}}\left\{{\|{\boldsymbol{{{r}}}}_{P}-{\boldsymbol{{H}}}_{p}{\boldsymbol\chi }\|}_{{\boldsymbol{\Sigma }}_{P}}^{2}+\sum \nolimits_{i\in \mathcal{B}}{\|{\boldsymbol{{{r}}}}_{\mathcal{B}}\left({\boldsymbol{{Z}}}_{{b}_{i}{b}_{i+1}},{\boldsymbol\chi }\right)\|}_{{\boldsymbol{\Sigma }}_{{b}_{i+1}}^{{b}_{i}}}^{2}+\sum\nolimits_{\left(i,j\right)\in \mathcal{P}}{\boldsymbol\rho }\left({\|{\boldsymbol{{{r}}}}_{\mathcal{P}}\left({\boldsymbol{{Z}}}_{{P}_{j}}^{{C}_{i}},{\boldsymbol\chi }\right)\|}_{{\boldsymbol{\Sigma }}_{{P}_{j}}^{{C}_{i}}}^{2}\right)\right.\nonumber\\[3pt]&\quad +\left.\sum \nolimits_{\left(i,l\right)\in \mathcal{L}}{\boldsymbol\rho }\left({\|{\boldsymbol{{{r}}}}_{\mathcal{L}}\left({\boldsymbol{{Z}}}_{{L}_{l}}^{{C}_{i}},{\boldsymbol\chi }\right)\|}_{{\boldsymbol{\Sigma }}_{{L}_{l}}^{{C}_{i}}}^{2}\right)+\sum \nolimits_{\left(j,l\right)\in \mathcal{C}}{\boldsymbol\rho }\left({\|{\boldsymbol{{{r}}}}_{\mathcal{C}}\left({\boldsymbol{{Z}}}_{{P}_{j}}^{{C}_{i}},{\boldsymbol\chi }\right)\|}_{{\boldsymbol{\Sigma }}_{{L}_{l}}^{{P}_{j}}}^{2}\right)\right\}\end{align}
where
 $ \left\{{\boldsymbol{{{r}}}}_{P},{\boldsymbol{{H}}}_{p}\right\}$
are the prior information and information matrix obtained after marginalizing out a camera frame. IMU measurements and features are selectively marginalized from the sliding window. Meanwhile, the measurements corresponding to marginalized states are converted into a prior.
 $ {\boldsymbol{{{r}}}}_{\mathcal{B}}\left({\boldsymbol{{Z}}}_{{b}_{i}{b}_{i+1}},{\boldsymbol\chi }\right)$
is the residual for IMU measurement, and
 $ \mathcal{B}$
is the set of all IMU measurements in the sliding window.
 $ {\boldsymbol{{{r}}}}_{\mathcal{P}}({\boldsymbol{{Z}}}_{{P}_{j}}^{{C}_{i}},{\boldsymbol\chi })$
and
 $ {\boldsymbol{{{r}}}}_{\mathcal{L}}\left({\boldsymbol{{Z}}}_{{L}_{l}}^{{C}_{i}},{\boldsymbol\chi }\right)$
are respective residuals for visual measurements of point features and structural line features.
 $ \mathcal{P}$
and
 $ \mathcal{L}$
are respective sets of point features and structural line features observed by keyframes.
 $ {\boldsymbol{{{r}}}}_{\mathcal{C}}\left({\boldsymbol{{Z}}}_{{P}_{j}}^{{C}_{i}},{\boldsymbol\chi }\right)$
is the residual for the spatial distance between the point and the line it belongs to.
 $ \mathcal{C}$
is the set of points and lines.
 $ {\boldsymbol\rho }$
is the robust kernel function used to suppress outliers. The Ceres solver [Reference Sameer and Keir33] is used to solve this nonlinear optimization problem.
The residual terms related to IMU measurements and visual measurements of point features are established with methods similar to VINS [Reference Qin, Li and Shen8]. Therefore, in the following sections, we only present the details of residuals related to structural line features.
6.2. Structural line measurement residual
For the lth structural line, according to the inverse depth representation
 $ {\boldsymbol{{L}}}_{l}={[{\theta }_{l},{\rho }_{l}]}^{T}$
, the nonzero parameters
 $ {[{a}_{l},{b}_{l}]}^{T}$
of the intersection point
 $ {\boldsymbol{{P}}}_{{L}_{l}}^{M}$
is obtained by
 \begin{align} \left[\begin{array}{c}{a}_{l}\\ \\[-7pt] {b}_{l}\end{array}\right]=\left[\begin{array}{c}\textrm{cos}{\theta }_{l}/{\rho }_{l}\\ \\[-7pt] \textrm{sin}{\theta }_{l}/{\rho }_{l}\end{array}\right]\end{align}
With the parameters
 $ {[{a}_{l},{b}_{l}]}^{T}$
and the direction vector
 $ {\boldsymbol{{d}}}_{{L}_{l}}^{M}$
of the structural line in the Manhattan world
 $ \left\{\boldsymbol{{M}}\right\}$
, its intersection point
 $ {\boldsymbol{{P}}}_{{L}_{l}}^{M}$
can be directly obtained, as is described in Section 3. Then, the corresponding re-projected 2D line
 $ {\boldsymbol{{l}}}_{l}^{{C}_{i}}={\left({l}_{1},{l}_{2},{l}_{3}\right)}^{T}$
on the homogeneous coordinate plane of the ith camera frame
 $ \left\{{\boldsymbol{{C}}}_{i}\right\}$
is obtained by (6). The structural line measurement residual is defined as the re-projected error, that is, the distance between the endpoints of
 $ {\boldsymbol{{Z}}}_{{L}_{l}}^{{C}_{i}}$
and the re-projected 2D line
 $ {\boldsymbol{{l}}}_{l}^{{C}_{i}}$
. The residual
 $ {\boldsymbol{{{r}}}}_{\mathcal{L}}\left({\boldsymbol{{Z}}}_{{L}_{l}}^{{C}_{i}},{\chi }\right)$
is given by
 \begin{align} {\boldsymbol{{{r}}}}_{\mathcal{L}}\left({\boldsymbol{{Z}}}_{{L}_{l}}^{{C}_{i}},{\boldsymbol\chi }\right)=\left[\begin{array}{c}{\boldsymbol{{s}}}^{T}{\boldsymbol{{l}}}_{l}^{{C}_{i}}/\sqrt{{l}_{1}^{2}+{l}_{2}^{2}}\\ \\[-7pt] {\boldsymbol{{e}}}^{T}{\boldsymbol{{l}}}_{l}^{{C}_{i}}/\sqrt{{l}_{1}^{2}+{l}_{2}^{2}}\end{array}\right]\end{align}
where
 $ \boldsymbol{{s}}={\left({s}_{1},{s}_{2},1\right)}^{T}$
,
 $ \boldsymbol{{e}}={\left({e}_{1},{e}_{2},1\right)}^{T}$
are the coordinates of two endpoints on the homogeneous coordinate plane of
 $ \left\{{\boldsymbol{{C}}}_{i}\right\}$
.
For this residual term, the state variables to be optimized include the IMU state
 $ {\textbf{x}}_{i}$
, the rotation matrix
 $ {\boldsymbol{{R}}}_{WM}$
, and
 $ {\boldsymbol{{L}}}_{l}$
. The corresponding Jacobian matrices can be obtained by the chain rule:
 \begin{align} {\textit{J}}_{L}=\dfrac{\partial {\boldsymbol{{{r}}}}_{\mathcal{L}}}{\partial {\boldsymbol{{l}}}_{l}^{{C}_{i}}}\dfrac{\partial {\boldsymbol{{l}}}_{l}^{{C}_{i}}}{\partial\!\left({\boldsymbol{{P}}}_{{L}_{l}}^{{C}_{i}},{\boldsymbol{{d}}}_{{L}_{l}}^{{C}_{i}}\right)}\left[\begin{array}{@{}c@{\qquad}c@{\qquad}c@{}}\dfrac{\partial\!\left({\boldsymbol{{P}}}_{{L}_{l}}^{{C}_{i}},{\boldsymbol{{d}}}_{{L}_{l}}^{{C}_{i}}\right)}{\partial {\textbf{x}}_{i}} \dfrac{\partial\!\left({\boldsymbol{{P}}}_{{L}_{l}}^{{C}_{i}},{\boldsymbol{{d}}}_{{L}_{l}}^{{C}_{i}}\right)}{\partial {\boldsymbol{{R}}}_{WM}} \dfrac{\partial\!\left({\boldsymbol{{P}}}_{{L}_{l}}^{{C}_{i}},{\boldsymbol{{d}}}_{{L}_{l}}^{{C}_{i}}\right)}{\partial {\boldsymbol{{L}}}_{l}}\end{array}\right].\end{align}
with
 \begin{align*} \dfrac{\partial {\boldsymbol{{{r}}}}_{\mathcal{L}}}{\partial {\boldsymbol{{l}}}_{l}^{{C}_{i}}}={\left[\begin{array}{c@{\quad}c@{\quad}c}\dfrac{{s}_{1}}{{\left({l}_{1}^{2}+{l}_{2}^{2}\right)}^{\frac{1}{2}}}+\dfrac{-{l}_{1}{\boldsymbol{{s}}}^{T}{\boldsymbol{{l}}}_{l}^{{C}_{i}}}{{\left({l}_{1}^{2}+{l}_{2}^{2}\right)}^{\frac{3}{2}}} \dfrac{{s}_{2}}{{\left({l}_{1}^{2}+{l}_{2}^{2}\right)}^{\frac{1}{2}}}+\dfrac{-{l}_{2}{\boldsymbol{{s}}}^{T}{\boldsymbol{{l}}}_{l}^{{C}_{i}}}{{\left({l}_{1}^{2}+{l}_{2}^{2}\right)}^{\frac{3}{2}}} \dfrac{1}{{\left({l}_{1}^{2}+{l}_{2}^{2}\right)}^{\frac{1}{2}}}\\ \\ \dfrac{{e}_{1}}{{\left({l}_{1}^{2}+{l}_{2}^{2}\right)}^{\frac{1}{2}}}+\dfrac{-{l}_{1}{\boldsymbol{{e}}}^{T}{\boldsymbol{{l}}}_{l}^{{C}_{i}}}{{\left({l}_{1}^{2}+{l}_{2}^{2}\right)}^{\frac{3}{2}}} \dfrac{{e}_{2}}{{\left({l}_{1}^{2}+{l}_{2}^{2}\right)}^{\frac{1}{2}}}+\dfrac{-{l}_{2}{\boldsymbol{{e}}}^{T}{\boldsymbol{{l}}}_{l}^{{C}_{i}}}{{\left({l}_{1}^{2}+{l}_{2}^{2}\right)}^{\frac{3}{2}}} \dfrac{1}{{\left({l}_{1}^{2}+{l}_{2}^{2}\right)}^{\frac{1}{2}}}\end{array}\right]}_{2\times 3}\end{align*}
 \begin{align} \dfrac{\partial {\boldsymbol{{l}}}_{l}^{{C}_{i}}}{\partial\!\left({\boldsymbol{{P}}}_{{L}_{l}}^{{C}_{i}},{\boldsymbol{{d}}}_{{L}_{l}}^{{C}_{i}}\right)}={\left[\begin{array}{c@{\quad}c@{\quad}c@{\quad}c@{\quad}c@{\quad}c}0& \dfrac{1}{{p}_{3}}& \dfrac{{-p}_{1}}{{p}_{3}^{2}}& 0& \dfrac{-1}{{d}_{3}} & \dfrac{{d}_{1}}{{d}_{3}^{2}} \\ \\[-7pt] \dfrac{-1}{{p}_{3}} &0& \dfrac{{p}_{1}}{{p}_{3}^{2}} & \dfrac{1}{{d}_{3}}& 0 &\dfrac{{-d}_{1}}{{d}_{3}^{2}} \\ \\[-7pt]\dfrac{{d}_{2}}{{p}_{3}} &\dfrac{{-d}_{1}}{{p}_{3}}& \dfrac{{-d}_{2}{p}_{1}{+d}_{1}{p}_{2}}{{p}_{3}^{2}}&\dfrac{{-p}_{2}}{{d}_{3}}& \dfrac{{p}_{1}}{{d}_{3}}& \dfrac{{p}_{2}{d}_{1}{+p}_{1}{d}_{2}}{{d}_{3}^{2}}\end{array}\right]}_{3\times 6},\end{align}
where
 $\boldsymbol{{P}}_{{L_l}}^{{C_i}} = {\left( {{p_1},{p_2},{p_3}} \right)^T}$
and
 $\boldsymbol{{d}}_{{L_l}}^{{C_i}} = {\left( {{d_1},{d_2},{d_3}} \right)^T}$
are intersection point and direction vector of the lth structural line in the ith camera frame
 $\left\{ {{\boldsymbol{{C}}_i}} \right\}$
, respectively, which are obtained by (1) and (2).
The Jacobian matrices of
 $\left( {\boldsymbol{{P}}_{{L_l}}^{{C_i}},\boldsymbol{{d}}_{{L_l}}^{{C_i}}} \right)$
with respect to
 ${\boldsymbol{{x}}_i}$
,
 ${{\boldsymbol{{R}}}_{WM}}$
, and
 ${{\boldsymbol{{L}}}_l}$
are defined as follows:
 \begin{align*}\frac{{\partial\!\left( {\boldsymbol{{P}}_{{L_l}}^{{C_i}},\boldsymbol{{d}}_{{L_l}}^{{C_i}}} \right)}}{{\partial \delta {\boldsymbol{{x}}_i}}} &= {\left[ {\begin{array}{c@{\quad}c@{\quad}c@{\quad}c@{\quad}c}{\boldsymbol{{R}}_{IC}^{ - 1}{{\left[ {\boldsymbol{{R}}_{W{I_i}}^{ - 1}\left( {{\boldsymbol{{R}}_{WM}}\boldsymbol{{P}}_{{L_l}}^M - {\boldsymbol{{t}}_{W{I_i}}}} \right)} \right]}^ \wedge }}& { - \boldsymbol{{R}}_{IC}^{ - 1}\boldsymbol{{R}}_{W{I_i}}^{ - 1}}&\textbf{0}&\textbf{0}&\textbf{0}\\ \\[-5pt]{\boldsymbol{{R}}_{IC}^{ - 1}{{\left[ {\boldsymbol{{R}}_{W{I_i}}^{ - 1}\left( {{\boldsymbol{{R}}_{WM}}\boldsymbol{{d}}_{{L_l}}^M} \right)} \right]}^ \wedge }}& \textbf{0}& \textbf{0}&\textbf{0}&\textbf{0}\end{array}} \right]_{6 \times 15}} \nonumber \\ \frac{{\partial\!\left( {\boldsymbol{{P}}_{{L_l}}^{{C_i}},\boldsymbol{{d}}_{{L_l}}^{{C_i}}} \right)}}{{\partial {\boldsymbol{{R}}_{WM}}}} &= \left[ {\begin{array}{@{}c@{\quad}c@{}}{ - \boldsymbol{{R}}_{IC}^{ - 1}\boldsymbol{{R}}_{W{I_i}}^{ - 1}{\boldsymbol{{R}}_{WM}}{{\left[ {\boldsymbol{{P}}_{{L_l}}^M} \right]}^ \wedge }}\\ \\[-7pt]{ - \boldsymbol{{R}}_{IC}^{ - 1}\boldsymbol{{R}}_{W{I_i}}^{ - 1}{\boldsymbol{{R}}_{WM}}{{\left[ {\boldsymbol{{d}}_{{L_l}}^M} \right]}^ \wedge }}\end{array}} \right]_{6 \times 3}\end{align*}
 \begin{align}\frac{{\partial\!\left( {\boldsymbol{{P}}_{{L_l}}^{{C_i}},d_{{L_l}}^{{C_i}}} \right)}}{{\partial {L_l}}} = {\left[ {\begin{array}{*{20}{c}}{\boldsymbol{{R}}_{IC}^{ - 1}\boldsymbol{{R}}_{W{I_i}}^{ - 1}{\boldsymbol{{R}}_{WM}}}\\ \\[-7pt] \textbf{0}\end{array}} \right]_{6 \times 3}}{\left[ {\begin{array}{c@{\quad}c}{ - \sin {\theta _l}/{\rho _l}}&{ - \cos {\theta _l}/\rho _l^2}\\ \\[-7pt]{\cos {\theta _l}/{\rho _l}}&{ - \sin {\theta _l}/\rho _l^2}\\ 0&0\end{array}} \right]_{3 \times 2}},\end{align}
where
 ${\left[ \cdot \right]^ \wedge }$
represents the skew-symmetric matrix of a three-dimension vector.
The covariance matrix
 ${\boldsymbol{\Sigma }}_{{L_l}}^{{C_i}}$
used to normalize the structural line measurement residuals is defined as
 \begin{align}{\boldsymbol{\Sigma }}_{{L_l}}^{{C_i}} = {\left[ {\begin{array}{c@{\quad}c}{{{\sigma }}_{{L_l}}^2}&0\\ \\[-7pt] 0&{{{\sigma }}_{{L_l}}^2}\end{array}} \right]_{2 \times 2}}\end{align}
where
 ${\sigma _{{L_l}}}$
is set by assuming that the measurement noise of endpoints is 1 to 2 pixels.
6.3. Distance residual between points and lines
When the jth point feature has been identified as belonging to the lth structural line feature, the distance residual between them is given by
 \begin{align}{\boldsymbol{{r}}_{\mathcal{C}}}\left( {{\boldsymbol{{Z}}}_{{P_j}}^{{C_i}},\boldsymbol\chi } \right) = {{\Pi }}\left( {\boldsymbol{{P}}_{{L_l}}^M} \right) - {{\Pi }}\left( {\boldsymbol{{P}}_{{P_j}}^M} \right)\end{align}
 \begin{align}\boldsymbol{{P}}_{{P_j}}^M = \boldsymbol{{R}}_{WM}^{ - 1}\left( {{\boldsymbol{{R}}_{W{I_i}}}\left( {{\boldsymbol{{R}}_{IC}}\boldsymbol{{Z}}_{{P_j}}^{{C_i}}\frac{1}{{{\lambda _j}}} + {\boldsymbol{{t}}_{IC}}} \right) + {\boldsymbol{{t}}_{W{I_i}}}} \right)\end{align}
 \begin{align}{{\Pi }}\left( {\boldsymbol{{P}}_{{L_l}}^M} \right) = \left[ {\begin{array}{*{20}{c}}{{a_l}}\\{{b_l}}\end{array}} \right] = \left[ {\begin{array}{*{20}{c}}{\cos {\theta _l}/{\rho _l}}\\ \\[-7pt]{\sin {\theta _l}/{\rho _l}}\end{array}} \right]\end{align}
where
 $\boldsymbol{{Z}}_{{P_j}}^{{C_i}}$
is the image observation of the jth point feature in the ith camera frame.
 $\boldsymbol{{P}}_{{P_j}}^M$
is the spatial coordinate of the jth point feature in the Manhattan world frame
 $\left\{ \boldsymbol{{M}} \right\}$
.
 ${{\Pi }}\left( {\boldsymbol{{P}}_{{P_j}}^M} \right)$
represents projecting
 $\boldsymbol{{P}}_{{P_j}}^M$
onto the plane of
 $\left\{ \boldsymbol{{M}} \right\}$
perpendicular to the lth structural line and then resize the 3D coordinates to the 2D ones by removing zero-value components. Similarly,
 ${{\Pi }}\left( {\boldsymbol{{P}}_{{L_l}}^M} \right)$
represents resizing the 3D coordinates of
 $\boldsymbol{{P}}_{{L_l}}^M$
to 2D ones.
For this residual term, the state variables to be optimized are
 $\left[ {{\boldsymbol{{x}}_i}{{\;\;}}{\boldsymbol{{R}}_{WM}}{{\;\;}}{\boldsymbol{{L}}_l}{{\;\;}}{\lambda _j}} \right]$
. The related Jacobian matrices are defined as follows:
 \begin{align}{\boldsymbol{{J}}_C} = \frac{{\partial {r_{\mathcal{C}}}}}{{\partial\!\left( {P_{{L_l}}^M,P_{{P_j}}^M} \right)}}\left[ {\frac{{\partial\!\left( {P_{{L_l}}^M,P_{{P_j}}^M} \right)}}{{\partial {\boldsymbol{{x}}_i}}}{{\;\;\;}}\frac{{\partial\!\left( {P_{{L_l}}^M,P_{{P_j}}^M} \right)}}{{\partial {R_{WM}}}}{{\;\;\;}}\frac{{\partial\!\left( {P_{{L_l}}^M,P_{{P_j}}^M} \right)}}{{\partial {{\;}}{L_l}}}{{\;\;\;}}\frac{{\partial\!\left( {P_{{L_l}}^M,P_{{P_j}}^M} \right)}}{{\partial {{\;}}{\lambda _j}}}} \right]\end{align}
with
 \begin{align*}\frac{{\partial {r_{\mathcal{C}}}}}{{\partial\!\left( {P_{{L_l}}^M,P_{{P_j}}^M} \right)}} = {\left[ {\begin{array}{c@{\quad}c@{\quad}c@{\quad}c@{\quad}c@{\quad}c}1&0&0 & { - 1}&0&0 \\ \\[-7pt] 0&1&0 &0&{ - 1}&0\end{array}} \right]_{2 \times 6}}\end{align*}
 \begin{align*}\frac{{\partial\!\left( {P_{{L_l}}^M,P_{{P_j}}^M} \right)}}{{\partial {\boldsymbol{{x}}_i}}}{{\;}} = {\left[ {\begin{array}{*{20}{c}}{\begin{array}{*{20}{c}}\textbf{0}\\ \\[-7pt]{ - \boldsymbol{{R}}_{WM}^{ - 1}{\boldsymbol{{R}}_{W{I_i}}}{{\left[ {{\boldsymbol{{R}}_{IC}}(\boldsymbol{{Z}}_{{P_j}}^{{C_i}}/{{\;}}{\boldsymbol\lambda _j}) + {\boldsymbol{{t}}_{IC}}} \right]}^ \wedge }}\end{array}}{\begin{array}{*{20}{c}}\textbf{0}\\ \\[-7pt] {\boldsymbol{{R}}_{WM}^{ - 1}}\end{array}}{\begin{array}{*{20}{c}}{\begin{array}{c@{\quad}c@{\quad}c}\textbf{0}&\textbf{0}&\textbf{0}\end{array}}\\ \\[-7pt] {\begin{array}{c@{\quad}c@{\quad}c}\textbf{0}&\textbf{0}&\textbf{0}\end{array}}\end{array}}\end{array}} \right]_{6 \times 15}}\end{align*}
 \begin{align*}\frac{{\partial\!\left( {P_{{L_l}}^M,\;P_{{P_j}}^M} \right)}}{{\partial {R_{WM}}}} = {\left[ {\begin{array}{*{20}{c}}\textbf{0}\\ \\[-7pt] {{{\left[ {{\boldsymbol{{R}}}_{WM}^{ - 1}{{\boldsymbol{{R}}}_{W{I_i}}}\left( {{{\boldsymbol{{R}}}_{IC}}({\boldsymbol{{Z}}}_{{P_j}}^{{C_i}}/{{\;}}{\lambda _j}} \right) + {{\boldsymbol{{t}}}_{IC}}) + {{\boldsymbol{{t}}}_{W{I_i}}}} \right]}^ \wedge }}\end{array}} \right]_{6 \times 3}}\end{align*}
 \begin{align*}\frac{{\partial\!\left( {P_{{L_l}}^M,P_{{P_j}}^M} \right)}}{{\partial {{\;}}{L_l}}} = {\left[ {\begin{array}{*{20}{c}}\textbf{0}\\ \\[-7pt] {\begin{array}{*{20}{c}}{ - \sin {\theta _l}/{\rho _l}} &\quad{ - \cos {\theta _l}/\rho _l^2}\\ \\[-7pt] {\cos {\theta _l}/{\rho _l}}& \quad { - \sin {\theta _l}/\rho _l^2}\\ \\[-7pt]0 &\quad0\end{array}}\end{array}} \right]_{6 \times 2}}\end{align*}
 \begin{align}\frac{{\partial\!\left( {P_{{L_l}}^M,P_{{P_j}}^M} \right)}}{{\partial {{\;}}{\lambda _j}}} = {\left[ {\begin{array}{*{20}{c}}\textbf{0}\\ \\[-7pt] { - \boldsymbol{{R}}_{WM}^{ - 1}{\boldsymbol{{R}}_{W{I_i}}}{\boldsymbol{{R}}_{IC}}\boldsymbol{{Z}}_{{P_j}}^{{C_i}}/\lambda _j^2}\end{array}} \right]_{6 \times 1}}.\end{align}
Similar to the covariance matrix of structural lines measurement, the covariance matrix
 ${\boldsymbol{\Sigma }}_{{L_l}}^{{P_j}}$
used to normalize the distance residual is defined as a
 $2 \times 2$
diagonal matrix by assuming that the spatial distance error is about 0.1–0.2 m.
7. Experimental results
To evaluate the performance of SLC-VIO, we first tested it on Euroc [Reference Burri, Nikolic, Gohl, Schneider, Rehder, Omari, Achtelik and Siegwart34] data sets and TUM VI [Reference Schubert, Goll, Demmel, Usenko, Stuckler and Cremers35] data sets, and then conducted a real-world experiment using our devices. Two state-of-the-art VIO methods, VINS [Reference Qin, Li and Shen8] and PL-VIO [Reference He, Zhao, Guo, He and Yuan14], were also implemented with their open-source code for comparison purposes. VINS [Reference Nützi, Weiss, Scaramuzza and Siegwart7] is a typical VIO system that only uses point features as visual measurement. The stereo version VINS-Fusion and monocular version VINS-Mono were adopted for comparative experiments, and the loop closing was disabled to evaluate the odometry performance only. PL-VIO uses both point features and line features as visual measurements. It uses Plücker coordinates to describe spatial lines and does not consider structural regularity and correlation between points and lines. All experiments were conducted on a computer with an AMD Ryzen Core 3600 CPU (@ 3.6GHz) and 16GB RAM.
7.1. Tests on Euroc data sets
The Euroc data sets consist of stereo images (frame rate: 20 FPS) and synchronized IMU measurements (sample rate: 200 Hz) [Reference Burri, Nikolic, Gohl, Schneider, Rehder, Omari, Achtelik and Siegwart34]. They were collected by the visual-inertial sensor mounted on a micro-aerial vehicle (MAV) flying in a machine hall. As shown in Figs. 8 and 10, the machine hall is a typical structured environment with plenty of structural lines. More importantly, some scenes with weak illumination are also included in the data sets, which may challenge the positioning accuracy of VIO systems. Besides, the Euroc data sets also provide the ground truth trajectories. At the beginning of each sequence, the UAV is on a wooden frame. Due to the lack of structural lines in three orthogonal directions, it is difficult for SLC-VIO to detect a Manhattan world during initialization. Therefore, the beginning of each sequence is skipped until the machine hall can be observed.
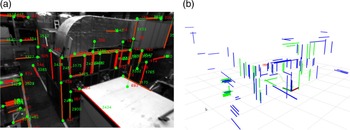
(a) Identified points and lines they belong to in one image. (b) The corresponding spatial structural lines to be optimized in the sliding window. The blue lines are new landmarks added to the map, and the green lines are existing ones.

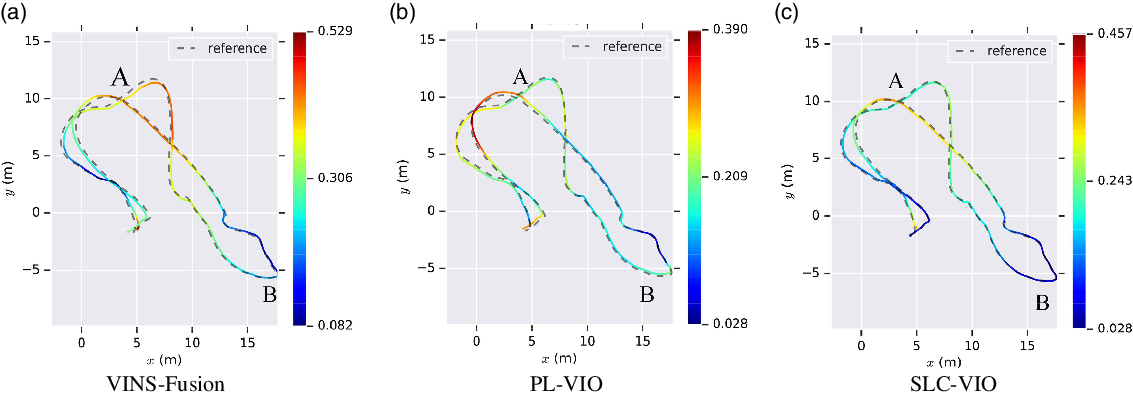
Estimated trajectories by VINS-Fusion, PL-VIO, and our SLC-VIO.

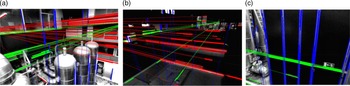
Illustration of scenes in Euroc data sets, where most line features are aligned with orthogonal directions. The blue lines are identified as vertical lines. The red and green lines are identified as horizontal lines.

To separately demonstrate the effects of structural lines and PPBL, we first tested SL-VIO (no PPBL) that only utilizes structural lines. Then, SLC-VIO that utilizes structural lines and PPBL was tested. The default parameters provided by authors in VINS-Fusion [Reference Nützi, Weiss, Scaramuzza and Siegwart7] and PL-VIO were used. The absolute pose error (APE), that is, the position difference between the ground truth and the estimated ones, was used to evaluate the positioning accuracy.
Table I presents the root-mean-square error (RMSE) of APE on five sequences. It shows that the proposed SLC-VIO achieves the best performance on almost all sequences, except for MH_01_easy. The results that SL-VIO (no PPBL) is better than VINS-Fusion, VINS-Mono, and PL-VIO on most sequences illustrate the advantage of using structural lines. Besides, by comparing SLC-VIO with SL-VIO(no PPBL), it can be found that the positioning accuracy of VIO system is further improved by using PPBL. It is also found that, compared to VINS-Mono, VINS-Fusion does not show a distinct advantage in accuracy since VINS-Fusion aims to improve the robustness and applicability. On the last two sequences, VINS-Fusion achieves better performance than the monocular version. The reason could be that VINS-Mono skipped some frames to ensure real-time performance and failed to match or track sufficient point features in cases of poor illumination.
RMSE on Euroc data sets (unit: meters).

Figure 8(a) demonstrates the points belonging to line features on MH_02_easy. Figure 8(b) shows the corresponding 3D structural lines in the reconstructed map. In Fig. 8(b), most of the structural lines marked in blue are constrained by distance residuals. It can be found that there are sufficient points and lines they belong to in the environment.
To visually compare the accuracy of VINS-Fusion, PL-VIO, and SLC-VIO, the estimated trajectories of the three methods on MH_04_difficult sequence are presented in Fig. 9. The amplitude of errors is denoted by colors. It can be seen that the trajectory estimated by SLC-VIO is the closest to the ground truth, especially in area A characterized by weak illumination (see in Fig. 10(b)) and area B characterized by sparse structural lines (see in Fig. 10(c)). The results demonstrate that the utilization of structural lines and PPBL can further improve the positioning accuracy of the VIO system in a weak-illumination environment.
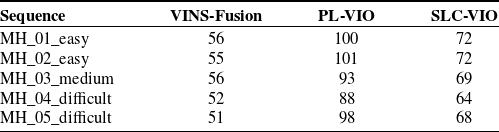
The average time consumption was evaluated on Euroc data sets, and the results are shown in Table II. It can be concluded that the computation efficiency of VIN-Fusion is the highest since it only takes point features as landmarks. Whereas in PL-VIO and SLC-VIO, both point features and line features are used as landmarks, the efficiency is relatively low. Moreover, with the 2-DoF spatial structural lines, the number of variables to be optimized in SLC-VIO is less than that in PL-VIO. Therefore, the efficiency of SLC-VIO is higher than PL-VIO.
Average time consumption on each frame (unit: millisecond).

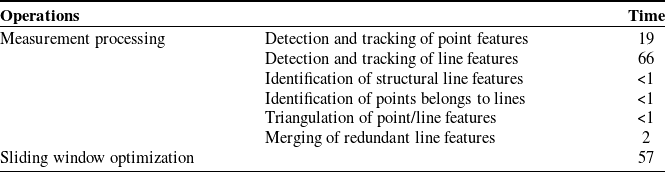
The average execution time of each key operation in SLC-VIO (unit: millisecond).

Table III presents the average execution time of each key operation in SLC-VIO. The detection and tracking of line features and sliding window optimization are the most time-consuming processes. The processing time of sliding window optimization depends on the number of features in an image and fluctuates in the range of 42–62 ms. The time consumption is ensured by limiting the maximum number of features (the maximum number of points and lines is 150 and 35, respectively) extracted from an image. Since the measurement processing and sliding window optimization run in parallel, the efficiency of SLC-VIO is mainly determined by these two processes. SLC-VIO adopts LSD and LBD algorithms to detect and track line features, which can be further accelerated by GPU. Therefore, the efficiency of this algorithm might be improved with the aid of hardware acceleration. In sliding window optimization, marginalization is another time-consuming operation due to the dense Hessian matrix. This problem can be potentially solved by discarding part of point and line features to obtain a sparse Hessian matrix. Skipping frames is another solution to ensure real-time performance. In this implementation, frames are skipped to ensure the oncoming frame is processed timely if the actual frame rate exceeds 10 Hz. Generally, this method can improve the efficiency of SLC-VIO with little influence on the positioning accuracy. However, the number of matched and tracked point/line features may decrease if some frames are skipped while the camera is moving at high speed, and the accuracy deteriorates in these cases.
7.2. Tests on TUM VI data sets and real-world experiment
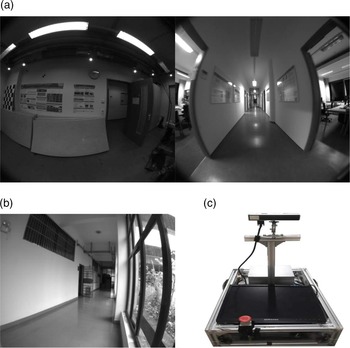
Because the scenes in TUM VI [Reference Schubert, Goll, Demmel, Usenko, Stuckler and Cremers35] data sets (see in Fig. 11(a)) and real-world experiments (see in Fig. 11(b)) are similar low-texture corridors, the two experiments are described and analyzed together. Since there are not enough point features, such low-texture corridors are also a great challenge for visual SLAM/VIO systems.
(a) Illustration of scenes in TUM VI data sets. (b) Illustration of the corridor in the real-world experiment. (c) The automated vehicle used in the real-world experiment.

The TUM VI data sets are collected by a handheld device and also provide the ground truth trajectories. Since the images’ distortions in TUM data set are relatively large, we used an equidistant camera model [Reference Huang, Wang, Shen, Lin and Chen36] rather than a pinhole camera model to cope with the distortions. As shown in Fig. 11(c), the real-world experiment was carried out on an automated vehicle equipped with a visual-inertial sensor. The automated vehicle ran in the corridor at a speed of 1 m/s to collect data. Data acquisition started and ended at the same location. Unlike the public data sets, there is no ground truth for the evaluation of positioning accuracy in the real-world experiment. However, since the actual starting point and endpoint are the same, the positioning error can be determined by the distance between the starting point and the endpoint of the estimated trajectory.
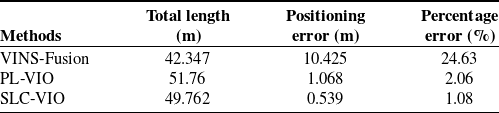
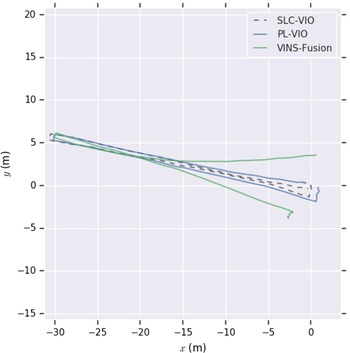
Table IV presents the RMSE of APE tested on TUM VI data sets. Figure 12 and Table V show the estimated trajectories and positioning errors of the three VIO systems in a real-world experiment, respectively. It can be seen that in these two experiments, due to the lack of point features, the positioning error of VINS-Fusion is significantly larger than that of PL-VIO and SLC-VIO. This result demonstrates the advantages of using line features for VIO system in low-texture environments. The result that SLC-VIO performed better than PL-VIO indicates that using structural line features as landmarks and considering the PPBL can further improve the accuracy of VIO system in structured environments, especially in environments with low texture.
RMSE on TUM VI data sets (unit: meters).

Positioning error in real-world experiments.

The estimated trajectories in the real-world experiment.

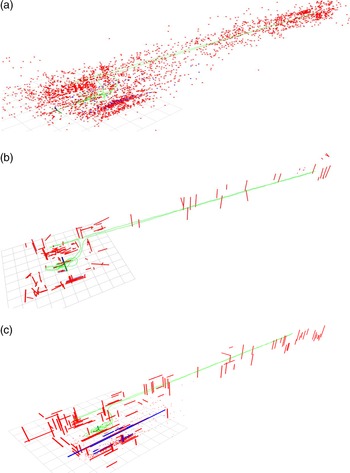
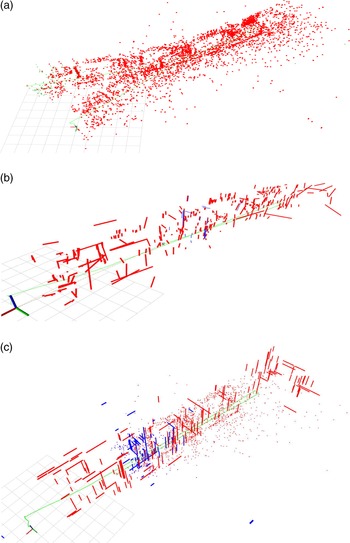
Figures 13 and 14, respectively, show the reconstructed 3D map by VINS-Fusion, PL-VIO, and SLC-VIO in the tests of the TUM VI data sets and real-world experiments. It can be seen that, compared with the map composed of only sparse point features, the map composed of line features can better reflect the environment’s geometric structure information. And in Fig. 14(a), there is an apparent drift in the 3D map obtained by VINS-Fusion. It demonstrates that the mapping performance of the VIO system using only point features will deteriorate in a low-texture environment. In contrast, as shown in Fig. 14(b)–(c), in the reconstructed 3D maps utilizing line features, the drift is significantly reduced. Besides, as shown in Figs. 13(b) and 14(b), there are many disordered line features in the 3D map obtained by PL-VIO. In contrast, as shown in Figs. 13(c) and 14(c), the 3D map obtained by SLC-VIO more correctly reflects the geometric structure of scenes. The reason is that after using the prior environmental geometric information, the 2-DoF structural line in SLC-VIO has better convergence than the 4-DoF straight line represented by Plück coordinates in PL-VIO during optimization. This result illustrates the advantages of using structural lines to reconstruct a 3D map.
Reconstructed 3D maps by VINS-Fusion (a), PL-VIO (b), and SLC-VIO (c) on TUM VI data sets. The blue lines in (c) are new landmarks added to the map, and the red points or lines are the old landmarks in the map. The green line is the trajectory of camera.

Reconstructed 3D maps by VINS-Fusion (a), PL-VIO (b), and SLC-VIO (c) in the real-world experiment. The blue lines in (c) are new landmarks added to the map, and the red points or lines are the old landmarks in the map. The green line is the trajectory of camera.

8. Conclusion
This paper presents the SLC-VIO system, which is a stereo VIO using both point features and structural line features as landmarks and considering the property of PPBL. The man-made structure environment is modeled as a Manhattan world, and then 2-DoF spatial structure lines are defined in it. By adding the image observations of structural lines to visual measurements and establishing distance-residual constraints between points and lines in the reconstructed 3D map, the proposed system makes full use of the prior geometric information of structured environments and thereby achieves better positioning accuracy.
The proposed system was tested on public data sets and in the real-world environment and compared with the state-of-the-art VIO methods, including VINS [Reference Qin, Li and Shen8] and PL-VIO [Reference He, Zhao, Guo, He and Yuan14]. The results illustrate that taking structural line features as landmarks and considering the PPBL can significantly reduce the drift in the reconstructed 3D maps and improve the positioning accuracy, especially in low-texture or poor illumination environments. However, in environments where it is hard to find line features, the proposed system degenerates into a VIO system that uses only point features, just like VINS [Reference Nützi, Weiss, Scaramuzza and Siegwart7]. In addition, it can be seen that the spatial structural line with 2-DoF has better convergence and optimization efficiency than the general spatial line with 4-DoF represented by Plücker coordinates during optimization.
Author Contributions
All authors contributed to the study conception, design, and implementation. Material preparation, data collection, and analysis were performed by Chenchen Wei, Yanfeng Tang, and Zhi Huang. The original draft of the manuscript was written by Chenchen Wei and reviewed and edited by Lingfang Yang and Zhi Huang. All authors commented on previous versions of the manuscript. All authors read and approved the final manuscript.
Financial Support
This work was supported by the Natural Science Foundation of Hunan province (Grant numbers [2018JJ3062]).
Ethical Considerations
None.
Conflicts of Interest
The authors declare none.