


Significant outcomes
-
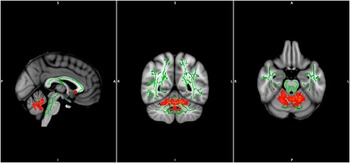
∙ Fractional anisotrophy was increased in cerebellum in obsessive–compulsive disorder (OCD).
-
∙ White matter morphometry was normal in the sample.
-
∙ White matter hyperintensities was not part of the obsessive–compulsive pathophysiology.
Limitations
-
∙ Sample may not be representative of OCD as patients with common comorbid psychiatric disorders were excluded.
-
∙ A large proportion of the patients were receiving serotonin reuptake inhibitors, which could influence the findings.
Introduction
Obsessive–compulsive disorder (OCD) is characterised by intrusive thoughts and repeated compulsions to relieve the anxiety produced by the intrusive thoughts. It is a common disease with a lifetime prevalence of 1–3% (Reference Somers, Goldner, Waraich and Hsu1).
Increasing evidence suggests the involvement of an orbitofrontal-basal ganglia circuit in OCD. Both structural studies (Reference Piras, Piras, Chiapponi, Girardi, Caltagirone and Spalletta2) and functional studies (Reference Menzies, Chamberlain, Laird, Thelen, Sahakian and Bullmore3) support this theory although other results show the involvement of other parts of the brain or even that the brain in OCD patients is not altered. As most of this evidence is concerned with brain grey matter (GM) structure and function, only relatively little is known about the white matter (WM). A few studies report that the amount of WM is relatively decreased (Reference Riffkin, Yncel and Maruff4,Reference Braber den, van’t Ent and Boomsma5) or increased (Reference Braber den, van’t Ent and Boomsma5,Reference Togao, Yoshiura and Nakao6) in OCD patients in certain regions of the brain using voxel-based morphometry(VBM). Others report that the quality of the WM (the ability to efficiently deliver neuronal signals) may be affected. Several studies (Reference Szeszko, Ardekani and Ashtari7–Reference Benedetti, Giacosa and Radaelli18) report either increased or decreased fractional anisotropy (FA) in OCD. FA is used to evaluate integrity of WM fibre tracts. Decreases in FA are interpreted as decreases in the WM integrity or increase in number of crossing fibres. Location and direction of the abnormal FA in OCD is inconsistent and the need for clarification of this issue is still prominent. One previous report suggests that OCD patients, despite a relatively young age of onset, have more WM hyperintensities (WMH) than healthy controls (HCs) (Reference Amat, Bronen and Saluja19) and increased number of WMHs could lead to decreases in FA.
The most common explanation to why the results from the previous studies differ is that patient groups differ substantially. Most studies include both medicated and unmedicated patients. The most common pharmacological treatment of patients with OCD is serotonin reuptake inhibitors (SRIs), but some patients have their treatment augmented with antipsychotic medications, which may have structural effects on the brain (Reference Konopaske, Dorph-Petersen and Sweet20). The discrepancy in results has also been ascribed to the fact that psychiatric comorbidity is very common in OCD. Up to 40% of OCD patients have a comorbid depression and up to 10% have schizophrenia (Reference Tükel, Polat, Özdemir, Aksüt and Türksoy21). Approximately 20% have other anxiety disorders in addition to the OCD diagnosis. Finally, OCD is a heterogeneous disorder regarding age of onset, severity and symptom dimensions. Neuroimaging studies found differences between symptom subtypes of OCD (Reference van den Heuvel, Remijnse and Mataix-Cols22,Reference Koch, Wagner and Schachtzabel23). Especially hoarders seems to have a unique profile regarding neuroimaging as well as treatment outcome (Reference Fontenelle, Mendlowicz, Soares and Versiani24,Reference An, Mataix-Cols and Lawrence25). Two recent diffusion tensor imaging (DTI) studies report differences in the integrity of the WM of unmedicated OCD patients (Reference Benedetti, Giacosa and Radaelli18,Reference Fan, Yan and Wang26), and one study has investigated the impact of symptom dimensions (Reference Koch, Wagner and Schachtzabel23).
The aim of this study was to investigate whether previous results of changes in FA could be replicated, and whether FA increase or decrease could be partly due to either morphological or WMH differences between the OCD patients and the HCs. We excluded patients with comorbid psychiatric disorders except diagnoses secondary to OCD and patients who had medical treatment augmented with antipsychotics.
Methods
Participants
In total, 30 patients were recruited consecutively from referrals to the Clinic for OCD, Aarhus University Hospital Risskov, Denmark from January 2009 to January 2011. Inclusion criteria were as follows: (1) a primary diagnosis of OCD according to the International Classification of Diseases 10th edition and the Diagnostic and Statistical Manual of Mental Disorders 4th edition (DSM-IV), (2) age 18–60 years, (3) Caucasian, (4) Danish as native language, (5) a Yale-Brown Obsessive–Compulsive Scale score (Y-BOCS) of 16 or more indicating moderate to severe OCD. Exclusion criteria were as follows: (1) other psychiatric comorbidity, except for anxiety disorders secondary to OCD, and personality disorders from cluster C in DSM-IV, or organic brain disease, (2) psychotropic treatment other than SRIs, (3) onset of treatment with SRI’s <3 months before magnetic resonance imaging (MRI), (4) Hamilton Depression Rating (Ham-D17) >17.
In total, 30 HCs were matched on sex, age and total years of formal education. Exclusion criteria were as follows: (1) psychiatric and neurological comorbidity in either HC or their first-degree relatives, (2) any psychotropic ongoing treatment.
Assessment
Initial diagnostic assessments were conducted as part of the ordinary routines at the Clinic for OCD by experienced clinicians using the Anxiety Disorders Interview Schedule for DSM-IV and the Structured Clinical Interview for DSM-IV Axis II Personality Disorders. A senior psychiatrist supervised these assessments. Patients could be on a waiting list for up to 1 year. Therefore, immediately before MRI scans, secondary diagnostic assessments were conducted by two psychologists not involved in the initial diagnostic assessments using the Schedules for Clinical Assessment in Neuropsychiatry (SCAN), version 2.1 (Reference Wing, Babor and Brugha27,Reference Wing, Sartorius and Üstün28). The two psychologists were trained in SCAN and supervised by a senior psychiatrist at a WHO-designated SCAN Training and Reference Centre (WHO Collaborating Centre for Research and Training in Mental Health, Aarhus University Hospital, Risskov). Initial diagnoses were confirmed in all cases. OCD severity was measured using Y-BOCS (Reference Goodman, Price and Rasmussen29) and depressive symptoms was rated using Ham-D17.
MRI acquisition
MRI was performed on a whole-body 3 tesla Signa HDx GE scanner (GE Medical Systems, Little Chalfont, United Kingdom). The T1 structural MRI sequence consisted of an axial fast spoiled gradient-echo three-dimensional (3D) T1-weighted sequence [inversion time (TI)=750 ms, flip angle=14°, field of view (FOV)=240 mm, matrix 256×256, slice thickness=1.2 mm, no gap. The DTI MRI sequence consisted of diffusion weighted 2D spin echo volumes in 26 directions with b=1000 s/mm2 and a six interleaved unweighted volumes (b=0 s/mm2) with a repetition time (TR) of 12 500 ms, flip angle 90° and optimised echotime (TE). The FOV was=240 mm in a matrix of 128×128. The in-plane resolution was 2.2 mm2 and the slice thickness was 3.5 mm with no gaps. Slice order was interleaved bottom-up. The sequence was repeated three times. The acquisition time of the T1 and DTI scans were approximately 11 min and 7 min 30 s, respectively. The T2 fluid-attenuated inversion recovery (FLAIR) sequence consisted of an axial T2-weighted fluid-attenuated inversion recovery (TE=120 ms, TR=9250 ms, TI=2250 ms, FOV=240 mm, matrix 224×256, slice thickness=3.5 mm with no gaps).
Statistics
Native space measures of total GM, WM, cerebrospinal fluid (CF) and total intracranial volume (TIV) were derived from segmented images before normalisation. The ratios between GM, WM, CF and the TIV were computed as well. Between-group differences in demographics, clinical values and native space parameters were assessed using Mann–Whitney U-test in Stata 11 on OSX 10.7.
DTI analysis
Voxelwise statistical analysis of the FA data was carried out using tract-based spatial statistics (TBSS), part of FMRIB software library (FSL) (Reference Smith, Jenkinson and Woolrich30). First, FA images were created by fitting a tensor model to the raw diffusion data using FMRIB's diffusion toolbox (FDT) (Reference Behrens, Woolrich and Jenkinson31), and then brain extracted using Brain Extraction Tool (BET). All subjects’ FA data were then aligned into a common space using the non-linear registration tool FMRIB's nonlinear image registration tool (FNIRT), which uses a b-spline representation of the registration warp field. Next, the mean FA image was created and thinned to create a mean FA skeleton, which represents the centres of all tracts common to the group. Each subject’s aligned FA data were then projected onto this skeleton and the resulting data fed into voxelwise cross-subject statistics. Voxelwise statistics was performed on the skeleton using a general linear model with two groups and age, gender, severity and illness duration as covariates. Age was meaned over the whole sample. Severity and duration was meaned separately in the groups to minimise noise due to variations on these parameters. Post hoc analysis showed no significant correlations with severity and duration within the patient group. Permutation tests as implemented in randomise function in the FSL package was performed running 100 000 Monte Carlo permutations. The statistical threshold for voxels was p<0.05 corrected for multiple comparisons using family wise error (FWE) rate.
VBM analysis
VBM analysis was performed using SPM8 (patched to release 4290) and MATLAB 7.3 (R2011B) on a clustered Linux environment. MRI were segmented into WM, GM and CF using the standard unified segmentation model in SPM8. WM population templates were generated from the entire image data set using the diffeomorphic anatomical registration using exponentiated Lie algebra (DARTEL) technique. After an initial affine registration of the WM DARTEL templates to the tissue probability maps in Montreal Neurological Institute (MNI) space (http://www.mni.mcgill.ca/), non-linear warping of WM images was performed to the DARTEL WM template in MNI space. Images were proportionally modulated with total WM volume (WMV) to ensure that relative volumes of WM were preserved following the spatial normalisation procedure including modulation with Jacobian determinants. Finally, images were smoothed with a 12 mm full width at half maximum Gaussian kernel. After spatial pre-processing, the smoothed, modulated, normalised WM data sets were used for statistical analysis.
Between-group regional differences in WM density were assessed using the general linear model in SPM8 and the significance of each effect was estimated from the distributional approximations of Gaussian random fields. A relative threshold mask of 0.2 was used for WM analyses. The pre-processed images were used as dependent variables, diagnosis as independent variable with gender, age, severity and duration of illness as covariates. Severity and duration were meaned over groups. Significant effects were assessed using the FWE threshold of p<0.05, corrected for multiple comparisons. Results were also assessed using an uncorrected threshold of p<0.001 in order to be able to compare our results with findings in previous studies but these results were not considered as true positives. Of the uncorrected results only the clusters exceeding 1000 voxels are reported.
WMH
An experienced neuroradiologist, who also reported whether there were any radiological signs of other comorbidity, identified WMH. WHMs were drawn onto relevant anatomical location on template T1 images from the BrainVoyager QX software package (Brain Innovations, Maastricht, the Netherlands).
Results
Demographics
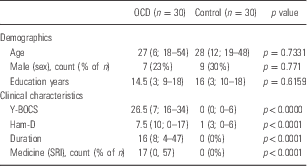
There were no significant between-group differences in the demographical variables. Although patients did not have major depressive disorder they did have an increased Ham-D compared with HCs, which may be due to OCD symptoms or a subclinical level of depressive symptoms. Patients were severely ill and had a Y-BOCS score with a median of 26.5 and a median duration of illness of 16 years (see Table 1).
Demograhics and clinical characteristics
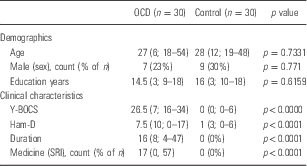
OCD, obsessive–compulsive disorder; Ham-D, Hamilton Depression Rating; SRI, serotonin reuptake inhibitor; Y-BOCS, Yale-Brown Obsessive–Compulsive Scale score.
Data are reported as median (interquartile range; range) unless otherwise specified. The Mann–Whitney U-test was used to compare non-parametric data. Comparisons of categorical data were performed using Fisher’s exact test.
All p values are two-tailed.
VBM
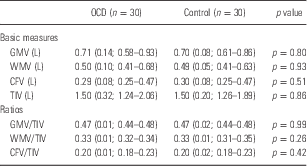
There were no between-group differences in total WMV or in the ratio between WMV and TIV (see Table 2).
Rough brain measures
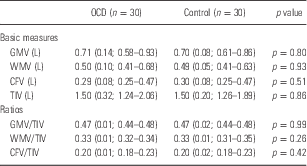
CFV, cerebrospinal fluid volume; GMV, grey matter volume; OCD, obsessive–compulsive disorder; TIV, total intracranial volume; WMV, white matter volume.
Data are reported as median (interquartile range; range). The Mann–Whitney U-test was used to compare non-parametric data.
All p values are two-tailed.
There were no differences in the WM density between the two groups, when correcting for multiple comparisons using FWE correction. The uncorrected statistics did not reveal any areas with increased or decreased WM density in clusters exceeding a 1000 voxels. One cluster in left superior frontal gyrus consisted of 772 voxels, but the cluster-level FWE-corrected p was not significant (p=0.335).
WMH
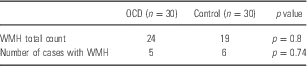
There were only few WMHs in the sample (see Table 3). There were no between-group difference in the number of WMH’s and the number of affected subjects in each group did not differ either (see Table 3).
White matter hyperintensities
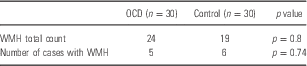
OCD, obsessive–compulsive disorder; WMH, white matter hyperintensities.
The Wilcoxon–Mann–Whitney U-test was used to compare non-parametric data.
All p values are two-tailed.
DTI
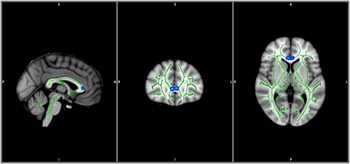
The TBSS DTI analysis showed an increase in the FA in the cerebellum of patients with OCD. Decreases in FA were found mainly in the in genu of corpus callosum/forceps minor (see Figs 1 and 2).
Decrease in FA is denoted in blue. TBSS_fill function was used to highlight changes in the common skeleton of tracts (Green) The standard MNI152_T1_1mm_brain was used as background template.

Increase in FA is denoted in red-yellow. TBSS_fill function was used to highlight changes in the common skeleton of tracts (Green). The standard MNI152_T1_1mm_brain was used as background template.

Discussion
In contrast to previous reports, we did not find any differences in the density of WM using VBM using statistics with assumptions met by the nature of VBM data. Previous evidence of decreased WM density in OCD has been found in right inferior and medial temporal gyrus (Reference Riffkin, Yncel and Maruff4), left medial prefrontal, cingulate and fusiform gyrus and right cuneus (Reference Togao, Yoshiura and Nakao6), and right postcentral gyrus (Reference Lazaro, Castro-Fornieles and Cullell32) and bilateral prefrontal cortex (Reference van den Heuvel, Remijnse and Mataix-Cols22). Previous results do not point to a common decrease in WM density.
Our sample of OCD patients is clinically similar to most previous samples in DTI studies. Most sample sizes are smaller, but recent studies (Reference Bora, Harrison and Fornito15–Reference Benedetti, Giacosa and Radaelli18) present results from samples with a similar size as our sample. Of these studies, Benedetti et al. have a sample with more severe OCD and a longer duration of illness than in our study. The other three studies have either a shorter duration of illness (Reference Li, Huang and Yang16,Reference Nakamae, Narumoto and Sakai17) or patients with a lower Y-BOCS score (Reference Bora, Harrison and Fornito15).
However, considering the statistics used in these studies, they have a higher risk of false positives. The cluster size correction thus used by Riffkin et al. (Reference Riffkin, Yncel and Maruff4) and Van den Heuvel et al. (Reference van den Heuvel, Remijnse and Mataix-Cols22) is questionable because of the non-stationarity of the resells (Reference Ashburner and Friston33). These statistics will therefore overestimate the significance in homogeneous areas and underestimate the significance in heterogeneous areas. This is observed in the current study where the cluster of 772 voxels was far from significant using cluster-level FWE correction. False discovery rate is dependent on compact support, which is not the case in VBM. When correcting using FWE taking the nature of the VBM data into account, we did not replicate these previous results. The FWE has a higher risk of false negatives, but the previous results are not uniformly suggesting, which specific areas that have decreased WM density. Although this is not what was expected, it is in line with a previous report (Reference Duran, Hoexter, Valente, Miguel and Busatto34) that also did not find a decreased density of WM in OCD.
FA
Interestingly, we found increased FA in the cerebellar regions. Cerebellum has often been neglected in MRI studies of OCD. In recent years, there has been an increased focus on the role of cerebellum regarding cognition and emotion as well as automated movements (Reference Schmahmann35,Reference Stoodley and Schmahmann36). The study of affective and cognitive effects of lesions in the cerebellum has led to the theory of the cerebellar cognitive affective syndrome. Both positive and negative affect covaries with functional connectivity in the cerebellum and the medial prefrontal cortex. In accordance with this increased blood flow has been found in depression (Reference Videbech, Ravnkilde and Pedersen37).
Furthermore, cerebellar-striatal and prefrontal cerebral-cerebellar circuits have been found in primates and it is likely that they underlie some of the cognitive processes. Imbalance in these circuits has been linked i.a. to poor mental flexibility (Reference Schmahmann35), which might underlie some of the OCD symptomology.
Three VBM studies found either decreased (Reference Kim, Lee and Kim38,Reference Koprivová, Horácek and Tintera39) or increased (Reference Pujol, Soriano-Mas and Alonso40) GM density in cerebellum, which support the involvement of cerebellum in the patophysiology of OCD. Cerebellum has been of little interest in MRI studies of OCD, probably because its role in the cortico-striatal model of OCD has not been evident, and functional studies have focussed on processes underlying cognitive tasks. A few studies (Reference Nabeyama, Nakagawa and Yoshiura41,Reference Nakao, Nakagawa and Yoshiura42) found decreased cerebellar activity during cognitive tasks, which where normalised after clinical improvement. Recently, Hou (Reference Hou, Wu and Lin43) found increased resting state cerebellar low-frequency fluctuations in OCD compared with HCs. This supports the notion, that cognitive processes in the cerebellum could be part of the OCD aetiology. Increase in FA in cerebellum has also recently been found in schizophrenia (Reference Filippi, Canu and Gasparotti44,Reference Koch, Wagner and Dahnke45) indicating that hyperconnectivity expressed by high FA may be a common aetiological marker of these disorders creating imbalance in the circuits creating rigour in the cognitive abilities and difficulties regulating emotions. Further investigation of this hypothesis is warranted.
A decrease in FA was found in the forceps minor. This is in line with previous reports (Reference Bora, Harrison and Fornito15,Reference Nakamae, Narumoto and Sakai17,Reference Benedetti, Giacosa and Radaelli18,Reference Koch, Wagner and Schachtzabel23) where a decreased FA was found in the same region. Benedetti et al. found this decrease in a medicated sample of OCD patients. In our sample, 17 out of 30 patients received treatment with SRIs, but none of these patients had their treatment augmented by antipsychotics.
Some reports (Reference Yoo, Jang and Shin8,Reference Benedetti, Giacosa and Radaelli18,Reference Fan, Yan and Wang26) suggest that drugs may have an influence on the WM microstructure in OCD. Thus, Konopaske et al. showed significant deterioration of WM after a period of antipsychotic medication. Benedetti et al. (Reference Benedetti, Giacosa and Radaelli18) found a decrease in FA in medicated OCD patients, but not in unmedicated patients. In total, 12 out of 22 of their medicated group of patients had, however, their SRI treatment augmented with antipsychotic medication within few years before the study. Interestingly, as SRIs have been suggested as protective agents against atrophy in depression, both Fan et al. and Yoo’s group examined the effect of SRI in OCD. They found that treatment is associated with some normalisation in FA in OCD patients. Remarkably, the pre-treatment differences pointed in opposite directions, where Fan et al. found pre-treatment decrease in FA in the OCD group and Yoo et al. found increase before treatment. The patient groups in Benedetti et al. (Reference Benedetti, Giacosa and Radaelli18) may have differed in severity of OCD symptoms before treatment, even though the groups did not differ at the time of inclusion. This could partially explain the FA differences despite the SRI treatment.
Decreased FA in areas including forceps minor have also been found by recent studies including both medicated (Reference Benedetti, Giacosa and Radaelli18) and unmedicated samples of OCD patients (Reference Bora, Harrison and Fornito15,Reference Nakamae, Narumoto and Sakai17) using TBSS. All of these studies found larger areas with decreased FA than we did in the present study. This might be due to the fact that we used a voxel-based correction and these studies used cluster-based statistics (Reference Ashburner and Friston33,Reference Smith, Jenkinson and Johansen-Berg46). We believe, that specificity in exactly which areas are affected in OCD is very important, especially in relation to deep brain stimulation and that the forceps minor could play a key role in OCD. A decrease in FA in forceps minor results in a lower speed in neural signalling between contralateral frontal areas, which could impact cognitive control and executive abilities (Reference Grieve, Williams, Paul, Clark and Gordon47). There were neither a higher number of WMHs nor number of WMH-affected subjects in the patients compared with HCs. It has previously been suggested that the impact of WMH is mediated by their specific location in depression (Reference Dalby, Chakravarty and Ahdidan48). None of the WMH registered in patients were located in forceps minor. The decrease in FA in forceps minor is thus not dependent on an increase in the number of WMHs, which could decrease FA.
We found no differences in the morphology of the WM between patients and HCs, but an increase in FA was found in the cerebellum and a decrease in FA was found in the forceps minor in patients. Our findings suggest that increase and decrease of FA in cerebellum and forceps minor should be integrated in current theories of OCD.
Acknowledgements
T.H., S.V., R.R. and P.V. designed the study. T.H. and S.V. collected data. L.S. was responsible for identifying WMH’s. T.H. wrote the first draft of the manuscript. All authors took part in revising the manuscript and approved the final manuscript.
Financial Support
The study was conducted as part of a PhD fellowship supported by Pulje til Styrkelse af psykiatrisk forskning and Fonden til lægevidenskabens fremme. None of the foundations had any influence on the study design or the reporting of the study.
Conflicts of Interest
The authors report no conflicts of interest.