


Introduction
Electoral districts often exhibit a wide variation in wealth, income, industrialization, urbanization and ethnicity. Districts can also vary in their ideological composition. Some electoral districts are ideologically homogeneous, with voters largely sharing the same views on most issues. Others can be characterized by ideological heterogeneity. One obvious implication of this is that voters who are situated in vastly different contexts may experience elections differently. In homogeneous districts, the majority of voters are surrounded by others who vote the way they do. In heterogeneous districts, voters regularly encounter people who vote (and think and view the world) differently from them.
Existing research shows that the social environment in which one lives shapes civic participation. Studies show for instance that communities that are homogeneous in terms of wealth, race and ethnicity have higher levels of public spending, higher levels of social capital and hence higher levels of voluntarism, membership in civic organizations and trust of others (Alesina and La Ferrara, Reference Alesina and La Ferrara2000, Reference Alesina and La Ferrara2002; Alesina et al., Reference Alesina, Baqir and Easterly1999; Costa and Kahn, Reference Costa and Kahn2003). Cultural and economic homogeneity thus increase civic participation.Footnote 1 Little is known, however, as to the effects of ideological diversity of communities and its impact on turnout. This is surprising because ideology is an important element of political contestation and participation, for both parties and voters (Adams and Merrill III, Reference Adams and Merrill2003; Adams et al., Reference Adams, Brunell, Grofman and Samuel Merrill2010; Enelow and Hinich, Reference Enelow and Hinich1984; Plane and Gershtenson, Reference Plane and Gershtenson2004). We therefore extend the existing literature and introduce a measure of ideological diversity of districts and explore its effects on voter turnout, at both the individual and district level. Importantly, these two levels of analysis capture distinct aspects of the ideological environment: district-level heterogeneity reflects the overall spread of views within a constituency, whereas individual-level distance captures how far a specific voter deviates from the average ideological position of that distribution. An individual may find themselves ideologically isolated even in an otherwise relatively homogeneous district, and we treat these as conceptually and empirically distinct quantities throughout.
Following findings on district homogeneity and civic participation, we might expect turnout to be higher in ideologically homogeneous districts. Yet, this ignores an important feature of electoral participation: the level of competitiveness of a district. Political contention increases voter turnout, at least modestly.Footnote 2 Indeed, we find in this article that the ideological heterogeneity of an electoral district and its winning margin are inversely related, meaning that as heterogeneity increases, winning margins decrease and elections become more competitive.
We present a theory that reconciles these findings, predicting a curvilinear relationship between ideological heterogeneity and turnout. Drawing on political psychology and social theories of participation, we argue that moderate levels of disagreement sharpen political identities and raise the perceived stakes of participation, while both very low and very high heterogeneity reduce engagement—the former through free-riding, the latter through cognitive overload and social discomfort.Footnote 3 This association operates independently of electoral competitiveness, since voters’ experiences of ideological diversity extend beyond election-time mobilization into day-to-day social interactions (Enos and Hersh, Reference Enos and Hersh2015). We develop these mechanisms in the theory section that follows.
We test this claim using the Local Parliament Project (LPP), a large-scale survey from the 2015 Canadian federal election with 31,246 completed responses and substantial samples at the district level (Loewen et al., Reference Loewen, Rubenson and Koop2018).Footnote 4 Respondents’ positions across 37 issue domains allow us to measure ideological heterogeneity within each district and situate individual voters in that context.
We find a statistically significant curvilinear association between individual ideological distance from the district mean and turnout: participation is highest at moderate levels of distance and declines toward both extremes, net of district competitiveness and party mobilization. At the district level, the pattern is substantively similar but statistically insignificant; we treat these results as suggestive.
Theories of Voter Turnout
Political scientists have often wondered why people turn out to vote since a single vote is highly unlikely to be pivotal (Gelman et al., Reference Gelman, King and John Boscardin1998). The costs of voting outweigh the individual material benefits, and thus there exists a paradox (Downs, Reference Downs1957; Grofman, Reference Grofman1993). Several explanations have been offered as to why the majority of people vote despite this unfavourable cost-benefit calculus. One of the most common explanations is that people vote out of a sense of civic duty (Blais, Reference Blais2000; Riker and Ordeshook, Reference Riker and Ordeshook1968).
People with a strong sense of civic duty derive satisfaction from the act of voting because it affirms their compliance with the democratic system.Footnote 5 The benefits derived from the fulfillment of one’s civic duty thereby offset the costs of voting for these citizens.
Rational choice and civic duty models differ as to the perceived motivations underlying turnout, but both view voting as a mostly individual act. Yet, the decision to vote might be driven by other-regarding, or community focused, concerns as well.Footnote 6 Although the likelihood that a single vote is pivotal is small, the potential benefits to the community, if the preferred candidate wins, are high. Indeed, while some voters do come to understand the low probability of casting a decisive vote, research shows that citizens nonetheless tend to significantly overestimate the influence of their own vote (Blais, Reference Blais2000; Duffy and Tavits, Reference Duffy and Tavits2008; Labbé St-Vincent, Reference Labbé St-Vincent2013). Just as voters may overestimate their individual electoral impact, they may similarly overestimate the community benefits their vote could bring, further reinforcing the motivation to participate. Viewed this way, what matters is not whether your vote is decisive, but rather whether your vote may contribute to an outcome that is desirable to many. Research has thus shown that individuals with high levels of altruism and individuals with strong ties to their local community are more likely to vote because their cost-benefit calculus extends beyond their personal self-interest (Dawes et al., Reference Dawes, Loewen and Fowler2011; Edlin et al., Reference Edlin, Gelman and Kaplan2007; Fowler and Kam, Reference Fowler and Kam2007). Conversely, geographic mobility weakens these community ties and reduces turnout, particularly among those with low social capital (Dowding et al., Reference Dowding, John and Rubenson2012).
Voting is also a social act. At the household level, ideological composition shapes turnout (Fieldhouse and Cutts, Reference Fieldhouse and Cutts2018; Hersh and Ghitza, Reference Hersh and Ghitza2018), members coordinate participation (Bhatti et al., Reference Bhatti, Fieldhouse and Hansen2020; Dahlgaard et al., Reference Dahlgaard, Bhatti, Hansen and Hansen2022), and social influence can mobilize reluctant voters (Fieldhouse and Cutts, Reference Fieldhouse and Cutts2012; Nickerson, Reference Nickerson2008). In broader social networks, disagreement and diversity can both stimulate and depress participation depending on the degree of cross-cutting exposure (Galandini and Fieldhouse, Reference Galandini and Fieldhouse2019; Huckfeldt and Sprague, Reference Huckfeldt and Sprague1995; Nir, Reference Nir2011), and social pressure to participate operates differently depending on the partisan composition of one’s environment (Blais et al., Reference Blais, Galais and Coulombe2019; Coulombe et al., Reference Coulombe, Blais and Dassonneville2025; Fieldhouse and Cutts, Reference Fieldhouse and Cutts2021). While this literature has examined how households and networks shape participation, less attention has been paid to ideological heterogeneity at the district level as a contextual feature that structures the environment of disagreement individuals encounter. We argue that this district-level ideological context shapes participation through distinct mechanisms, which we develop next.
Community Diversity and Civic Participation
The level of social capital varies by the type of community in which one lives. Social capital tends to be higher in homogeneous communities (Fearon and Laitin, Reference Fearon and Laitin1996). An extensive literature on community diversity in the US links community cohesiveness to levels of public spending, civic participation and trust of others. Communities with high levels of diversity in terms of race, ethnicity or income, have been shown to perform worse on all these outcomes (Alesina and La Ferrara, Reference Alesina and La Ferrara2000, Reference Alesina and La Ferrara2002; Alesina et al., Reference Alesina, Baqir and Easterly1999; Gisselquist, Reference Gisselquist2014; Poterba, Reference Poterba1997).
Empirically, participation in social groups is lower in racially diverse US communities (Alesina and La Ferrara, Reference Alesina and La Ferrara2000), and similar patterns hold for linguistic diversity in Norway (Kaniovski and Mueller, Reference Kaniovski and Mueller2006), ethnic heterogeneity in Germany (Förster, Reference Förster2018), and income inequality (Matsubayashi and Sakaiya, Reference Matsubayashi and Sakaiya2021). A review by (Costa and Kahn, Reference Costa and Kahn2003) across 15 studies confirms that community heterogeneity generally reduces civic participation, while homogeneity increases it (see also Oliver (Reference Oliver2000)). However, these effects may differ for majority and minority groups (Oliver, Reference Oliver2001; Rubenson, Reference Rubenson2005), and the evidence suggests that ethnic and economic heterogeneity affect turnout in a linear fashion. At the ideological level, the picture is more nuanced. (Laméris et al., Reference Laméris, Jong-A-Pin and Garretsen2018) find that a one-dimensional representation of voter ideology conceals much underlying diversity, and Navarrete (Reference Navarrete2020) demonstrates that ideological proximity between voters and parties consistently increases turnout, pointing to the importance of ideological composition for participation.
Yet the relationship between ideological composition and participation remains underexplored at the community level. We extend the existing literature on community heterogeneity and civic participation by introducing a different measure of community level diversity: ideological heterogeneity. We operationalize this as the diversity of opinions across political issues within an electoral district.Footnote 7 Although ideological heterogeneity may well be correlated with ethnic or economic heterogeneity, it is not the same. Ideological heterogeneity captures an important and essential feature of politics: the diversity of people’s views on policy issues. In this sense, it is closer to politics than either ethnic or economic heterogeneity. The question we set out to explore is whether a diversity of opinions increases or decreases voter participation.
Building on existing work on political context and participation, we conceptualize ideological heterogeneity as distinct from related constructs such as polarization and electoral competitiveness, and argue that it may be associated with turnout in a nonlinear way.
Ideological Heterogeneity and Voting
We begin by distinguishing the association between ideological heterogeneity and turnout from related but conceptually distinct constructs, particularly electoral competitiveness and polarization. While competitiveness may correlate with heterogeneity, especially in multiparty systems, it is not the mechanism through which we expect ideological heterogeneity to influence political participation. Similarly, polarization typically refers to the distance between ideological camps, whereas our focus is on the dispersion and diversity of views within a district, and how this shapes individuals’ experience of their political environment.
Ideological heterogeneity is also distinct from both social heterogeneity (ethnic diversity, economic inequality) and the dispersion of party support. Social heterogeneity shapes participation through mechanisms related to social cohesion and unequal engagement (Basset and Stockemer, Reference Basset and Stockemer2026; Solt, Reference Solt2008), but individuals with similar social backgrounds may hold divergent political views. Vote heterogeneity reflects the distribution of partisan preferences, but districts with similar levels of partisan fragmentation may differ substantially in the diversity of underlying policy preferences. We treat ideological heterogeneity as a distinct contextual feature, one that captures variation in policy-relevant views and shapes participation through the disagreement individuals encounter in their local environment (Condon et al., Reference Condon, Larimer and Panagopoulos2016; Huddy et al., Reference Huddy, Mason and Aarøe2015).
With these distinctions in place, we now turn to the mechanisms through which ideological heterogeneity shapes participation. Classical models of voting have long recognized that both alienation (the sense that no available option reflects one’s preferences) and indifference (the perception that available options are too similar to warrant a choice) can suppress turnout. Our argument shares this intuition but departs from it in an important respect: rather than focusing on pivotality or the proximity of candidates to individual voters, we locate the relevant mechanism in the social experience of disagreement itself. We treat ideological heterogeneity as a contextual feature that works through psychological and social channels rather than purely instrumental ones. Turnout is shaped not only by cost–benefit calculations, but also by the cues people take from their social surroundings—how much disagreement they encounter, and whether that disagreement makes politics feel consequential or confusing (Wong et al., Reference Wong, Bowers, Rubenson, Fredrickson and Rundlett2025). Two mechanisms connect ideological heterogeneity to participation. First, exposure to meaningful disagreement can sharpen group-based distinctions and make political choices feel more consequential, increasing engagement. Second, high levels of disagreement can overwhelm voters with competing signals, generating ambiguity and discouraging participation, particularly among less politically sophisticated individuals.
These mechanisms imply a curvilinear relationship between ideological heterogeneity and turnout. Moderate levels of heterogeneity can increase participation by signaling meaningful disagreement and clarifying group-based distinctions that motivate engagement (Klar and Krupnikov, Reference Klar and Krupnikov2016; Mutz, Reference Mutz2002a), whereas high levels of disagreement may have demobilizing effects by increasing psychological ambiguity (Enders and Armaly, Reference Enders and Armaly2019). Participation is therefore highest at intermediate levels of heterogeneity, where disagreement is salient but not overwhelming. Moreover, work by (Mutz, Reference Mutz2002b) shows that high levels of political contention in one’s social network may depress turnout out of fear of harming social relationships. As such, very high levels of ideological heterogeneity might be expected to decrease turnout. The key point is that ideological heterogeneity affects participation through exposure to disagreement in daily life, not through strategic electoral incentives.
This curvilinear expectation contrasts with previous work by (Campbell, Reference Campbell2006), which suggests turnout is highest in districts with either very high or very low levels of political homogeneity—high in homogeneous districts due to civic duty, and high in heterogeneous districts due to social conflict. Yet Campbell’s measure of political homogeneity relies on vote margins, conflating the diversity of preferences with the competitiveness of an election. We examine these separately and are therefore able to assess the association between ideological diversity and turnout net of electoral competition at both the individual and district level.
It is also important to distinguish voting from broader civic participation. The existing literature on contextual heterogeneity focuses principally on group membership or volunteering (Adams and Merrill III, Reference Adams and Merrill2003; Adams et al., Reference Adams, Brunell, Grofman and Samuel Merrill2010; Costa and Kahn, Reference Costa and Kahn2003). Voting in single-member district plurality systems is a particularly zero-sum activity: votes for losing candidates are “wasted,” the incentive to free-ride is strong, and the social benefits of a single vote may be lower than for other forms of participation (Dawes et al., Reference Dawes, Settle, Loewen, McGue and Iacono2015). The association between community heterogeneity and turnout may therefore differ from its association with civic participation more broadly.
We also distinguish ideological heterogeneity from electoral competitiveness, while acknowledging they are empirically related. Our data suggest that more ideologically heterogeneous districts do tend to be more competitive: Figure 1, using data from the 2015 Canadian federal election, shows that the margin of victory is largest in ideologically homogeneous districts and declines as ideological heterogeneity increases.
Ideological Heterogeneity and Electoral Competitiveness.
Note: Ideological heterogeneity is associated with more competitive elections, reflected in smaller winning margins between the first and second place candidates. Winner’s margin of victory, Canadian 2015 general election (Elections Canada). Ideological variance weighted and rescaled to 0–1.

The bivariate correlation between the district-level margin and turnout in 2015 is just r = −0.01, p = 0.87, suggesting that competitiveness alone does not drive participation.Footnote 8 Moreover, the experience of contention is not only or even principally a function of party campaigning and mobilization. Many individuals talk to others during campaigns (Campus et al., Reference Campus, Pasquino and Vaccari2008; Mutz, Reference Mutz2002b; Schmitt-Beck, Reference Schmitt-Beck2003), observe lawn signs proclaiming support for one candidate over another (Green et al., Reference Green, Krasno, Coppock, Farrer, Lenoir and Zingher2016), and may consume local media covering the race, all channels through which they can learn about the heterogeneity of views within their constituency (Carty, Reference Carty1991; Carty and Eagles, Reference Carty and Eagles1999; Pattie et al., Reference Pattie, Johnston and Fieldhouse1995). Accordingly, we should expect ideological heterogeneity to be associated with turnout net of party mobilization efforts.
Finally, we operationalize individual ideological distance as the average absolute deviation of a respondent’s issue positions from their district mean across 37 policy domains, using expressed preferences rather than coarse self-identification (Converse, Reference Converse and David1964; Yeung and Quek, Reference Yeung and Quek2025). This measure captures relative ideological positioning within a local context, and is conceptually distinct from polarization: an individual may hold moderate views but be highly misaligned with their district, or hold extreme views that match local opinion. We describe the construction in detail below.
At the individual level, we expect turnout to be highest at intermediate distances from the district mean. When a voter’s issue positions are very similar to those of the mean position of the district, they encounter little disagreement, and politics feels settled rather than consequential. When an individual’s distance to the mean is very large, the voter is immersed in disagreement, which generates ambiguity and can make political expression socially costly. Turnout should, therefore, be highest at some middle position, where disagreement is salient enough to make political differences feel meaningful but not overwhelming. At the district level, we operationalize ideological heterogeneity as the average within-district standard deviation across 37 issue positions, rescaled to range between 0 and 1. When dispersion is very low, voters encounter few competing signals and little of the disagreement that makes political differences feel consequential. When ideological heterogeneity is very high, voters face competing signals from many directions, generating ambiguity that discourages participation. Thus, similar to situations of low heterogeneity, turnout will be lower compared to districts with moderate levels of ideological diversity, where disagreement is salient but not overwhelming, and where we expect turnout to be highest.
Data and Methods
In order to estimate the association between ideological heterogeneity and voter turnout in the 2015 Canadian election, we rely on data from the Local Parliament Project (LPP). The LPP is a large-scale national survey fielded during the 2015 Canadian federal election, with 31,246 completed responses for all relevant variables (see Appendix C for details; see also Stevens et al. (Reference Stevens, Islam, de Geus, Goldberg, McAndrews, Mierke-Zatwarnicki, Loewen and Rubenson2019) for a description of the study design). The study was conducted online, with an average of 579 respondents per day over the course of 54 days of the campaign. Respondents were provided by a leading online sampling firm. The sample was designed to be nationally representative over a three-day window.Footnote 9 We exclude the northern territories from both the individual-level and district-level models due to limited sample availability. Thus, the district-level sample includes 335 rather than 338 districts.
The analyses presented below are weighted to reflect the adult Canadian population in terms of age, gender, education, province, language, and turnout in the 2015 federal election. To ensure comparability across specifications, we estimate all models on a common sample, restricting the analysis to observations with complete data on all variables included in the multivariate models.Footnote 10
We present both individual and district level models to test our argument. This allows us to examine the association between ideological distance and an individual’s decision to vote, as well as the aggregate relationship between ideological heterogeneity and turnout at the district level.
Dependent variables
For the individual-level model, our main dependent variable is the likelihood of voting. We measure this using an intention-to-vote variable that ranges from 0 to 3, where 0 = certain not to vote, 1 = unlikely to vote, 2 = likely to vote, and 3 = certain to vote. We recode this variable into a binary measure, with 0 and 1 coded as 0 (unlikely to vote) and 2 and 3 coded as 1 (likely to vote).
Although self-reported turnout measures are known to overstate participation, prior research shows that models predicting vote intention and validated turnout return similar results when estimated as a function of political predispositions (Achen and Blais, Reference Achen and Blais2010). More broadly, overreporting in survey-based turnout measures tends to reflect systematic response patterns rather than random error and does not necessarily bias estimated relationships (Dahlgaard et al., Reference Dahlgaard, Hansen, Hansen and Bhatti2019; McAllister and Quinlan, Reference McAllister and Quinlan2022; Sciarini and Goldberg, Reference Sciarini and Goldberg2016).
As a robustness check, we also estimate a more conservative specification in which only respondents who report being “certain to vote” are coded as 1 and all others as 0. We further estimate models using the original four-category measure.Footnote 11
For the district-level model, our main dependent variable is official turnout, as provided by Elections Canada.Footnote 12 This is a continuous variable that reflects the turnout percentage within a particular electoral district. Unlike the individual-level model, which relies on self-reported vote intention, the district-level model uses actual turnout rates drawn from official electoral records, avoiding the overreporting bias associated with survey-based measures (Dahlgaard et al., Reference Dahlgaard, Hansen, Hansen and Bhatti2019; McAllister and Quinlan, Reference McAllister and Quinlan2022; Sciarini and Goldberg, Reference Sciarini and Goldberg2016).
Individual level measure of ideological distance
Individual-level ideological distance and district-level ideological heterogeneity capture distinct aspects of the ideological environment and are treated as separate quantities throughout. Our main independent variable at the individual level is the ideological distance between a voter and the average ideological position of their district, a measure that captures how far a specific individual deviates from the prevailing ideological profile of their local context. An individual may thus find themselves ideologically isolated even in an otherwise relatively homogeneous district, and this individual-level positioning need not coincide with the degree of overall heterogeneity in the district.
To obtain this measure, we calculate the absolute distance between an individual’s position on issue X and the average position on issue X within a district. We repeat this process for all 37 randomly presented issues in our dataset.Footnote 13 We then compute the average absolute distance of each individual from the district mean across all issues. This measure captures the extent to which an individual’s issue positions diverge from their district’s average issue positions across all 37 domains. It is recoded to range between 0 and 1, where 0 reflects an individual whose issue positions coincide with the district average across all issues and 1 reflects an individual whose positions are maximally distant from the district average.
A key advantage of this approach is that aggregating across multiple issue domains produces more stable and constrained estimates of ideological structure than single-item self-placement. Issue positions often vary across domains, such that single-item summaries can mask meaningful differences in political preferences, and ideological labels themselves are interpreted inconsistently by respondents, particularly in multiparty contexts (Ansolabehere et al., Reference Ansolabehere, Rodden and Snyder2008; Dufresne and Ouellet, Reference Dufresne and Ouellet2021; Yeung and Quek, Reference Yeung and Quek2025). This is especially important in our setting, where the goal is to capture dispersion in issue positions rather than average left-right placement. Consistent with our theoretical expectations, we expect turnout to be highest at moderate levels of ideological distance from the district mean, reflecting the curvilinear association we theorize between ideological heterogeneity and participation.
For the baseline specification, we impute “don’t know” and “neither” responses to the midpoint of the scale. We also consider alternative imputation strategies, including (i) a riding-mean imputation approach, in which missing responses are replaced with the average response for that issue within the respondent’s riding, and (ii) an available-items approach, in which ideological distance is computed by averaging across all non-missing issue responses for each respondent. Details and results for these alternative approaches are reported in Appendix I.
As a second measure, we generate a salience-weighted index to account for the fact that some issues hold more importance for voters than others. To construct this measure, we proceed in two steps. First, each issue in the LPP dataset includes a measure of issue importance to the respondent. This is a four-category measure: most important, somewhat important, not important, and do not know. We code these responses as 0 for not important and do not know, 0.5 for somewhat important, and 1 for most important. Second, we weight each issue by this scalar and then follow the same measurement strategy described above. Because our theoretical focus is on positional divergence relative to constituency benchmarks, rather than variation in issue salience, we treat the unweighted measure as our baseline specification and present the salience-weighted results as robustness checks.
District level measure of ideological heterogeneity
Our main independent variable for the district-level model is a measure of ideological dispersion within each district, computed as the average standard deviation across 37 issue positions. To create this measure, we first compute the mean position on issue X within a district, and then calculate the standard deviation around that mean. We do this for all 37 issue positions and then calculate the average standard deviation across all issues within a district. The resulting measure captures the average variation in opinions across all issue positions within a district. This variable is recoded to range between 0 and 1, where 0 reflects low dispersion across issue positions within a district (that is, maximum agreement on issues) and 1 reflects high levels of dispersion across issue positions within a district (that is, maximum disagreement), with higher values indicating greater ideological heterogeneity within a district. Consistent with our theoretical expectations, we expect turnout to be highest in districts with moderate levels of ideological heterogeneity.
As a robustness check, we also construct a salience-weighted measure of ideological heterogeneity for the district-level model following the same steps described above, except that each issue position is multiplied by a weight of 0 for not important and do not know, 0.5 for somewhat important, and 1 for most important, based on the corresponding issue salience measure.Footnote 14
Results
Voter awareness of district ideological composition
As a first step, we examine whether voters can infer the ideological composition of their district. Figure 2 shows that the ideological position of a district is closely associated with respondents’ expectations about which party is most likely to win. These correlations are in the expected direction: voters predict higher vote shares for the Conservative Party in more right-leaning districts and higher vote shares for the Liberal and NDP parties in more left-leaning districts. While this does not provide conclusive evidence that voters know the exact ideological distribution of their district, it suggests that their perceptions are systematically related to it. Consistent with this, respondents’ expectations are positively correlated with actual vote shares.Footnote 15 In short, voters seem to be aware of the ideological make up of their riding and its implications. This is in line with findings in the US by (Baybeck and McClurg, Reference Baybeck and McClurg2005).
Voters’ Predictions of Each Party’s Chances of Winning their District are Correlated with the Average Ideological Position in the Riding.
Note: Each panel shows respondents’ predicted probability that a party will win their electoral district against the average left–right ideological position of the riding. Points represent individual respondents. Solid lines show fitted linear trends and shaded areas represent 95 per cent confidence intervals. Predictions are normalized to sum to 100 per cent across parties. Estimates are weighted to reflect the adult Canadian population by age, gender, education, province, language and turnout in the 2015 federal election. The correlation coefficient reported in each panel measures the association between riding ideology and respondents’ predicted probability that the party will win the district.

Individual-level results
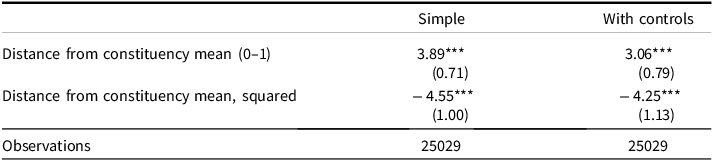
Our next step is to explore whether district-level heterogeneity is associated with voter turnout. We present both individual-level and aggregate-level models. We estimate logistic regression models of the association between an individual’s ideological distance from the district mean and their likelihood of voting. Table 1 and Figure 3 present the individual-level results: the table reports log-odds coefficients, and the figure shows predicted probabilities of voting based on the same model. The dependent variable equals 0 if a respondent is certain not to vote or unlikely to vote, and 1 if the respondent is likely to vote or certain to vote.Footnote 16 Because we expect a curvilinear association, we include a squared term.
The association between Ideological Distance and Individual Turnout

Table 1. Long description
A table with two columns and three rows comparing the distance from constituency mean and its squared value with and without controls. The columns are labeled ‘Simple’ and ‘With controls’. The rows are labeled ‘Distance from constituency mean (0-1)’, ‘Distance from constituency mean, squared’, and ‘Observations’. Row 1: Simple, 3.89*** (0.71); With controls, 3.06*** (0.79). Row 2: Simple, -4.55*** (1.00); With controls, -4.25*** (1.13). Row 3: Simple, 25029; With controls, 25029.
Notes: Logistic regression estimates of the association between ideological distance from the constituency mean and individual turnout (standard errors in parentheses). Distance from constituency measures the absolute ideological distance between a voter and the mean ideological position of a district. This variable is recoded to range between 0–1, whereby 0 reflects an individual whose issue opinions are exactly the same as the average opinion on every issue within the district and 1 reflects an individual whose opinions across all issues are maximally different from the average opinion within the district. Distance from constituency, squared captures potential non-linear (curvilinear) effects of ideological distance. Column 1 reports the bivariate association, while Column 2 includes demographic, political, and regional controls. Reference region is Ontario/Other. Estimates are weighted to reflect the adult Canadian population in terms of age, gender, education, province, language and turnout for the 2015 federal election. ***p < 0.001.
Individual Level Turnout is Correlated with Distance from the Constituency Mean Ideological Position.
Notes: Each point represents the predicted probability of voting for an individual respondent based on the controlled logistic regression model. The horizontal axis measures the respondent’s ideological distance from the constituency mean (0–1 scale), where 0 indicates an individual whose issue opinions are exactly the same as the average opinion on every issue within the district and 1 reflects an individual whose opinions across all issues are maximally different from the average opinion within the district. The solid line represents the fitted quadratic relationship between ideological distance and predicted turnout, and the shaded area shows the 95 per cent confidence interval. Predictions are based on the controlled model including demographic, political, and regional covariates. Estimates are weighted to reflect the adult Canadian population in terms of age, gender, education, province, language, and turnout for the 2015 federal election.

We control for a standard set of demographic characteristics known to affect turnout, including gender, age, income, education, and prior turnout.Footnote 17 We also include a measure of district competitiveness, defined as the margin of victory of the winning party (the difference between the winning party’s vote share and that of the second-place party), and control for region.Footnote 18 Finally, we control for the number of times a voter was contacted by a party, measured as the number of different modes of contact (for example, email, phone, pamphlet/door hanger, in person, social media) reported by respondents. We use this as a proxy for campaign intensity.
The observed association between ideological heterogeneity and turnout may also reflect underlying social or demographic diversity, since characteristics such as ethnicity, language, income, and education shape both political preferences and participation (Blais, Reference Blais2000; Leighley and Nagler, Reference Leighley and Nagler2013; Verba et al., Reference Verba, Schlozman and Brady1995). Our main specification addresses this by including a broad set of individual-level demographic and political controls, along with district-level controls for electoral competitiveness and region. We also test the robustness of our findings, including controls for nativity and language, in the extensions and robustness checks.
Figure 3 presents predicted probabilities of voting based on the estimates from Table 1, column 2. The results are consistent with a significant curvilinear association between an individual’s ideological distance from the district mean and their likelihood of voting. As shown in Figure 3, individuals whose opinions closely match the district average (distance from district mean = 0) and those whose opinions are very different from it (distance from district mean = 1) are less likely to vote than those at moderate levels of ideological distance.
Substantively, an individual who holds opinions that are very similar to the average opinion in their district has a predicted probability of voting of 83 per cent (95% CI: 79–86), while an individual at the opposite extreme has a predicted probability of 63 per cent (45–80). In contrast, individuals at the midpoint of the ideological distance scale have the highest predicted probability of voting, at 90 per cent (89–91). These individual-level associations hold net of district competitiveness and campaign mobilization, suggesting that this relationship is distinct from the effects of electoral competition.Footnote 19
District-level results
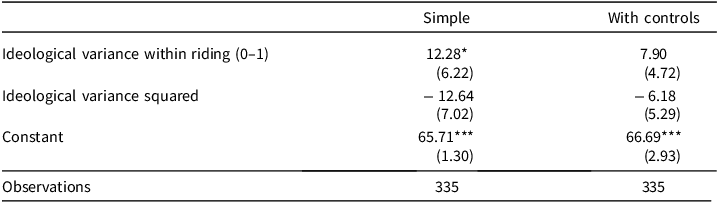
In addition to the individual-level model, we estimate an aggregate model in Table 2 and Figure 4. The dependent variable is district-level turnout from official electoral records. Because the dependent variable is continuous, we estimate ordinary least squares (OLS) regression models.
The Association between Ideological Heterogeneity and Aggregate Turnout

Table 2. Long description
A table with two columns labeled Simple and With controls, and four rows labeled Ideological variance within riding (0-1), Ideological variance squared, Constant, and Observations. Row 1: Ideological variance within riding (0-1), Simple: 12.28 (6.22), With controls: 7.90 (4.72). Row 2: Ideological variance squared, Simple: -12.64 (7.02), With controls: -6.18 (5.29). Row 3: Constant, Simple: 65.71 (1.30), With controls: 66.69 (2.93). Row 4: Observations, Simple: 335, With controls: 335.
Standard errors in parentheses
Reference region is Ontario.
*p < 0.05, ***p < 0.001
District Level Turnout is Correlated with Variation in the Average Ideological Opinion in the District.

The main independent variable is ideological variance within a district. This variable ranges from 0 to 1, where higher values indicate greater ideological diversity and lower values indicate greater ideological homogeneity. We control for district-level factors that may affect turnout, including the winning party’s margin in 2011, district population size, the percentage of immigrants, mean family income, the unemployment rate, and region. Finally, we control for campaign spending, measured as the average total spending reported to Elections Canada by the Conservative, Liberal, and NDP candidates in the district as a share of the total allowable campaign spending limit.
The aggregate-level results are directionally consistent with the individual-level findings, but they provide only suggestive evidence of a curvilinear relationship between ideological heterogeneity and turnout. As shown in Figure 4, predicted turnout is 65.7 per cent (95% CI: 63.2–68.3) when heterogeneity equals 0, rises to 68.7 per cent (95% CI: 68.0–69.4) at the midpoint, and then declines to 65.3 per cent (95% CI: 60.6–70.0) when heterogeneity reaches its maximum.Footnote 20 This pattern is consistent with an inverted-U relationship. However, the coefficients in Table 2 are not statistically significant once controls are included, and therefore do not provide strong evidence of curvilinearity at the aggregate level.
Does district context shape the individual-level association?
The individual- and district-level analyses presented above examine ideological heterogeneity at two levels separately. A natural question is whether the two levels interact: does the curvilinear association between an individual’s ideological distance and their turnout depend on the ideological composition of the district in which they live?
This question matters because, absent such a test, the individual-level results are consistent with a simpler account in which ideological distance reflects an individual trait—such as general political disengagement among those with unusual views—rather than anything about the district environment. If the individual-level association is genuinely contextual, it should vary with district-level heterogeneity. If it is purely an individual-level phenomenon, district context should not matter.
We test this by estimating a multilevel logistic regression with random intercepts at the riding level, adding an interaction between individual ideological distance and district-level ideological variance. This is the appropriate specification for a cross-level interaction, since it explicitly models the nesting of individuals within districts.Footnote 21 The model takes the form:
 $${\rm{logit}}\left( {P\left( {{\rm{vot}}{{\rm{e}}_i}} \right)} \right) = {\beta _0} + {\beta _1}{D_i} + {\beta _2}D_i^2 + {\beta _3}{H_j} + {\beta _4}H_j^2 + {\beta _5}\left( {{D_i} \times {H_j}} \right) + {{\boldsymbol X}_{i}}{\boldsymbol \gamma} + {u_j}$$
where
 ${D_i}$
is individual
 $i$
’s ideological distance from the district mean,
 ${H_j}$
is the ideological variance of district
 $j$
,
 ${{\boldsymbol X}_i}$
is a vector of individual and district controls, and
 ${u_j}$
is a district-level random intercept. The coefficient of interest is
 ${\beta _5}$
, which captures whether the association between individual distance and turnout differs across districts with different levels of ideological heterogeneity.
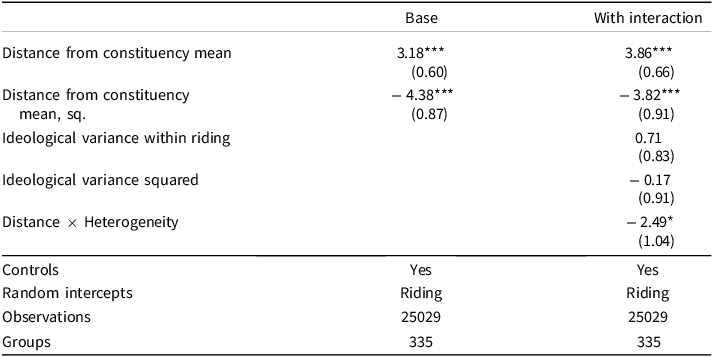
Table 3 reports the results. The interaction term is negative and statistically significant (
 ${\,\hat \beta _5} = - 2.49$
,
 $p = 0.017$
). The main effects of individual distance remain positive and significant, and the squared term remains negative and significant, confirming the inverted-U pattern. The main effect of district-level heterogeneity and its squared term are not significant on their own, consistent with the aggregate results reported in Table 2.
Cross-Level Interaction between Individual Ideological Distance and District Ideological Heterogeneity

Table 3. Long description
The table has two main columns: Base and With interaction, each containing statistical results for various factors. It includes seven rows with the following labels and values: Distance from constituency mean with values 3.18*** (0.60) and 3.86*** (0.66), Distance from constituency mean, sq. with values -4.38*** (0.87) and -3.82*** (0.91), Ideological variance within riding with values 0.71 (0.83) and -0.17 (0.91), Ideological variance squared with no values, Distance × Heterogeneity with no value in Base and -2.49* (1.04) in With interaction, Controls with Yes in both columns, Random intercepts with Riding in both columns, Observations with 25029 in both columns, and Groups with 335 in both columns.
Notes: Multilevel logistic regression estimates with random intercepts at the riding level. Controls include gender, age, age squared, income, education, party contact, prior turnout, winner’s margin of victory (2011) and region. Standard errors in parentheses. *p < 0.05, ***p < 0.001.
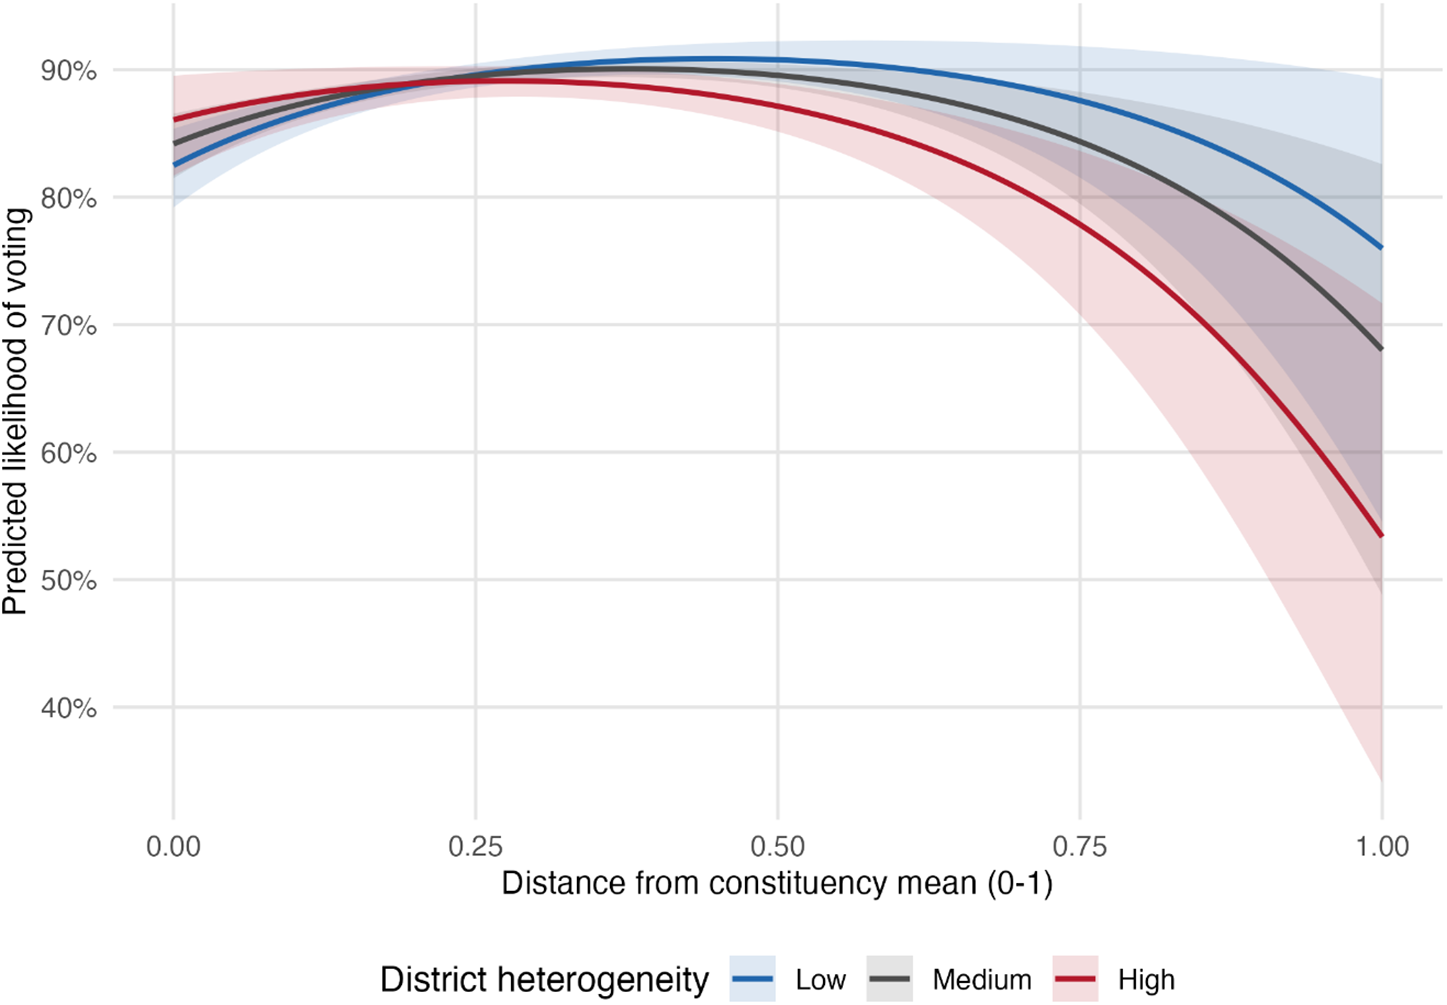
The negative interaction means that the turnout-maximizing level of individual distance is lower in more heterogeneous districts. Put differently, the inverted-U is compressed: its peak shifts leftward, and the decline in turnout at high levels of distance is steeper when the district itself is more ideologically diverse. Figure 5 illustrates this by plotting predicted turnout against individual distance at three levels of district heterogeneity (the bottom, middle, and top thirds of the distribution). In districts with low heterogeneity, the predicted turnout curve is relatively flat—moderate distance from the mean has little effect. In districts with high heterogeneity, the curve is steeper: the turnout benefit of moderate distance is larger, but so is the penalty for being very far from the mean.
The Association between Individual Ideological Distance and Turnout varies by District Heterogeneity.
Notes: Predicted probabilities of voting from the multilevel logistic regression with cross-level interaction (Table 3, column 2). Lines show predicted turnout at the bottom third (low), middle third (medium), and top third (high) of the district-level ideological variance distribution. All other covariates are held at their sample means. Shaded areas indicate 95 per cent confidence intervals.

This result speaks directly to the interpretation of the individual-level findings. If the curvilinear association between distance and turnout were driven entirely by individual characteristics—if people with unusual views were simply less engaged regardless of where they live—there would be no reason for the shape of that association to change across districts. The significant interaction indicates that the same individual, with the same level of ideological distance, has a different probability of voting depending on the ideological composition of their district. The association is contextual.
Extensions and Robustness Checks
We conduct extensive robustness checks, reported in the appendix. The results are robust to: (1) a salience-weighted measure of ideological heterogeneity, with and without raked weights within each riding (Appendix F; Tables F.1, F.2, F.3, F.4; Figures F.1, F.2, F.3); (2) alternative treatments of missing data, including riding-mean imputation and an available-items approach (Appendix I); (3) a domain-balanced measure, exclusion of Quebec-specific items, and restriction to issues asked of all respondents (Table H.7); and (4) a specification curve analysis across alternative combinations of control variables (Appendix G). Salience-weighted and unweighted measures are highly correlated (r = 0.91), and exploratory factor analysis confirms the measure captures broad dispersion rather than a single dominant cluster of items (Table H.8).
We also assess whether the association reflects alternative explanations. When we control for vote heterogeneity (a riding-level fragmentation index based on first-choice party), the curvilinear association between ideological heterogeneity and turnout remains substantively and statistically significant (Table H.5). The correlation between ideological and vote heterogeneity is negligible (r = 0.02). Adding controls for political interest, nativity and language does not change the results (Table H.9). Finally, re-estimating with clustered standard errors at the riding level (Tables H.1, H.2) and with multilevel models (random intercepts at the province and constituency levels; Tables H.3, H.4; Appendix H) yields consistent results.
Conclusion and Discussion
There exists a large literature in political science concerned with the relationship between diversity and participation. Diversity is most often operationalized as ethnic heterogeneity, with an underlying assumption that one mechanism by which diversity affects participation is through ideological differences or differences in policy preferences. It is therefore surprising there is a relative dearth of research on the association between diversity in preferences or ideology and political action. The work that does exist tends to measure ideological heterogeneity using vote shares. We instead rely on opinion data on a large set of policy issues to construct measures of ideological heterogeneity and study its association with turnout.
Using a large data set from the 2015 Canadian federal election, we find a statistically significant curvilinear association between individual ideological distance from the district mean and turnout, with participation peaking at moderate levels of distance and holding net of district competitiveness and party mobilization. The district-level results point in the same direction and benefit from relying on official electoral records, but do not reach conventional levels of statistical significance—unsurprising given only 335 districts. We treat the district-level evidence as suggestive, while noting that the substantive consistency across two levels of analysis and two measurement approaches lends cautious additional credibility. We also find that the individual-level association is not uniform across districts: a cross-level interaction between individual distance and district heterogeneity is statistically significant in a multilevel model, indicating that the shape of the inverted-U varies with district context. The same individual, at the same level of ideological distance, has a different probability of voting depending on the ideological composition of their district. This rules out the interpretation that the individual-level result simply reflects a tendency for people with unusual views to disengage—if that were the case, district context would not matter. These findings suggest that the decision to vote is shaped not only by a voter’s assessment of competitiveness but also by their experience of ideological agreement and disagreement in their community.
This article contributes to a growing literature on the importance of local context to political decision making in geographically-based electoral systems. Although elections are becoming increasingly nationalized (Jacobson, Reference Jacobson2015; Trimble and Sampert, Reference Trimble and Sampert2004), local communities shape citizens’ attitudes and behaviours, and the results we present here are estimated in the presence of those strong national-level effects.
Several limitations point to directions for future research. Our measure of ideological heterogeneity is derived from voters’ stated preferences; it may be voters’ perceptions of heterogeneity that matter more. Recent work distinguishes the objective environment from the subjective context individuals construct, showing that two people in equally diverse communities may perceive very different levels of diversity, with consequences for social cohesion and collective efficacy (Wong et al., Reference Wong, Bowers, Rubenson, Fredrickson and Rundlett2025). The LPP does not include a left–right self-placement item, so future research could replicate this analysis using such a measure. Relatedly, we focus on the electoral district as the relevant geographic community, but the boundaries of the district may not capture an individual’s most relevant political interactions (Wong et al., Reference Wong, Bowers, Rubenson, Fredrickson and Rundlett2020).
Our analysis draws on data from the 2015 Canadian federal election, a highly competitive three-party contest with substantial variation in ideological heterogeneity across districts that is well suited for identifying the curvilinear association we theorize. While we believe the theoretical mechanisms we identify are not specific to this electoral context and are likely to persist across electoral cycles, the recent 2025 Canadian federal election offers an opportunity to assess whether our findings replicate in a more recent and potentially more polarized setting. Our findings are also rooted in a single-member district plurality system, where the logic of wasted votes and ideological coordination is particularly salient. Whether similar patterns would emerge in proportional representation systems, where votes are rarely wasted in the same sense and the incentive structure facing voters is fundamentally different, remains an open and important question. Extending this line of inquiry to comparative electoral settings would be a natural next step.
While these remain open questions, the findings presented here show that ideological diversity is associated with voter turnout in ways that existing work has not documented. At the individual level, the ideological composition of local communities is associated with whether citizens choose to participate, and this association holds independently of electoral competitiveness and campaign mobilization. The cross-level interaction confirms that this is a genuinely contextual association: the relationship between a voter’s ideological position and their turnout depends on the district they live in, not just on their own characteristics.
Supplementary material
The supplementary material for this article can be found at https://doi.org/10.1017/S0008423926101462
Acknowledgements
We thank John McAndrews, members of the Policy, Elections, and Representation Lab, and the editor and anonymous reviewers for helpful comments. We gratefully acknowledge support from a SSHRC Insight Grant, which funded the Local Parliament Project.
Competing interests
The authors declare none.






 Open access

