

In every rich democracy in the world, women are underrepresented in political office. Optimists of every generation who expected that gender equality was “just around the corner” have been disappointed. Gender equality is not, apparently, simply a matter of waiting for a new cohort of liberated women to move through the ranks. The pipeline to the top echelons in every field of endeavor seems to leak more women than men.
In this article, we seek to understand low female political representation from both the demand side (voters) and the supply side (candidates). Party leaders who recruit candidates to run for office may or may not have prejudices of their own. We bypass the gatekeeper issue on the grounds that if voters are biased against female politicians, party leaders will avoid recruiting females in the first place to avoid electoral penalty. If citizens prefer male to female representatives for whatever reason, party leaders’ hands may be tied: they will be forced to cater to bias. On the other hand, as we argue here, party leaders will find it harder to achieve gender equality if women are reluctant to put themselves forward as candidates.
To understand voters’ views of female candidates as well as women's willingness to run for public office, we employed three original survey experiments and one existing survey in Japan. In the first conjoint survey experiment, designed to gauge attitudes toward women in politics, we found no systematic gender bias even in Japan, where every indicator points to significant gender inequality. In the second, to corroborate the conjoint experiment, we used a measure of attitudes toward competence and indeed found that Japanese voters do not view females as being less capable than men.
Next, to examine the candidacy self-selection process in politics, we employed one existing survey about candidates for national elections and one original survey experiment. In the existing survey, we found that not all women are equally unlikely to run for office, but some groups of women are disproportionately less likely to run for national elections. The results suggest that women choose not to run for office largely on account of socially mandated responsibilities for child care and household work. To confirm this interpretation, we conducted an original survey experiment and found that, compared with men, women are more likely to run for office when they receive substantial support for family work.
The severity of Japan's female underrepresentation makes it a particularly useful window through which to probe the causes of gender inequality elsewhere. Female politicians accounted for about 12.6% of all elected national lawmakers in late 2016, the second-lowest share among OECD countries after Turkey (Inter-Parliamentary Union n.d.). Only 44 of 475 members of the House of Representatives (lower house) were women, or 9.4%. This put Japan at 164th out of 193 countries and well behind all other developed countries, including other laggards such as Turkey (131st), Chile (128th), and South Korea (116th). In the House of Councillors (upper house), the percentage of women was slightly higher, at 20.7%, but according to Takazawa (Reference Takazawa2015), this placed Japan only 17th out of 19 among second houses of bicameral legislatures. Unlike many democracies, Japan also lacks statutory candidate gender quotas.Footnote 1
This article's contributions are twofold. First, our study of the underexamined case of Japan deepens our understanding of what may promote or hinder gender equality in politics. In particular, our finding that voters have little bias against female candidates is consistent with recent studies elsewhere (Dolan Reference Dolan2014; Hayes and Lawless Reference Hayes and Lawless2016; Teele, Kalla, and Rosenbluth n.d.), but it is even more significant because Japan manages to have one of the worst records of female underrepresentation without voter bias. The finding is also important because of evidence that quotas help voters view women as suited to govern (Besley et al. Reference Besley, Folke, Persson and Rickne2017; McDonagh Reference McDonagh2009). Because Japanese voters seem not to have gender bias even without gender quotas, we focus more on supply-side dynamics. Moreover, Japan is a less polarized polity than the United States, where most studies of voter bias have been conducted. The weak effect of gender on vote choice in the United States could be an artifact of partisan polarization that dampens the importance of other variables such as candidate gender (Dolan Reference Dolan2014). If gender has a weak effect on vote choice in Japan as well, we have greater confidence that we are capturing gender attitudes rather than partisanship.
Second, this study has important policy implications. If it is true that supply-side factors better account for female political underrepresentation, then emphasis should be on fielding more female candidates. But the article also highlights the challenges of recruiting more women. As long as women's and men's notions about the appropriate division of household work do not change, women know that they face formidable obstacles, discouraging all but the most intrepid. This is consistent with findings that female politicians feel that they have to be better than their male counterparts (Fox and Lawless Reference Fox and Lawless2005) and that perhaps many are (Anzia and Berry Reference Anzia and Berry2011; Besley et al. Reference Besley, Folke, Persson and Rickne2017).Footnote 2
If, on top of female reticence to run for office, gatekeepers also hinder female recruitment, gaining representational equality for women is a daunting prospect (see, e.g., Bjarnegård and Kenny Reference Bjarnegård and Kenny2016; Fox and Lawless Reference Fox and Lawless2010; Niven Reference Niven1998, Reference Niven2006; Sanbonmatsu Reference Sanbonmatsu2006). Quotas can bypass recruitment bias, but incumbents may have an incentive to resist the introduction of gender quotas in the first place (Krook and Zetterberg Reference Krook and Zetterberg2014). Therefore, future comparative studies should seek to understand the full range of impediments that female candidates face and how best to address those impediments.
ARGUMENT
Culture—the accumulated social values and practices by which a society understands and orders itself—is an undeniably powerful force in human affairs. Travelers intuitively grasp the importance of the “choreography” of culture when they enter a new country and ignore at their peril a vast array of unspoken rules about proper decorum. In some societies, for example, the free expression of opinions is honored; in others, it is taken as a sign of poor manners and low breeding. Social mores, it is clear to any keen observer, vary along an astonishing range of dimensions.
Like every other component of culture, attitudes toward women vary considerably across countries, but they are consistent in one respect: the status of women is lower than that of men in virtually every country in the world. We take this as a clue that gender attitudes are not constructed within each society out of its own thin air but are anchored in some common aspects of modern human life.
To develop our theoretical argument, we draw on the literature on gender bias in the workplace. A growing body of scholarship has found that gender equality tracks the demand for female labor in the workforce. Mincer and Polachek (Reference Mincer and Polachek1974) and Becker (Reference Becker1991) show theoretically that female wages should be lower as long as males are more likely to invest in marketable human capital. Lundberg and Pollak (Reference Lundberg and Pollak1996) argue that female bargaining power in the home is higher when women have outside income. In their extensive empirical work, Goldin (Reference Goldin1990, Reference Goldin1991, Reference Goldin2014) and Bertrand, Goldin, and Katz (Reference Bertrand, Goldin and Katz2010) demonstrate empirically that the gender wage gap is smallest in professions in which one person is substitutable for another (such as medical group practices), making it possible for women to tailor their working hours to suit their preferences for family-career balance. Iversen and Rosenbluth (Reference Iversen and Rosenbluth2006, Reference Iversen and Rosenbluth2010) find that gender equality, even within the same country, differs from one sector to another depending on the costs to the firm (or to voters) of career interruption for family work. These findings, taken together, point to the conclusion that, as the adage goes, “time is money.” As long as females bear a disproportionate share of child-rearing and elder care, and in fields in which continuous availability for work contributes to the development of valued human capital, women will lag men in career advancement.
The massive technological transition from Fordism to a knowledge-based economy in recent decades should help women by putting a premium on general skills that are mobile across firms, untethering worker productivity from years of acquiring firm-specific human capital (Iversen and Soskice Reference Iversen and Soskice2015). Still, time is money at the high end of the service economy. Client-based work in the service sector often requires around-the-clock availability, and acquiring a client or constituency network, in business or in politics, often requires early years of career investment that typically coincide with the reproductive years. Even more perniciously for women, the difficulty of measuring productivity in the knowledge economy—which often relies on teamwork—induces firms to proxy employee productivity with hours spent on the job, however unreliable a measure that may be.
If these studies are right, relevant variation in labor markets should be associated with different outcomes for women. We should find fewer women in professions that require large time commitments during childbearing years.
These insights can be applied to female political underrepresentation. First, on the demand side, voters may underappreciate female politicians if they perceive politics as being time-intensive work—politicians have to work around-the-clock to attend plenary and committee meetings, meet constituencies and bureaucrats, build strong political machines, and run electoral campaigns, for example. If voters believe that women cannot, or should not, work as much as men because of family obligations, voters will punish female candidates, in particular those with young children, more than male politicians. In other words, voters-as-employers may be less willing to “invest” in female politicians if they believe that they will get less work out of female politicians than male politicians. Indeed, studies have uncovered evidence of voter bias against female politicians in many countries (Fox and Smith Reference Fox and Smith1998; Inglehart and Norris Reference Inglehart and Norris2003; Paxton and Kunovich Reference Paxton and Kunovich2003; Sanbonmatsu Reference Sanbonmatsu2002), although the empirical evidence as to the extent to which this bias impacts actual vote choice has been mixed (Lawless and Pearson Reference Lawless and Pearson2008).
Scholars have found mixed evidence of voter bias against female candidates in the Japanese context as well. Kawato (Reference Kawato, Kawato and Yamamoto2007a) and Ono and Yamada (Reference Ono and Yamada2016) find that voter bias among Japanese voters indeed exists, while Takeyasu (Reference Takeyasu2002) and Aiuchi (Reference Aiuchi, Kawato and Yamamoto2007) fail to uncover systematic bias against female politicians among Japanese voters.
By contrast, a growing body of studies have found that it is not voter bias that deters female representation in politics but rather that women are less likely to run for office in the first place—precisely because time is money. From this perspective, the roots of female political underrepresentation are to be found in the supply side rather than the demand side. Studies have pointed to the more limited supply of qualified female candidates, specifically better-educated professional women compared with men in most countries, to explain why fewer women than men run for office (Kenworthy and Malami Reference Kenworthy and Malami1999; Matland Reference Matland1998; Rule Reference Rule1981).Footnote 3 But more recent studies have noted that a growing pool of better-educated professional women is not sufficient for women to run for office in large numbers because, in many countries, women bear the brunt of the responsibility for child-rearing and housework (Lawless and Fox Reference Lawless and Fox2005; Silbermann Reference Silbermann2015).Footnote 4 If women know that they will not be able to put in as many hours as a male politician because of their obligations at home, they may choose not to enter politics in the first place. If women are more concerned about family obligations than men, we should observe, on average, fewer women than men in politics. Furthermore, as a result of temporal variation in childbirth and child-rearing, we should see fewer female politicians entering politics around reproductive age.
Studies of female underrepresentation in Japan have also pointed to the importance of supply-side factors. Drawing on mass survey data of individuals’ willingness to run for office, Masuyama (Reference Masuyama, Kawato and Yamamoto2007) argues that while more education strengthens respondents’ willingness to run, the effect is weaker among women than among men. Tsuji (Reference Tsuji2017) concurs on the importance of education and argues that the increase in the supply of “qualified” female candidates in recent decades has contributed to the increase in female mayors in Japan (see also Ogai Reference Ogai2001). Takeyasu (Reference Takeyasu2002) finds that internalized social norms as well as expectations from family members and the local community present substantial obstacles for women to run for office. While Takeyasu examined the impediments that discouraged women from running for office at the local level, her findings are likely to be relevant to the national level as well (see Eto Reference Eto2010; Miura Reference Miura and Miura2016).
EMPIRICAL STRATEGY
Our empirical strategy entails two steps, which we summarize here before explaining it in greater detail in the following sections. First, to ascertain whether voters in Japan harbor gender bias (which we are calling the demand side, hereafter Study 1), we employed two survey experiments designed to avoid social desirability bias, which would give us false results. A conjoint survey asked respondents to choose a preferred candidate from a series of pairs with randomly scrambled attributes (Survey 1); another survey experiment, which complements Survey 1, examined people's perceptions of female and male capabilities (Survey 2).
To investigate possible supply-side gender selection bias (we call this Study 2), we analyzed a publicly available survey of all candidates in general elections (Survey 3). To corroborate the mechanism through which women self-select out of politics, we conducted an additional survey experiment randomizing different incentives and constraints affecting people's willingness to run for office (Survey 4).
STUDY 1: DEMAND-SIDE GENDER BIAS
Survey 1: Conjoint Analysis
Our two-wave survey embedded with a conjoint experiment captured a nationally representative sample of 1,611 Japanese adults between January and March 2015.Footnote 5 The first wave of the survey consisted of basic demographic questions and key covariates, including general attitudes toward women and other relevant measures such as personality traits and social dominance orientation. After a two-week period, we reinterviewed the same respondents in the second wave, which included the conjoint survey.
In the second wave, each survey respondent was asked to choose between pairs of hypothetical politicians with a randomized combination of attributes along the dimensions of gender, age, education, and other relevant information.Footnote 6 By examining these responses, we are able to gauge the extent and shape of biases against particular attributes or combinations of attributes. The 1,611 respondents were asked to perform the conjoint exercise six times for two profiles, for a total of 19,332 observations (each scenario consists of 9,666 observations). All respondents were shown the scenarios in the same order.
Respondents were asked to choose which of the two candidates they would personally prefer to see elected as a member of the House of RepresentativesFootnote 7 and which of the two politicians they would personally prefer to see promoted as the Liberal Democratic Party (LDP) leader (see O'Brien Reference O'Brien2015). Since the LDP was the incumbent political party in Japan's parliamentary system at the time of the survey, the question wording for the second scenario meant that respondents were indirectly being asked to choose the prime minister.
We selected attributes that are relevant to each survey task. For the “Elect a Politician” scenario, we laid out nine dimensions: gender, political party, consumption tax policy, priority area in policy, age, prior experience, education level, number of children, and marital status. For the “Promoting a Politician” scenario, we chose six dimensions: gender, age, prior experience, education level, number of children, and marital status.
For example, the “Political Party” attribute of the first scenario can take one of five values: LDP, Democratic Party of Japan (DPJ), Komeito, Japanese Communist Party, or Restoration Party (Ishin no To). For each profile, the two politicians’ profiles varied both within and across the binary comparisons. We also randomized the order of the attributes presented to respondents in a given comparison so as not to affect respondents’ choices. (For attributes, see Tables B and C in the supplementary appendix in the online version of this article).
The forced-choice design allows us to isolate respondents’ calculations while controlling for respondents’ overall attitudes about politics. We construct the binary response variable Person Preferred as our dependent variable and code it 1 if a respondent chose the politician and 0 otherwise. Our primary substantive focus is to estimate the average marginal component effect (AMCE) of a change in values of the attributes on the probability that the person is chosen by the respondent (Hainmueller, Hopkins, and Yamamoto Reference Hainmueller, Hopkins and Yamamoto2014). Under the conditional independent randomization of attribute values, the AMCE can be estimated using a linear regression model. We regress the Person Preferred variable on a set of dummy variables flagging each value. The coefficient for each variable can be interpreted as the average change in the probability that a respondent will choose the profile when it includes the attribute value relative to the baseline attribute value. We report standard errors for these estimates clustered by respondents to account for within-respondent correlations in responses.
This experimental design allows us to isolate which attributes respondents deem most important for political office. We are also able to avoid selection effects on the women who choose to run for office, since some attributes may be rarely observed in practice. For example, women with preschool-age children may be judged unfit for political office. In the political world, women candidates potentially face a triple whammy: having young children makes them less available for around-the-clock political activities, but not having a family may make them socially odd and politically suspect; on top of that, being older (postfamily) comes with the liability of having had less time to build seniority and political clout (Silbermann Reference Silbermann2015). By exploiting family-related attributes, we can measure whether and how Japanese institutions prevent women from working as politicians.
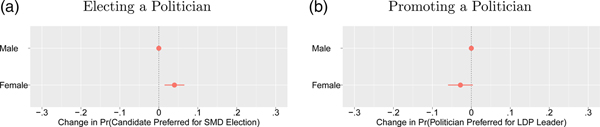
Figure 1 reports the baseline results of both scenarios.Footnote 8 Strikingly for a country with an exceedingly small number of female politicians, Japanese respondents preferred female to male candidates for election to the House of Representatives. In substantive terms, a female politician was 4 percentage points (SE = 0.01) more likely to be preferred as a member of the Diet than the male counterpart.
Baseline Results: Effects of Attributes on Preference for a Politician.
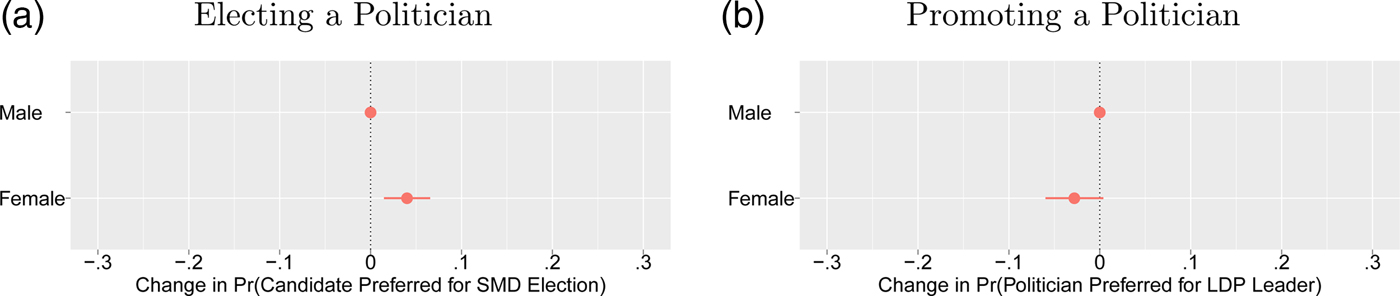
In choosing political leaders, most respondents also viewed women as favorably as men. Male politicians were slightly preferred to their female counterparts, but the difference was not statistically significant at the 10% level.Footnote 9
To further probe whether Japanese voters judge female and male candidates/politicians on a double standard, we interacted a number of attributes with gender to rule out the possibility that some attributes are important only for women. In fact, in the interaction term results for each attribute (see Figure B in the online appendix), we found striking similarities between male and female politicians across most attributes. Factors such as partisanship, policy positions, age, prior experience, and marital status did not systematically disadvantage female relative to male candidates. Female and male respondents also revealed very similar attitudes (not shown).
It is also notable that respondents did not hold women candidates to higher standards relative to their male counterparts. That is, female candidates/politicians did not need to have achieved higher academic qualifications or more extensive political backgrounds than their male counterparts in order to be viewed as being fit for office or promotion.
We found some evidence that respondents preferred a female politician to have older children (over age six) and for her to live in a multigenerational family with built-in child care—belt and suspenders on the home front, perhaps. But this preference was not stable across different combinations of attributes. While a recent study found that American voters prefer candidates who are married and have children (Teele, Kalla, and Rosenbluth Reference Teele, Kalla and Rosenbluthn.d.), Japanese voters exhibited no preference regarding candidates’ marital status or number of children, for female or male candidates. Respondents even seemed to cut females some slack for the special challenges they face balancing family and career, taking away fewer points from women than for men if they were divorced.
As Sanbonmatsu (Reference Sanbonmatsu2002, Reference Sanbonmatsu2004), Carroll and Sanbonmatsu (Reference Carroll and Sanbonmatsu2013), and others have noted in the U.S. context, voters often associate female politicians with women's issues. Over the past few decades, a “gender voting gap” has opened up in rich democracies, whereby females and especially working women are somewhat more likely than males to vote on the left. In the Japanese context as well, some scholars have pointed to a gender gap in support for the LDP (Burden Reference Burden, Reed, McElwain and Shimizu2008). This presumably reflects the importance for working women of social policies such as education and welfare that support family-work balance (Iversen and Rosenbluth Reference Iversen and Rosenbluth2010, 125). Sanbonmatsu (Reference Sanbonmatsu2002, Reference Sanbonmatsu2004) finds that voters with a preference for left-leaning policies tend to prefer female politicians because they believe that women are more likely to support their causes. At least some of our Japanese survey respondents, too, favor female politicians who championed welfare programs, although the difference just misses statistical significance at the 10% level. Self-described liberals are 16.3 percentage points (SE = 0.10) more likely to support a female candidate who embraces social welfare policies than nonliberals, although the difference again misses statistical significance at the 10% level (see Figure C in the online appendix).
The fact that Japanese respondents do not expect female candidates to differ in policy terms from male candidates contrasts with some findings from the United States, where voters may associate female candidates with “women's issues” such as social policy or education and vote accordingly (Dolan Reference Dolan2010; Sanbonmatsu Reference Sanbonmatsu2002). But other studies have argued that while voters may indeed harbor stereotypical views of female and male candidates’ policy strengths, those stereotypes have limited effect on actual voting decisions (Dolan Reference Dolan2014; Hayes Reference Hayes2011). Our study lends support to the latter view, at least in the Japanese context.
To summarize, Survey 1 provides consistent support across the scenarios and model specifications that voters do not discriminate against female politicians even in Japan, suggesting that female underrepresentation does not emanate from the demand side. Particularly notable is that these findings come from a conjoint design, which reduces, if not eliminates, the effect of social desirability bias. Still, to complement Survey 1, we conducted another survey experiment measuring people's implicit underestimation of women's capabilities in a more general setting.
Survey 2: Student Memo Survey
Do Japanese believe that women are less competent than men? If negative gender stereotypes in Japan are pervasive, our earlier voting scenarios could have failed in spite of all efforts to tap this deep-seated source. A survey in Japan found that less than a quarter of respondents thought that female politicians are less competent than their male counterparts (Aiuchi Reference Aiuchi, Kawato and Yamamoto2007). But a large percentage of respondents chose the “DK/NA” option, suggesting that social desirability bias may have been at work. Indeed, the same survey found that almost half of respondents (46.0%) disagreed that women and men are comparable in terms of job competence in any type of job, whether politics or otherwise (Kawato Reference Kawato, Kawato and Yamamoto2007b). But Japanese respondents’ assessments of “competence” may be colored by their expectations that women should assume most of the responsibility for hearth and home. To what extent do Japanese view women's and men's job competence as equal, independently of both social desirability bias and of social expectations of child-rearing?
To examine this question, along the lines of previous studies (Moss-Racusin et al. Reference Moss-Racusin, Dovidio, Brescoll, Graham and Handelsman2012; Reeves Reference Reeves2014), we asked respondents to evaluate a memo written by a hypothetical college graduate seeking a first job. We chose this setting because this is a common and recognizable one for many people in Japanese society. Note that judging the capabilities of a recruit for an entry-level position may be not the same as evaluating politicians who assume greater responsibilities and exercise leadership. Still, if we find gender bias for this entry-level setting, we can consider this as evidence for demand-side-driven female underrepresentation.Footnote 10 By contrast, finding little bias toward women in this setting would complement Survey 1, lending confidence to move on to Study 2's focus on supply-side explanations.
For this experiment, we collected 202 responses from Japanese adult citizens between October 15 and 17, 2014.Footnote 11 Of the respondents, 52% were women, and 48% were men. The respondents’ mean age was in their forties, making them, on average, about 10 years younger than the general Japanese public. However, this is fairly close to the mean age of Japanese workers, which, as of 2013, was 42.8 (Somusho 2015). More importantly, randomization generated balanced control and treatment groups across relevant demographic indicators of age, gender, marital status, children status, education level, and income level (see Table D in the online appendix).
Each respondent was asked to evaluate, on a scale of 1 (very poor) to 4 (very good), a single hypothetical research memo, on which the gender of the hypothetical author was randomly scrambled. Respondents were asked to take the perspective of a hiring official at a major trading firm assessing a memo that had been submitted by a college senior who was applying for an entry-level position with the possibility of future promotion to leadership positions. The student memo was based on a college assignment to discuss how the reunification of Germany impacted the configuration of German environmental policies. The topic itself is not important here; rather, we selected the memo so that it had little content that would lead respondents to suspect that the purpose of the survey was to assess respondents’ gender bias. Further, in order to increase the likelihood of confirmation gender bias, we reversed the original order of the paragraphs (the memo has two paragraphs in total) so that the memo is not well written.Footnote 12 If gender bias exists among the respondents in terms of capability, we expect that they are more likely to punish the female author. By comparing evaluation scores for each hypothetical author, we are able to see whether females are judged more harshly than males. Since all respondents read the same essay, any differences in evaluation can be attributed to gender bias.
To our considerable surprise, female authors were not docked for their gender. On average, the male author received an average assessment of 2.77 points on a four-point scale, and the female counterpart received 2.76 points. We also conducted a bivariate regression with no controls (a t-test) to compare the two groups and confirmed that there was no statistical difference between two groups at the 1% level; this null finding is unlikely to be due to a possible type II error because of the relatively small sample size.Footnote 13
Moreover, the experiment showed that there was no statistically significant difference in the scores given to female and male authors by female or male respondents. It is not the case that male respondents were more biased against female authors while female respondents were not, canceling out the effects in the overall sample. Male respondents were just as likely as female respondents to judge male and female authors evenhandedly.
Of course, these results do not suggest that Japanese people are not biased against women for any type of task. It is possible that the Japanese are not biased against women's abilities to write memos but that they are biased against women's abilities to perform other, more traditionally “masculine” tasks, such as leadership, engineering, or winning client confidence. Nevertheless, because memo writing is a fairly fundamental skill that is correlated with other job-related skills such as communication or the ability to organize complex thoughts (see Kuncel, Hezlett, and Ones Reference Kuncel, Hezlett and Ones2004), it is a reasonable measure of overall competence.
The results also corroborate our finding from Survey 1 that Japanese do not view female candidates to be less competent than their male counterparts. Because Survey 2 was about the evaluation of capabilities of college seniors, the result may not be readily generalizable to politicians.Footnote 14 Still, combined with the findings of Survey 1, this study suggests that most Japanese do not think females are less capable in a general sense than males, indicating that we need other explanations for the female political underrepresentation than deep, internalized sexism.
In summary, gender bias among Japanese voters is remarkably weak. This null result deepens the puzzle: why, then, does Japan observe a dearth of women in office? Where does the empirical gap come from? We turn to that question in the following section.
STUDY 2: SUPPLY-SIDE GENDER BIAS
Survey 3: Candidate Survey
If voters do not discriminate against female politicians, women themselves may be self-selecting out of politics despite a fair chance of winning. This raises the possibility that supply-side rather than demand-side factors account for the small number of female politicians in Japan.
Japan's mixed electoral system, which combines single-member districts (SMDs) and proportional representation (PR), provides a window into the calculus for women in politics. In the Japanese parliamentary system, candidates for the lower house (which we will use for our analysis) are allowed to run for both SMDs (N = 295 as of 2017) and PR (N = 180 as of 2017), while voters cast two votes—one for the SMD tier and the other for the PR tier. More specifically, the electoral system allows us to take advantage of variation in the number of candidates across cohorts and genders. If party leaders think that women are simply less competent, we should find no difference in the number of female candidates across age groups, although the overall number of female candidates may be higher in PR than SMD, since PR systems generally tend to encourage minority representation. On the other hand, as we hypothesized, if women worry about family responsibilities, we should see fewer female candidates around reproductive age—despite the fact that this is the key age for men to enter politics. More dramatically still, we should see differences in the percentages of women running in districts and on lists. Since an SMD system requires, on average, individual candidates to engage in more individual campaigning and constituency work than a PR system (see Iversen and Rosenbluth Reference Iversen and Rosenbluth2008; Kittilson and Schwindt-Bayer Reference Kittilson and Schwindt-Bayer2010), SMD systems should further discourage female candidates with young children.Footnote 15
Christensen (Reference Christensen and Tremblay2008) finds that more female politicians are elected via the PR portion of Japan's electoral system than the SMD portion. Miura (Reference Miura and Miura2016) reports that the percentage of female candidates is higher among those running solely from PR (almost 25%), while it is lower among candidates that run solely from SMDs and those running both from PR and SMDs (roughly 15% of candidates, respectively). We build on these studies to probe whether, and to what extent, this difference in Japanese women's willingness to run from different portions of the electoral system is driven by their family obligations.
We test these expectations using a survey conducted jointly by the University of Tokyo and Asahi newspaper (UTokyo-Asahi Survey [UTAS]). The survey collected information about all candidates, including both incumbents and challengers, for all the Lower House elections between 2003 and 2014. The high response rate of 95% in 2014 (N = 1,132) alleviates concern about selection bias among respondents. In all, 604 of 1,132 respondents were first-time candidates.
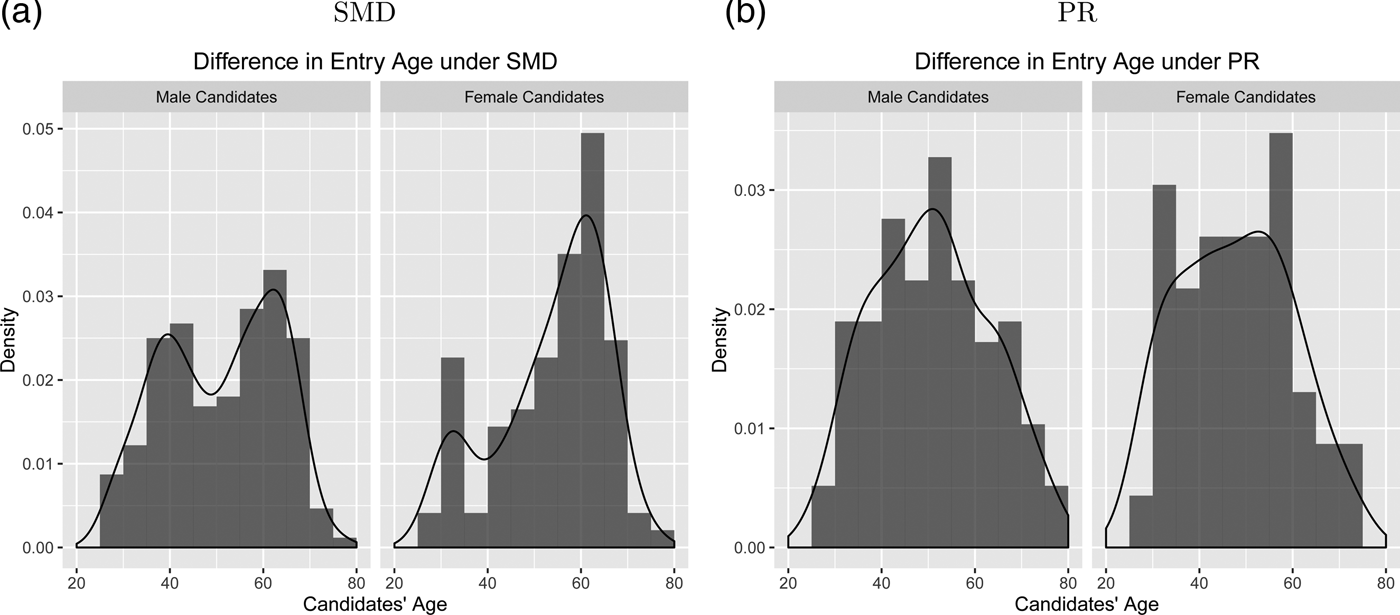
We found that women of reproductive age were less likely to run for office. Figure 2 compares the distributions of male and female first-time candidates in the 2014 lower house election for both SMD and PR districts. As shown in Figure 2, female candidates of reproductive age were less likely to run for office in SMDs compared with their male counterparts. This pattern disappeared on the proportional list, even though the very same voters were choosing both. We also extended the time period and examined the age distributions of male and female first-time candidates in the last three general elections (2009, 2012, 2014) (see Figure E in the online appendix). The sample sizes were 845, 953, and 604 for the 2009, 2012, and 2014 elections, respectively. For all three elections, the age distributions of candidates by gender across the electoral systems were significantly different based on the Kolmogorov-Smirnov test of distribution equality.
Distributions of first-time candidates' age for the 2014 election, by gender.

The results suggest that certain women indeed self-select out of politics more than others. If SMD systems require politicians to spend more time on campaigning and constituency service, it is not hard to see that this would discourage female candidates with young children. Many male candidates choose to run for the first time around age 40, not least because entering national politics around this age ensures that politicians will be able to serve enough terms that they will be considered for ministerial positions by the time they retire. But most Japanese women around age 40 are saddled with child-rearing responsibilities, and this discourages them from making a run at politics. For women running from SMDs, the modal age for first-time candidates is around 60, just when many women are finished child-rearing. As we would expect, this pattern attenuates for candidates running from PR districts, where women tend to enter politics at an earlier age.
Female politicians themselves may not be a good source of information about the barriers to female political ambition, since they are the select few who survived the gauntlet. Like fish who do not know they are swimming in water, successful female politicians may or may not understand what makes them special. But according to a recent poll, even they have some inkling: 51% of the female respondents from a poll of the House of Representatives reported that the social obligation to care for children or elderly parents prevents many women from becoming politicians, and 41% of them believed that many women on the path to office face opposition from family members and relatives.Footnote 16
Survey 4: Recruitment Survey
Survey 3 suggested that women are less likely to run for office when they have to take care of children and household chores. To nail down the mechanism, we conducted a survey experiment in which we asked members of the general public whether they would consider running for a general election. Since Survey 3 targeted only those individuals who had already made the decision to run for office, Survey 4 aims to expand the scope of the study to the general public and reduce the concern of selection bias.
We undertook this survey with a nationally representative sample of 3,206 Japanese adults between December 21 and 27, 2016.Footnote 17 The survey consisted of basic demographic questions, key covariates including general attitudes toward the role of women in the society and interests in politics, and an experimental component.
In the experimental component, all respondents received a version of stimulus information to encourage running for a hypothetical general election, but the specific stimulus that each respondent received varied depending on treatment groups to which respondents were randomly assigned. As common baseline information, respondents in the control group received a message that a hypothetical political party is looking for a candidate like themselves who share the party's basic ideology, suggesting that they would be an ideal candidate for the party. We also controlled for a good winning rate and generous financial incentives.
In addition to a control group, we had two main treatment groups. To test our “time is money” hypothesis, we told respondents in one of the treatment groups that they would receive support from the party for household tasks during her or his electoral campaign, while those in the other treatment group were told that they would not receive such support. With this stimulus manipulation, the survey experiment was intended to test whether the existence or absence of support for household chores encourages or discourages respondents to run for office.Footnote 18 Since encouragement from a party leader may influence women's decisions to run (Karpowitz, Monson, and Preece Reference Karpowitz, Monson and Preece2017), we told respondents in the treatment groups that party members were impressed with their qualifications so that we could boost their willingness to run.Footnote 19
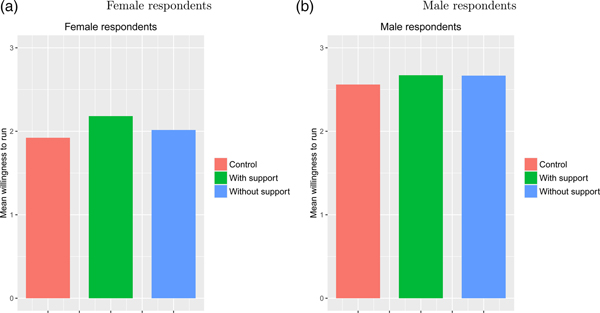
Overall, our empirical analysis for Survey 4 found that encouragement from the political party, on average, increased respondents’ willingness to run for the hypothetical election. Further and more importantly, we found that the existence of household support during the electoral campaign was more likely to increase their willingness. Breaking down the results by respondents’ gender, we found that the latter result was largely driven by female respondents. Figure 3 shows that only female respondents were more likely to run for the election with such support (the effect is statistically significant at the 5% level), while the existence of the support made no difference for male respondents. This suggests that women are more likely to run for an election when they are less burdened by household obligations. However, note that the figure also shows that male respondents, on average, were more likely to run for election than female respondents across all the three groups, suggesting either that household support alone cannot explain the entire variation or that the amount of household support hypothetically on offer is insufficient to change expectations.
Effect of time support on the willingness of running for a general election.

We further found that offering help for household work had the greatest effect on female respondents between the ages of 25 and 34 (see Figure F in the online appendix). The difference is statistically significant at the 5% level.Footnote 20 As shown in the analysis of the UTAS, this was precisely the age when many men entered politics but women did not. The effect of offering help with housework was less marked for other age groups. The analysis shows that offering support for housework could potentially make an important difference in recruiting women into politics, especially because entering politics during this early age allows women to have longer and potentially more powerful political careers.
Recall from Study 1 that this concern over household chores was not shared by voters. Voters did not systematically discriminate against female candidates, even those with small children, implying that the greater effect of support for household work among female compared with male respondents does not stem from respondents’ worries over what voters may think. But this also does not mean that women's concerns about household work are self-imposed. Even if voters do not punish, or even reward, female candidates at the polls, any given Japanese man may not want his own spouse to drop her housework in pursuit of a political career. A Japanese government survey found that Japanese men spend, on average, an hour and seven minutes a week on housework, a far lower figure compared with most other developed democracies (Naikakufu n.d.). The corresponding figure is two hours and 18 minutes for American men, two hours and 10 minutes for British men, two hours and 21 minutes for French and German men, and two hours and 29 minutes for Swedish men (Eurostat 2004).
CONCLUSION
In this article, we have looked for evidence that voters are to blame for the failure of Japanese women to gain anything close to equal representation in Japanese democratic politics. We have dramatically failed to find that evidence for demand-side explanations: politicians’ gender was not an important factor in Japanese voters’ voting decisions. Instead, our empirical analyses point to the decision by women not to run in the first place, on account of heavy family duties and expectations. These findings lend support to studies by Takeyasu (Reference Takeyasu2002) and Aiuchi (Reference Aiuchi, Kawato and Yamamoto2007) that have also failed to uncover voter bias against female candidates but have pointed to supply-side factors in explaining female underrepresentation in Japan. Voters and the political gatekeepers who seek to maximize party votes should welcome more women to run for office but they have not offered a viable way to reduce household work for women or to change gender-based social expectations. Female underrepresentation in Japan continues, unabated.
The policy implications of our findings are stark: women will not make significant headway in Japanese politics until both women and men reduce women's and raise men's obligations in the family. Additional child care support in the form of subsidies and greater availability may help, but it is hard to conceive of how much support for public child care can make up for expectations of around-the-clock working hours and uninterrupted years of human capital development.
One solution that is sometimes proposed to address the underrepresentation of women in Japan is to introduce quotas (Miura Reference Miura, Miura and Eto2014), given their success elsewhere (Tripp and Kang Reference Tripp and Kang2008). In Japan, gatekeeping effects vary across parties: in the absence of quotas, the center-right LDP fielded women in 7.8% of its SMDs in the 2014 general elections, compared with the center-left DPJ's 15.7% (Somusho 2014). The findings presented in this article show that Japanese parties across the political spectrum would benefit from introducing gender quotas and from fielding more women.
In fact, Japan's opposition parties have been eager to introduce a statutory quota system, and in 2016, four major opposition parties submitted a quota bill for national and local legislatures.Footnote 21 Lacking support from the ruling LDP, this effort failed, but a quota system could in the future provide part of the solution to introduce more women into public office. Caul (Reference Caul2001) points to a chicken-and-egg problem that gender quotas are more likely to be adopted in countries that have more women among the party leadership. Given the formidable obstacles in the path of Japanese women candidates, the pressure to adopt meaningful quotas will have to be greater still.
The expectation that women bear primary responsibility for the family is the deepest cultural value in this set of equations, but it does not exist in a vacuum. As long as the decks are stacked against female success, many women will choose to avoid the fruitless battle, thereby reinforcing social expectations about what it is to be a normal Japanese woman. Implicit bias is reinforced with every female failure against the odds.
SUPPLEMENTARY MATERIAL
To view supplementary material for this article, please visit https://doi.org/10.1017/S1743923X18000223.