Implications
The effects of concentrate supplementation level on milk production and cow traffic in early and late lactation in a pasture-based automatic milking (AM) system were examined. Although supplement level had no effect on milk production or cow traffic in early lactation, it did impact on milking distribution in early and late lactation, while also influencing milk yield and cow return time from pasture in late lactation. The experiment provides farmers with supplementation strategies to optimise cow traffic during the examined periods of lactation. However, the benefits obtained from supplementing in the late lactation period should be examined from an economic perspective.
Introduction
The commercialisation of AM systems has provided an alternative milk harvesting method to the labour intensive process of conventional batch milking. Factors such as the unsociable nature of milk harvesting and a deficit in the availability of skilled labour, has led to increasing adoption of the technology at farm level. However, initial installations of AM systems were limited to countries where dairy production is characterised by intensive indoor housing systems. This is primarily due to the fact that AM systems were originally developed for use in such production systems, which are dominated by high costs of production and high-yielding cows (Lind et al., Reference Lind, Ipema, Koning, Mottram and Hermann2000). The integration of AM and pasture-based systems was not considered feasible until reported by Greenall et al. (Reference Greenall, Warren and Warren2004) and Jago et al. (Reference Jago, Davis, Copeman, Ohnstad and Woolford2004). This development, combined with an increasing body of research on the factors affecting AM system optimisation in pasture-based systems (Jago et al., Reference Jago, Davis and Woolford2006; Lyons et al., Reference Lyons, Kerrisk and Garcia2013a; Scott et al., Reference Scott, Thomson, Kerrisk and Garcia2014; among others), has allowed adopters to make more informed decisions with regard to the combination of AM and grazing. This focus on AM and grazing is timely, as there is a renewed focus on the benefits of grazing; one of the main benefits of which is its comparative advantage of reducing total cost of production (Dillon et al., Reference Dillon, Roche, Shalloo and Horan2005). McCarthy et al. (Reference McCarthy, Horan, Dillon, O’Connor, Rath and Shalloo2007a) also outlined the reduced profitability of systems of higher concentrate input relative to systems which rely on high-quality grazed grass. Thus, systems of milk production which utilise large quantities of grazed grass are substantially more insulated against periods of low milk price or high cereal costs (Dillon et al., Reference Dillon, Roche, Shalloo and Horan2005; McCarthy et al., Reference McCarthy, Horan, Dillon, O’Connor, Rath and Shalloo2007a; Patton et al., Reference Patton, Shalloo, Pierce and Horan2012). These benefits at farm level are added to by the superior quality of the milk product produced by pasture-fed cows (O’Callaghan et al., Reference O’Callaghan, Hennessy, McAuliffe, Kilcawley, O’Donovan, Dillon, Ross and Stanton2016). Furthermore, the green image associated with cows grazing pasture continues to appeal to consumers, resulting in potential new markets for products.
‘Seasonal production systems’, such as those operated in Ireland, New Zealand and Australia are established in such a manner as to maximise the utilisation potential of grazed grass, through aligning the start of calving with onset of pasture growth (Dillon et al., Reference Dillon, Roche, Shalloo and Horan2005). However, as the name suggests, the nature of grass growth is seasonal due to the prevailing climatic conditions which leads to grass deficits in the early and late lactation periods (spring and autumn, respectively). This, therefore, necessitates the judicious use of concentrate supplements during these periods, when grass growth levels are sub-optimal and not sufficient to meet herd demands. Not alone can supplementation be used as a tool to extend the grazing rotation, it can also be used to ensure the cow is offered sufficient energy in the diet (McEvoy et al., Reference McEvoy, Kennedy, Murphy, Boland, Delaby and O’Donovan2008), as the dry matter intake (DMI) of the dairy cow is at its lowest in the early lactation period (Ingvartsen and Andersen, Reference Ingvartsen and Andersen2000). This reduced DMI can result in cows experiencing energy expenditure greater than energy intake, also known as negative energy balance (Berry et al., Reference Berry, Veerkamp and Dillon2006). However, Kendrick et al. (Reference Kendrick, Bailey, Garst, Pryor, Ahmadzadeh, Akers, Eyestone, Pearson and Gwazdauskas1999) established that cows on diets of higher energy density returned to positive energy balance sooner than those on diets of lower energy density. Thus, concentrate supplement can be used to maintain energy balance and increase total DMI of dairy cows (Delaby et al., Reference Delaby, Peyraud and Delagarde2001) in early lactation (Bargo et al., Reference Bargo, Muller, Kolver and Delahoy2003).
The level of supplement offered will depend on the dearth of grass quantity. McEvoy et al. (Reference McEvoy, Kennedy, Murphy, Boland, Delaby and O’Donovan2008) found that where grass availability was not limited in the early lactation period, that 3 kg/cow per day was an adequate level of supplement to meet nutritional and intake requirements of the dairy cow. When grass growth exceeds the demand of the herd, as is the case during the summer months, supplementing with concentrate is questionable as the milk response is limited (Kellaway and Harrington, Reference Kellaway and Harrington2004) and the substitution rate is increased (Bargo et al., Reference Bargo, Muller, Delahoy and Cassidy2002). Kennedy et al. (Reference Kennedy, Dillon, Delaby, Faverdin, Stakelum and Rath2003) also concluded that meeting the energy requirements of high-yielding cows from a pasture only diet presents a significant challenge, which may result in such cows failing to achieve their true milk production potential. This has altered breeding strategies in pasture-based dairy systems in recent years, focussing on the breeding of smaller cows of higher durability. These cows have the potential to meet a greater proportion of their needs from grazed grass, thus, reducing the need to supplement with concentrate. However, in late lactation it is recommended to supplement with concentrate in order to maintain milk production and milk lactose content above a threshold at which milk becomes unsuitable for processing (O’Brien, Reference O’Brien2008), as seasonal production systems present the challenge of low milk production in late lactation. In addition, grass quality tends to decline as the year progresses, with autumn representing the period of lowest grass quality (McCarthy et al., Reference McCarthy, Berry, Dillon, Rath and Horan2013 and Reference McCarthy, Delaby, Pierce, McCarthy, Fleming, Brennan and Horan2016). Reid et al. (Reference Reid, O’Donovan, Murphy, Fleming, Kennedy and Lewis2015) outlined that there was no difference in milk production from feeding 3 or 6 kg concentrate/cow per day in late lactation.
The successful operation of a pasture-based AM system relies on cows voluntarily trafficking from grazing at pasture to the milking yard and subsequently, back to pasture again. Without voluntary traffic, milking events will not be distributed evenly throughout the day and failure to achieve this voluntary and distributed milking regime daily may have a negative effect on the uptake and adaption of AM technology at farm level (Lyons et al., Reference Lyons, Kerrisk and Garcia2013b). Jago et al. (Reference Jago, Davis and Woolford2006) established that stage of lactation affects the prolificacy of visitations to the milking yard, with late lactation cows trafficking to the milking yard less often than early lactation cows. Likewise, upon trafficking to the yard those same late lactation cows had a longer transit time from leaving pasture until presentation at the selection gate than the early lactation cows.
The objective of the current experiment was thus, to establish the effect of two differing levels of concentrate supplementation, in the early and late lactation periods, on milk production and cow traffic parameters in a seasonal calving pasture-based AM system.
Material and methods
Experimental description
The experiment was conducted at the Dairygold Research Farm, Animal and Grassland Research and Innovation Centre, Teagasc, Moorepark, Fermoy, Co. Cork, Ireland (50°07′ N, 8°16′ W). The Moorepark soil type is described as a free-draining brown earth soil of sandy loam to loam texture. The farm-let area was a permanent grassland site, of predominately perennial ryegrass sward (Loliumperenne L.). Cows were milked using a Fullwood Merlin 525 AM unit (Fullwood Ltd, Ellesmere, UK).
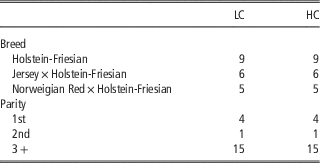
In total, 40 spring-calving dairy cows (10 primiparous and 30 multiparous) were selected from the Teagasc, Moorepark AM herd. The experimental periods for the early (18.9±8.54 days in milk (DIM)) and late lactation trials (207.9±8.54 DIM) extended from 23 February to 12 April 2015 and 31 August to 18 October 2015, respectively (49-day trial period in each experiment). The experiment was a complete randomised block design with cows blocked based on breed, parity, DIM and pre-experimental milk yield, milking frequency and live weight (Table 1). Cows had a predicted transmittable ability for milk production of +10 kg relative to the Irish economic breeding index base cow. Cows were randomly assigned to one of two possible flat rate feeding concentrate supplementation levels: (1) a low-concentrate (LC) supplementation level where cows were offered 2.3 and 0.5 kg/cow per day in early and late lactation, respectively; (2) a high-concentrate (HC) supplementation level where cows were offered 4.4 and 2.7 kg/cow per day in early and late lactation, respectively. Cows were retained on the same treatment (LC or HC) in late lactation as they were assigned to in early lactation. Non-trial cows were allocated 3 and 0.5 kg/cow per day in early and late lactation, respectively. The level of concentrate used within the treatments in early and late lactation periods represented or closely mirrored the actual level of concentrates that are offered to spring calved pasture-based cows on commercial farms at those periods of lactation. This resulted in a 2 kg differential in concentrate offered between the LC and HC treatments in both early and late lactation. The concentrate level offered to the cows was set using Crystal Software (Crystal 0.44, Fullwood Fusion, Cothen, The Netherlands). Cows received 85% of their 24 h concentrate allowance during the first milking of that 24-h period, while the remaining 15% of their daily allowance was allocated in the subsequent milking(s). This ensured that cows milking <2 times/day consumed an adequate proportion of their concentrate allowance each day. The rate at which concentrates were dispensed in the AM unit (g/s) were altered between treatment groups to ensure that cows on differing levels of concentrates were receiving concentrates for a similar duration during their respective milking events.
Partition of the low-concentrate (LC) and high-concentrate (HC) treatment groups with regard to breed, and parity at the start of the early lactation experiment

Animal management
From calving until commencement of the experiment in early lactation, all cows were allowed full time access to pasture and 3 kg concentrate/cow per day. All cows were calved a minimum of 7 days before trial start in early lactation, were familiar to the farm layout and were well conditioned to milking and trafficking in the pasture-based AM system. Each experimental period consisted of a 7-day adjustment period, a 7-day control period and a 35-day data collection period. As it was a seasonal calving system, the ratio of cows : AM unit varied in early and late lactation, as non-trial cows were calving onto the AM system in the early lactation, while the entire herd was milking and trafficking on the system in late lactation. Thus, cows had different milking permissions during both periods, which were implemented using the Crystal Software. Cows in early lactation were allowed a milking permission of 3 times/day (minimum milking interval of 8 h), whereas cows in late lactation were allowed a milking permission of 2 times/day (minimum milking interval of 12 h). Therefore, if a cow trafficked to the milking yard before an 8 or 12 h lapse since her last milking event in early and late lactation, respectively, she was denied access to the robot by a pre-selection drafting gate. The cow was then directed to a post-selection gate where she was sent back to pasture. After the completion of the first experimental period (early lactation) all cows had their milking permission reduced to 2 times/day, at which they remained until dry-off. In addition, all cows had their daily concentrate allowance reduced to 0.5 kg until the commencement of the late lactation experimental period when the respective LC and HC treatments were applied to the trial cows.
Grazing management
Treatment groups and non-trial cows grazed as one herd of cows (40 trial cows and 40 non-trial cows), without any physical separation. The experimental grazing area consisted of 25.2 ha, divided evenly into three grazing blocks (A, B and C), with 15 individual paddocks in each grazing section separated by permanent fences. The average distance that cows had to walk from the yard to a paddock was 325 metres (range 25 to 650 m). Cows were allowed access to each grazing section for 8 h; block A from 0000 to 0800 h, block B from 0800 to 1600 h and block C from 1600 to 0000 h. Once access to a grazing section had closed no further cows were allowed into that section; however, cows that were already present in that grazing section were allowed to remain in there until leaving that section voluntarily. Cows who did not leave the paddock voluntarily were subsequently fetched before the opening of the next grazing allocation. The farm was walked weekly to assess farm pasture cover through visual estimation. Paddocks which were deemed to have a pasture cover greater than target were removed from the grazing rotation. Cows were strip-grazed within each paddock, with cows receiving a new strip in each section over each 24-h period. The size of the area allocated to the herd was determined by (i) the number of cows in the herd, (ii) the estimated grass intake of the herd (estimated total intake−concentrate supplement/three (grazing sections)) and (iii) the pre-grazing herbage mass. The pre-grazing herbage mass (>4 cm) was determined twice weekly by cutting two strips of grass per paddock (1.2 m×10 m) using an Etesia mower (Etesia UK Ltd, Warwick, UK). In total, 10 measurements of compressed sward height were taken pre- and post-cutting using a rising plate meter (diameter 355 mm; Jenquip, Feilding, New Zealand). All mown grass from each cut was weighed and then a sample was collected. A subsample of 0.1 kg was dried at 90°C for 16 h for DM estimation. Pre- and post-grazing sward height was assessed daily using a Jenquip rising plate meter. Pre- and post-grazing sward heights were measured by taking 30 measurements/grass allocation per day. The pasture received fertilisation of 250, 3, 8 and 25 kg/ha of nitrogen, phosphorous, potassium and sulphur, respectively.
Chemical analysis
A composite sample of grass was formed from the two strips of grass cut in each paddock before grazing. These samples were frozen at −20°C and at the end of each grazing rotation the samples were bulked by bowl chopping them. Samples were subsequently freeze dried for 48 h, milled though a 1 mm sieve and stored for chemical analysis. They were then analysed for contents of ash, ADF, NDF (ANKOM™ Technology, Macedon, NY, USA; Van Soest et al., Reference Van Soest, Robertson and Lewis1991), CP (Leco FP-428; Leco Australia Pty Ltd, Baulkham Hills, New South Wales, Australia) and organic matter digestibility (Fibertec™ Systems; Foss, Ballymount, Ireland; Morgan et al., Reference Morgan, Stakelum and Dwyer1989). The concentrate offered was sampled each week and analysed using near IR reflectance spectroscopy (NIR; Foss-NIR System DK, Hillerød, Denmark) for DM, CP, NDF, ash and crude fibre.
Data description
Cows were fitted with a leg mounted radio transponder identification device (Afitag; Afimilk, Kibbutz Afikim, Israel) that allowed automatic identification at the pre- and post-selection gates and in the milking unit. Thus, data from both the selection gates and the AM system were recorded electronically. Data recorded by the AM system included cow number, milk yield/milking and per day (kg/cow), number of milking/day, milking interval (h/cow), milking duration (min/cow), average quarter dead time (s/cow), average milk flow rate (kg/min) and concentrate consumed (kg/cow). At the conclusion of each milking event, that milking event was assigned one of three possible outcomes; successful, yield carry over (YCO) or failure, according to the actual yield of milk produced relative to the expected yield. A milking was deemed successful when >80% of the expected yield was harvested; a YCO was defined as when >20% and <80% of expected yield was harvested, while a failed milking occurred when <20% of expected yield was harvested. After a failed milking, the cow was returned to the milking yard for another attempt at milking. A YCO milking also resulted in an earlier admission (than permitted by the milking permission setting) of that cow to the milking robot for the subsequent milking, with the timing of re-entry determined by the proportion of milk harvested in the previous milking. All data concerning milking parameters excluded failed milkings since these cows were automatically returned to the pre-milking waiting yard for another milking. The recording of the passing of each individual cow at the selection gates by Logview software (Fullwood Ltd) allowed for the calculation of cow traffic variables. These included return time (time, in hours, elapsed from when a cow exited the post-selection gate until she returned to the pre-selection gate) and wait time (time, in hours, elapsed from when a cow entered the pre-milking yard until she entered into the AM unit). The variable return time represented the average of return times associated with each individual visit to the milking yard, whereas wait time was averaged for each individual visit and summed for each 24-h period to get a daily wait time value. Data on the number of pre-selection gate passes by the cows in each treatment group were also recorded on an hourly basis. Activity minutes were measured using the leg mounted radio transponder which also acted as a pedometer. Pasture data collected each day included pre-grazing sward heights, area of pasture allocation and post-grazing sward heights.
Statistical analysis
Data were statistically analysed using least squares means ANOVA using mixed procedure analysis (PROC MIXED) in SAS v9.3 (SAS Institute Inc., Cary, NC, USA). Both experimental periods were analysed separately. Cow was included as the random effect and weekly measurement was treated as the repeated measure. Data from the control week was included as the covariate for each dependent variable. The following repeated measures mixed model was used for the variables: milking frequency, milking interval, milk yield/milking and per day, milking duration/visit and per day, average milk flow, quarter dead time, activity/day and return time/visit, wait time/visit and per day:
 $$\eqalignno{Y_{{ijklmno}} \,{\equals}\, & u{\plus}PV_{i} {\plus}T_{j} {\plus}B_{k} {\plus}P_{l} {\plus}D_{m} {\plus}C_{n} {\plus}W_{o} {\plus}T_{i} B_{k} \cr & {\plus}T_{i} P_{l} {\plus}T_{i} W_{o} {\plus}e_{{ijklmno}} $$
where Y ijklmno is the dependent response variable; u the overall mean; PV i the pre-experimental variable used as the covariate; T j the treatment j; B k the breed k; P l the parity i; D m the DIM m; C n the random effect of cow n; W o the repeated measures effect of week O; T i B k the interaction between treatment and breed; T i P l the interaction between treatment and parity; T i W o the interaction between treatment and week; and e ijklmno the residual error term.
The covariance structure of models were tested and the selection among autoregressive (1), heterogeneous autoregressive (1), compound symmetry, heterogeneous compound symmetry and unstructured covariance structures were determined based on the lowest Akaike’s Information Criterion and Bayesian Information Criterion (Littell et al., Reference Littell, Stroup, Milliken, Wolfinger and Schabenberger2006). The Kenward–Rogers method was used for the calculation of df for all mixed models. Significance was set at 5% (P<0.05), with non-significant effects removed from the models by backward elimination. Significance was examined by post hoc analysis of means using a Tukey–Kramer test. The milking event outcome proportions were pooled by treatment and analysed using the logistics procedure (PROC LOGISTIC) of SAS. The daily distribution of pre-selection gate passes were pooled by treatment and analysed using frequency procedure (PROC FREQ) of SAS. Significance for χ 2 test were used to test between treatment groups in relative frequency of gate passes at any particular time point.
Results
Grazing and dietary characteristics
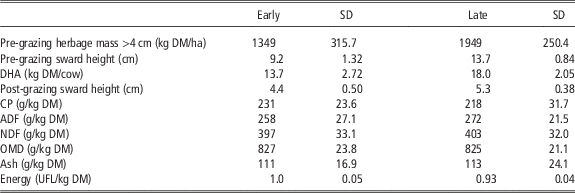
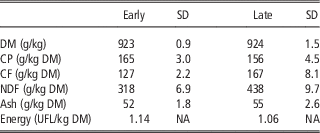
Mean grazing characteristics and grass quality are outlined in Table 2. Cows were allocated a total of 13.7 and 18.0 kg DM/ha of grazed grass in early and late lactation, respectively. Mean daily concentrate consumption in early lactation was 2.34 and 4.36±0.03 kg/cow for LC and HC, respectively, while in late lactation LC and HC consumed 0.42 and 2.42±0.02 kg/cow, respectively. Mean chemical composition of the concentrate offered is outlined in Table 3.
Grazing and grass quality characteristics during the early and late lactation experimental periods

DHA=daily herbage allowance for the herd; DM=dry matter; OMD=organic matter digestibility; UFL=Unité fourragère lait.
Quality of the concentrate consumed during early and late lactation experimental periods

CF=crude fibre; UFL=Unité fourragère lait.
Milking frequency, interval and outcome
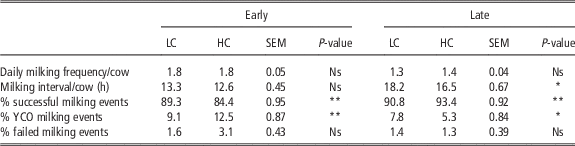
Milking frequency, interval and outcome of the milking event for the early and late lactation experimental periods are outlined in Table 4.
The effect of low-concentrate (LC) and high-concentrate (HC) supplementation levels on daily milking frequency, milking interval and milking event outcome as a proportion of total milking events in early and late lactation

YCO=yield carry over.
Significance levels: *P<0.05; **P<0.01.
Early lactation
Concentrate supplementation level had no significant effect on milking frequency or milking interval. However, the outcome of the milking event was significantly affected. The HC treatment had a numerically lower milking interval than LC. This was likely a direct result of that treatment having significantly less successful milking events (P<0.01; 89.3% and 84.4% for LC and HC, respectively) and a significantly greater proportion of YCO’s (P<0.01; 9.1% and 12.5% for LC and HC, respectively).
Late lactation
Treatment had no significant effect on milking frequency. However, it did significantly (P<0.05) affect milking interval, with the HC treatment having a 9% shorter milking interval than the LC treatment, at 16.5 and 18.2 h, respectively. This resulted in a numerically different milking frequency which, although not significant, was approaching significance with P=0.09. Contrary to the early lactation period, it was the HC treatment which recorded a significantly greater and reduced number of successful (P<0.01) and YCO (P<0.05) milking events, respectively.
Milk yield and milking characteristics
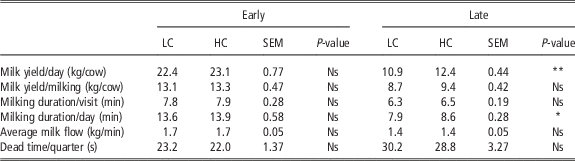
Milk yield and milking characteristics for the early and late lactation experimental periods are outlined in Table 5.
The effect of low-concentrate (LC) and high-concentrate (HC) supplementation levels on milk production and milking characteristics in early and late lactation

Significance levels: *P<0.05; **P<0.01.
Early lactation
Supplementing with LC or HC in early lactation had no significant effect on milk yield or any of the milking characteristics considered. While not significant, the HC treatment did have a numerically greater milk yield per day while also having a numerically greater milking duration per day.
Late lactation
Treatment had a significant effect on milk yield/day (P<0.01) and milking duration/day (P<0.05). High-concentrate cows had a higher milk yield/day than LC cows (12.4 and 10.9 kg/cow, respectively), which resulted in a longer milking duration/day for the HC treatment of 8.6 min compared with 7.9 min for the LC treatment. The LC cows had a numerically lower milk yield/milking and numerically shorter milking duration/visit. Although not significant (P=0.67), the higher supplementation level resulted in a biologically shorter (−1.4 s) dead time compared with the cows on the lower level of supplement.
Cow traffic
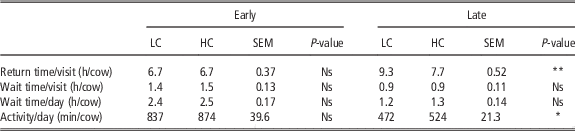
Results for cow traffic parameters for early and late lactation experimental periods are outlined in Table 6.
The effect of low-concentrate (LC) and high-concentrate (HC) supplementation levels on cow traffic and activity in early and late lactation

Significance levels: *P<0.05; **P<0.01.
Early lactation
Treatment had no significant effect on the cow traffic parameters analysed. Results were similar between treatments for return time/visit, wait time/visit and per day. However, numerical disparities (P=0.86) existed between the treatments for activity, with the HC cows recording 37 min more activity/day than the LC cows.
Late lactation
Supplementing with HC in late lactation significantly (P<0.01) reduced the return time from pasture to the milking yard. Cows on the HC treatment returned from pasture 1.6 h or 21% sooner than those on the LC treatment. Treatment also had a significant (P<0.05) effect on activity, with HC cows recording 11% (52 min) greater activity than the cows on the LC treatment. Supplementation level did not influence wait time in the pre-milking yard on a visit or a daily basis.
Gate passes
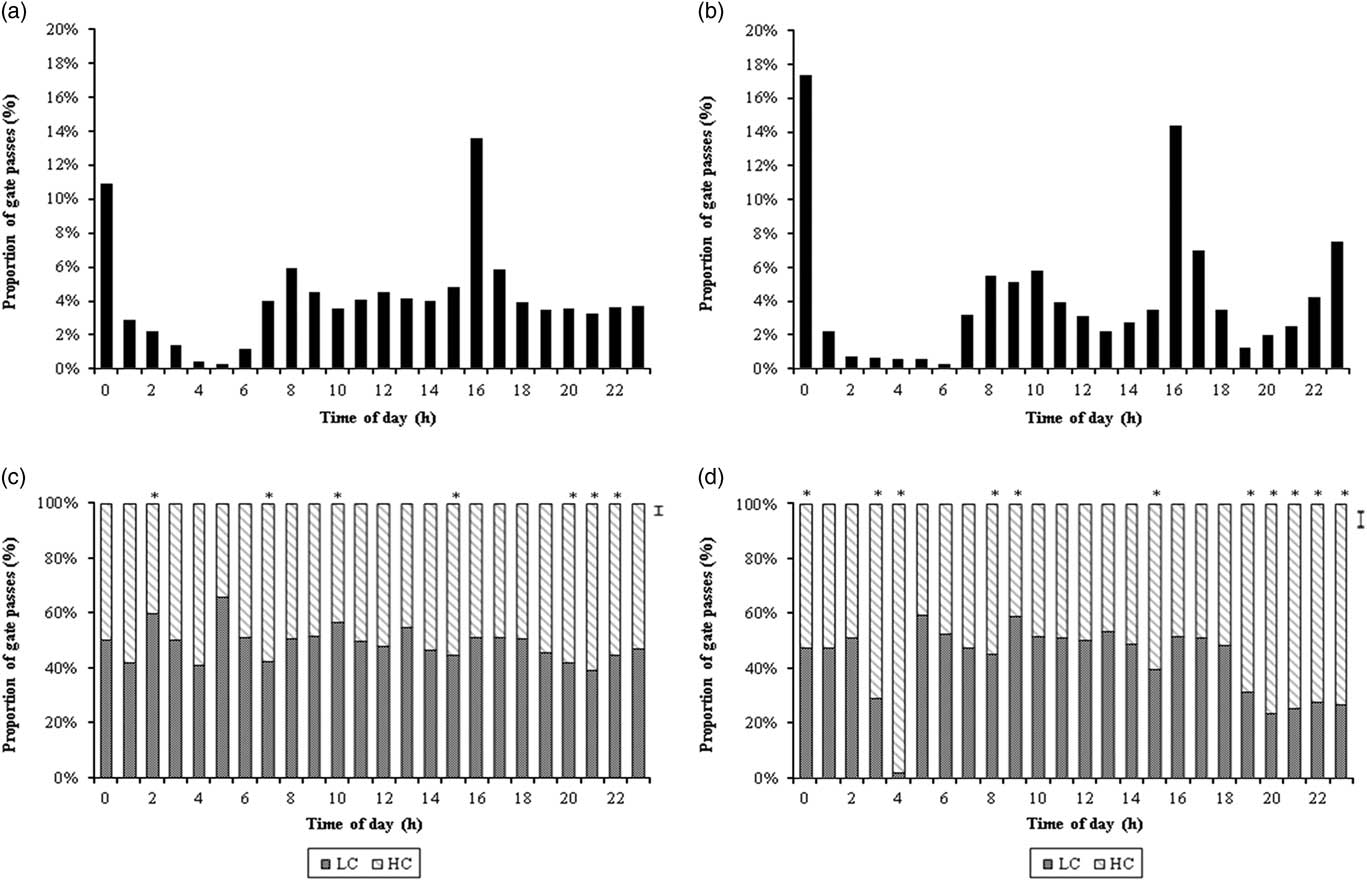
Results of the distribution of pre-selection gate passes for the early and late lactation experimental periods are outlined in Figure 1a to d. Figure 1a and b indicate the proportion of total gate passes occurring at each time point (each 1-h interval) over the 24-h period, for all cows participating on the trial. Figure 1c and d indicate the proportion of gate passes at each time point for cows on the different concentrate level treatments in early and late lactation, respectively.
(a) The combined total number of pre-selection gate passes for both treatments in the early lactation period, represented as an hourly proportion of the total. The time below each bar represents the hour that the gate passes occurred (i.e. bar 10 represents the gate passes that occurred between 1000 and 1100 h). (b) The combined total number of pre-selection gate passes for both treatments in the late lactation period, represented as an hourly proportion of the total. The time below each bar represents the hour that the gate passes occurred (i.e. bar 10 represents the gate passes that occurred between 1000 and 1100 h). (c) The effect of low-concentrate (LC) and high-concentrate (HC) supplementation levels in early lactation on the average hourly distribution of gate passes (gate passes/treatment as a percentage of total gate passes at each time point). The time below each bar represents the hour that the gate passes occurred (i.e. bar 10 represents the gate passes that occurred between 1000 and 1100 h). Hours with significantly different throughput between treatments (P<0.05) are identified accordingly (*). The vertical bar represents the average standard error of the difference. (d) The effect of LC and HC supplementation levels in late lactation on the average hourly distribution of gate passes (gate passes/treatment as a percentage of total gate passes at each time point). The time below each bar represents the hour that the gate passes occurred (i.e. bar 10 represents the gate passes that occurred between 1000 and 1100 h). Hours with significantly different throughput between treatments (P<0.05) are identified accordingly (*). The vertical bar represents the average standard error of the difference.

Early lactation
Concentrate supplementation level had a significant effect on the number of gate passes at seven of the 24 h time points. LC had significantly more gates passes than the HC treatment at time points 2 (P<0.01) and 10 (P<0.05), while time point 13 was approaching significance (P=0.06). However, HC had significantly more gate passes than LC at five out of the 24 time points measured, which included time points 7 (P<0.01), 15 (P<0.05), 20, 21 (P<0.001) and 22 (P<0.05), with time point 1 also approaching significance (P=0.06).
Late lactation
There was a significant difference between treatment groups for the number of gate passes at 11 of the 24 time points measured. Only one of these were accounted for by the LC treatment recording a significantly greater number of gate passes than the HC treatment, this occurring at time point 9 (P<0.001). Thus, the remaining 10 time points represented a significant difference between treatments where the HC treatment recorded a greater number of gate passes then LC at that particular time point. These included time points 0, 8 (P<0.05), 3 (P<0.01), 4, 15, 19, 20, 21, 22 and 23 (P<0.001).
Discussion
In intensive indoor based AM systems, concentrate supplement is offered not only to increase milk yield, but also to increase milking frequency (Prescott et al., Reference Prescott, Mottram and Webster1998), which will, in turn, have a positive effect on milk yield (Bach et al., Reference Bach, Iglesias, Calsamiglia and Devant2007). However, the current experiment was conducted in the context of the low input seasonal pasture-based system, where the focus is on the harvesting and utilisation of grazed grass. Despite this focus on utilising large quantities of grazed grass, there remains the need to supplement with concentrate at certain periods of the lactation, due to reduced DMI or pasture supply. This usually occurs, but is not limited exclusively to, the early and late lactation periods, with the level of concentrate supplement offered being reflective of the availability of pasture.
Milking performance and characteristics
Treatment had no significant effect on milking frequency in either the early or late lactation period. This is similar to the findings of Jago et al. (Reference Jago, Jackson, Davis, Wieliczko, Copeman, Ohnstad, Claycomb and Woolford2007) who investigated supplement level in a pasture-based AM system, and both those of Halachmi et al. (Reference Halachmi, Ofir and Miron2005) and Bach et al. (Reference Bach, Iglesias, Calsamiglia and Devant2007) who studied the effect of supplement level in indoor AM systems. Although not statistically significant, the increase in milking frequency from 1.3 to 1.4 times/day with the HC level in late lactation could be classified as approaching significance. As milking frequency is directly related to milking interval, the significant difference in milking interval between the LC and HC treatments was not unexpected.
The LC treatment achieved a significantly greater proportion of successful milking events than the HC treatment in early lactation, with this influencing the proportion of YCO milking events, since YCO cows were allowed access to the AM unit sooner than those recorded with a successful milking event. The reason(s) for these significant differences are unclear as observations of cow behaviour while in the milking unit were not undertaken. However, Prescott (Reference Prescott1995) established that feeding during milking caused cows to move more in the milking unit, thus making the attachment of the cups more difficult, offering one possible explanation for the results observed in the current experiment. As both treatments received concentrate in the AM unit, it is possible that the level of concentrates offered may have influenced cow behaviour, as opposed to the concentrates themselves. The opposite was observed in late lactation with the LC treatment, this time receiving only 0.5 kg/cow per day in the AM unit, achieving a significantly reduced number of successful milkings. These findings concur with those of Jago et al. (Reference Jago, Jackson, Davis, Wieliczko, Copeman, Ohnstad, Claycomb and Woolford2007), who found that a treatment receiving no concentrates in the AM unit had a numerically a lower proportion of successful milkings and greater proportion of YCO milkings. While the trends in milking event outcome differed between treatments across the early and late lactation periods of the experiment, it has become clear that a feeding level of 2 to 2.5 kg/cow per day achieved the greater proportion of successful milking events. Thus, this may indicate an interaction between feeding level and milking behaviour, something which warrants further investigation. In addition, the impact of stage of lactation should not be discounted either, with the milk yield of the LC treatment reducing more rapidly over the duration of the late lactation experimental period compared with the HC treatment (18% and 8%, respectively; data not presented here).
Concentrate level had no significant effect on milk yield or any of the milking characteristics measured, such as milking duration, average milk flow or average dead time, in early lactation. The similar milk yield observed for the different treatments in early lactation may be a direct result of cows on the LC treatment mobilising more body reserves in the early lactation period (Bargo et al., Reference Bargo, Muller, Delahoy and Cassidy2002). Furthermore, Baudracco et al. (Reference Baudracco, Lopez-Villalobos, Holmes and Macdonald2010) outlined that due to the high energy content of spring grass, the milk response to concentrate was at its lowest during this period. As milk yield was not different between groups and as there is a positive correlation between milk yield and average milk flow (Weiss et al., Reference Weiss, Weinfurtner and Bruckmaier2004), average milk flow, dead time and average milking duration were not significantly different between treatments. This is an important finding in the context of seasonal AM production system where the calving is compact and aligned to the start of the grass growing season. This results in a large portion of the herd reaching peak milk yield together, which in an AM system puts substantial pressure on the AM unit at that period of the year. This may limit the potential number cows that can be milked and impact the overall optimisation of the system. However, due to the lack of an early lactation milk yield increase from feeding HC level and the subsequent lack of an impact on key metrics such as milking duration and average milk flow rate, the feeding of HC (should the need arise due to grass deficit) would not be detrimental to AM system optimisation at peak production, where the AM unit is operating at capacity.
However, in late lactation AM system capacity is not an issue in a seasonal production system as cows are at the lower end of their production cycle. During this period of the current experiment, the HC treatment (additional 2 kg/cow per day of concentrate) had a significant increase in milk production of 1.5 kg/cow per day. This may have been due to the quality of grass consumed by the cow, as a poorer quality base feed would result in a greater milk response. McCarthy et al. (Reference McCarthy, Delaby, Pierce, McCarthy, Fleming, Brennan and Horan2016) outlined that spring grass (early lactation) has the greatest quality, whereas autumn grass (late lactation) has the poorest quality, as was the case in the current experiment. The milk response of 0.75 kg of milk per kg of concentrate in the current experiment is lower than that of Reid et al. (Reference Reid, O’Donovan, Murphy, Fleming, Kennedy and Lewis2015), who found a milk response of 0.96 kg of milk per kg of concentrate when moving from a grass diet with no concentrate supplementation to one with 3 kg of concentrate, in late lactation. However, that study was conducted in the context of a conventional milking system, where cows were milked twice daily. The reduced milking frequency of the cows in the current experiment would have equated to 4.2 less milking/cow per week than those in the study of Reid et al. (Reference Reid, O’Donovan, Murphy, Fleming, Kennedy and Lewis2015). Thus, it is possible that the reduction in late lactation milking frequency of the cows, herein, limited the ability of those cows to respond to the supplement allocated to them.
Due to the low degree of udder filling in late lactation (Bruckmaier, Reference Bruckmaier2005), dead times and average milk flow did not differ significantly between the treatments. McCarthy et al. (Reference McCarthy, Pierce, Delaby, Brennan, Fleming and Horan2007b) established that cows on a HC diet in late lactation had a significantly greater average milk flow rate. However, unlike the current experiment, the cows in that experiment were of a higher genetic potential for milk production and were also on a higher level of concentrate supplement throughout the lactation and not only in the early and late lactation periods. The combination of the difference in milk yield and the similar average milk flow rates between treatments in the current study resulted in the HC treatment having a significantly longer milking duration/day. In a seasonal production system, this increase in milking duration in late lactation is not detrimental to the optimisation of the AM system, as there is a substantial surplus of capacity on the AM unit (depending on herd size) at that period of lactation.
Cow traffic and gate passes
The successful operation of an AM system, irrespective of production system, is dependent on cows presenting themselves at the milking unit on a voluntary and continuous basis. Jago et al. (Reference Jago, Davis and Woolford2006) established that cows in late lactation were less motivated to visit the AM unit than cows in earlier lactation. Although not statistically analysed, the current experiment is in agreement with the findings of Jago et al. (Reference Jago, Davis and Woolford2006), with late lactation cows having a numerically longer return time from pasture and lower activity levels than cows in early lactation. Interestingly, the results from the current experiment indicate that offering an additional 2 kg/cow per day of concentrate in late lactation had a positive impact on cow traffic with those cows returning from pasture 1.6 h sooner than the LC cows. Jago et al. (Reference Jago, Jackson, Davis, Wieliczko, Copeman, Ohnstad, Claycomb and Woolford2007) found that feeding concentrate during milking to early lactation cows provided little incentive for them to traffic from pasture to the dairy. Prescott (Reference Prescott1995) outlined some reasons why cows are motivated to be milked, such as the discomfort caused by udder pressure, the gaining of a psychological reward for being milked and finally, the milk let down process is rewarding, due to the release of oxytocin. In the current experiment it is likely that the motivation of cows to milk was reduced in late lactation due to a lower level of milk production resulting in reduced udder discomfort relative to early lactation. Thus, the feeding of concentrate at the HC level had no effect in the early lactation period on return time, but did reduce return times from pasture in late lactation.
Treatment caused no significant effect on waiting times in the pre-milking yard, in either early or late lactation in the current experiment. This is at odds with the findings of Scott et al. (Reference Scott, Thomson, Kerrisk and Garcia2014) who found that offering a small quantity of concentrate at milking reduced voluntary waiting times in the pre-milking yard. However, Lyons et al. (Reference Lyons, Kerrisk and Garcia2013b) indicated that data from Australia showed that the time taken to return from pasture to the dairy was the main factor in explaining extended milking intervals. Therefore, while it is important to reduce waiting time, it is of greater priority to reduce return time from pasture in order ensure that extended milking intervals are reduced.
Treatments differed significantly in 7 and 11 of the 1-h time point periods in early and late lactation, respectively. With the pre-selection gate directing cows to a new grass allocation in one of the three grazing sections at 0000, 0800 and 1600 h, it was expected that the largest proportions of pre-selection gate passes would occur at times surrounding those time points (Figure 1a and b). Time point 0 and 16 experienced large peaks, while the traffic associated with the gate change at 0800 h being more prolonged with traffic distributed across a greater number of time points. In agreement with the literature, as reviewed by John et al. (Reference John, Clark, Freeman, Kerrisk, Garcia and Halachmi2016), there was a substantial decrease in the number of gate passes in the early hours of the morning. The data from the current experiment indicated that the cows on the HC treatment were visiting the milking yard in anticipation of the pre-selection gate change, with the gate change representing not only the opportunity to access the available of fresh grass, but also the opportunity to gain access to the AM unit to receive their concentrate allowance. By moving from pasture to the yard prior to the gate change, it allowed the cows gain access to the milking unit while also gaining access to the fresh pasture early in the allocation, when there would have been large quantities of leafy material still remaining. This was apparent in both early and late lactation with significantly more gate passes at time point 7, 15 and 20 to 22 in early lactation and significantly more gate passes at time points 8, 15 and 19 to 23 in late lactation. In contrast, the LC treatment group visited the pre-selection gate significantly more in the hours following the gate time change, such as time point 2 in early lactation and time point 9 in late lactation. This may also indicate that the LC treatment cows were influenced by the movement of HC cows and if this were to be the case, it could be characterised as a possible limitation of the experiment, as both treatments grazed in the same pasture and milked in the same AM unit. However, even at the time points where no significance was observed, the LC treatment recorded a reasonable number of gate passes, indicating that although total gate passes for that treatment were lower, an even distribution of gate passes still occurred. In late lactation, the distribution of gate passes for the LC treatment group were more pronounced, not only following the pre-selection gate change but also during the day time period, with large troughs in the number of gate passes during the late evening and early morning periods. The dominance of the HC treatment during these periods of LC troughs indicated that the availability of concentrate supplement in the AM unit acted as motivation for cows to visit the yard during the periods of low occupancy. This finding concurs with the finding of Lessire et al. (Reference Lessire, Froidmont, Shortall, Hornick and Dufrasne2017), which found that although attendance at the AM unit was low at times such as the early morning period (0000 to 0600 h), the cows that did attend were those receiving the higher level of supplement.
Conclusion
This experiment examined the effect of supplementing dairy cows with two different levels of supplement in a pasture-based AM system, at a time when the inclusion of a supplement in the diet would be prevalent; in this case during the early and late lactation periods. Supplementing in early lactation with HC and LC levels, demonstrated no positive or negative effects on cow traffic or milk production. Nevertheless, in late lactation supplementing with HC resulted in increased milk production, a shorter milking interval and a shorter return time from pasture. The higher supplement level also had the positive effect of bringing the cows to the milking yard at times of low occupancy, such as early morning. However, any decision regarding the supplementing of dairy cows with concentrates needs to be examined from an economic perspective, to establish if the milk production and cow traffic benefits displayed in late lactation outweigh the cost of the concentrate, thereby ensuring that the decision to supplement is financially prudent.
Acknowledgements
The authors wish to acknowledge the funding for this research from the European Union’s Seventh Framework Program managed by Research Executive Agency (REA), http://ec.europa.eu/research/rea ((FP7/2007-2013), under grant agreement no. SME-2012-2-314879). The authors also wish to acknowledge the Teagasc Walsh Fellowship programme for the funding of J.S.