Implications
Livestock industry is increasingly interested in having dams more resilient and robust. Litter size variance within female has been proposed as a selection criterion to improve female’s resilience. This study evaluates the correlated response in environmental sensitivity of two lines divergently selected for litter size variability. The high line showed a lower survival rate at birth (SRB) and a larger involuntary culling rate (ICR) than the low line, which would agree with a different susceptibility to stress and disease between lines. Therefore, selection to reduce litter size variability could lead to more resilient animals.
Introduction
Genetics selection has considerably increased the productivity in the livestock species, but it is questioned concerning its negative effect on welfare (Rauw et al., Reference Rauw, Kanis, Noordhuizen-Stassen and Grommers1998). In this scenario, livestock industry is increasingly interested in having animals more adapted to environmental perturbations. Robustness and resilience are individual characteristics favouring welfare. Robustness has been defined as the ability of the animal to express its production potential in a wide range of environments without compromising its health and reproduction (Knap, Reference Knap2005). Resilience is the capacity of the animal to rapidly return to the physiological, behavioural, cognitive, health, affective and production states that pertained before exposure to a disturbance (Colditz and Hine, Reference Colditz and Hine2016). Both robustness and resilience are genetically related to environmental sensitivity (Mirkena et al., Reference Mirkena, Duguma, Haile, Tibbo, Okeyo, Wurzinger and Sölkner2011, for robustness; Mulder and Rashidi, Reference Mulder and Rashidi2017, for resilience). In the case of litter size, a trait directly related to fitness, environmental variability of litter size would be related to both the ability to maintain a relatively undepressed production level during infection, and the ability to face the invading pathogen’s and subsequent development of infection (i.e. tolerance and resistance). Mulder and Rashidi (Reference Mulder and Rashidi2017) found that selection on resilience increases disease resistance and tolerance to infections; therefore, improving of resilience may lead to improving robustness.
A divergent experiment for environmental variability of litter size has been performed successfully in rabbits during ten generations, the line selected for increased environmental variability of litter size showing a greater variability (4.4 kits2) than the low line (2.7 kits2) (see Blasco et al., Reference Blasco, Martínez-Álvaro, García, Ibáñez-Escriche and Argente2017). Furthermore, selection for environmental variability of litter size displayed a negative correlated response with litter size (7.8 kits in the high line v. 8.5 kits in the low line), due to a lower early embryo development (García et al., Reference García, Blasco and Argente2016) and a lesser success in embryo implantation rate (10.4 implanted embryos in the high line v. 11.7 implanted embryos in the low line; Argente et al., Reference Argente, Calle, García and Blasco2017). We hypothesize that there are two possible mechanisms acting in variability of litter size. The first one at organ level, related to uterine aptitudes, and the second one at animal level, related to the ability of the female to cope during its gestation with environmental challenges, including chronic stressors and infectious diseases. In relation to the first mechanism, there is evidence that maternal stress during peri-implantation period increases embryonic losses (Burkuš et al., Reference Burkuš, Kačmarová, Kubandová, Kokošová, Fabianová, Fabian, Koppel and Čikoš2015), limiting the uterus’ capacity to gestate the maximum potential number of embryos at term; therefore, variability of litter size can be related to the uterine capacity of the female. In this sense, Ibáñez-Escriche et al. (Reference Ibáñez-Escriche, Sorensen, Waagepetersen and Blasco2008) reported a negative correlation between uterine capacity (a trait highly correlated with litter size, Argente et al., Reference Argente, Santacreu, Climen and Blasco2000) and its residual variability. In relation to the second mechanism, we hypothesize that dams with a greater ability to cope with environmental changes would show less sensitivity to stress and diseases, and in consequence less litter size variability. If so, environmental variability of litter size would be related to doe’s resilience.
It is well established that the hypothalamic–pituitary–adrenocortical (HPA) axis is activated in response to environmental stimuli, releasing glucocorticoids to bloodstream and having a key role in coping with environmental challenges (Janssens et al., Reference Janssens, Helmond and Wiegant1995). Serum cortisol concentration has been used traditionally as a biomarker of stress in domestic animals (Cabezas et al., Reference Cabezas, Blas, Marchant and Moreno2007). Besides, it is known that chronic stress leads to dysregulation of the immune system (Webster et al., Reference Webster, Tonelli and Sternberg2002), increasing predisposition to disease (Glaser and Kiecolt-Glaser, Reference Glaser and Kiecolt-Glaser2005). Concerning diseases, acute phase proteins are adequate biomarkers of disease sensitivity, since these plasma proteins change quickly their concentration in response to an inflammatory or infectious process (Eckersall, Reference Eckersall2000). The concentration of lymphocytes and neutrophils in blood may also be used as markers of inflammatory response (Madjid and Fatemi, Reference Madjid and Fatemi2013; Yaşar et al., Reference Yaşar, Uylas, Baspinar, Sarsilmaz, Ates, Erkasap and Sahin2016).
The objective of this paper is to analyse resilience indicators of stress and disease in the lines of the divergent experiment for environmental variance of litter size mentioned before, in order to find whether selection produced a correlated response in resilience.
Material and methods
Animals
Rabbits used in this study came from a maternal synthetic line created from commercial crossbred does. Rabbits were bred at the farm of the Universidad Miguel Hernández of Elche. Reproduction was organized in discrete generations. Does were first mated at 18 weeks of age, thereafter 10 days after parturition. They were under a constant photoperiod of 16:8 h and controlled ventilation. Animals were fed with a standard commercial diet. A divergent selection experiment for environmental variance of litter size variance was carried out over ten generations. Each divergent line had approximately 125 females and 25 males per generation. Selection was based on the phenotypic variance of litter size within the female, after correcting litter size for both year-season and parity-lactation status. As the genetic determination of all parities of a rabbit doe is approximately the same and the permanent effects are the same along parities (Piles et al., Reference Piles, Garcia, Rafel, Ramon and Baselga2006), after correcting for the systematic effects, the phenotypic variance intra-doe records the environmental variability. All dams were ranked based on their intra-doe variance of litter size. Only dams with four or more parities were considered for selection. The best 20% dams were used to breed the next generation. Each sire was mated with five dams and one male progeny from the best dam that a sire was mated to was selected to breed the next generation. This within-male family selection was performed in order to reduce inbreeding. The experiment is described in Blasco et al. (Reference Blasco, Martínez-Álvaro, García, Ibáñez-Escriche and Argente2017).
Blood collection
One blood sample (3 ml) from the central ear artery was taken from 153 females of the 8th generation of selection at 18 weeks of age. Samples were collected into tubes containing tripotassium ethylenediaminetetraacetic acid (K3-EDTA). Each sample was split into two aliquots. One aliquot was used to perform a haemogram. The other aliquot was centrifuged at 4000 rpm for 15 min, in order to determine concentrations of C-reactive protein (CRP), complement C3, bilirubin, cholesterol and triglycerides. Immediately after this sampling, half of the females of both lines were vaccinated subcutaneously against viral haemorrhagic disease (CUNIPRAVAC® RHD, Hipra Laboratory, Girona, Spain), and the other half were vaccinated subcutaneously against myxomatosis (MIXOHIPRA® H, Hipra Laboratory, Girona, Spain). Three days after the vaccination, a blood sample was taken to perform a second haemogram and quantification of levels of CRP, complement C3, bilirubin, cholesterol and triglycerides. Five days after vaccination against viral haemorrhagic disease and myxomatosis, a subset of 29 vaccinated females of the high line and 25 vaccinated females of the low line was injected intramuscularly (i.m.) with 30 µg/kg of ACTH 1 to 24 (Sigma-Aldrich Co. Ltd, Madrid, Spain) at 08:00 a.m. A blood sample was collected to measure cortisol levels before and 4 h after injection with ACTH 1 to 24. This time interval and concentration of ACTH 1 to 24 were established in according to previous study by Guelfi et al. (Reference Guelfi, Zerani, Brecchia, Parillo, Dall’Aglio, Maranesi and Boiti2011). For each assay, sample sizes were calculated considering half of the standard deviation of each trait as the relevant value for difference between lines. The samples were chosen at random within each group.
Resilience indicators
Survival rate at birth and involuntary culling rate
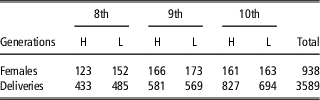
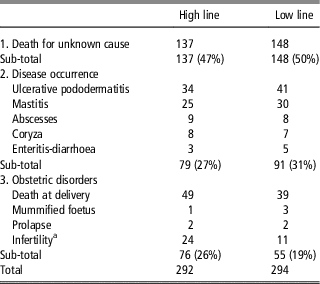
Survival rate at birth was recorded in 3589 deliveries of both divergent lines from the 8th to the 10th generation of selection (see Table 1); SRB was calculated as the ratio between the number of kits born alive and the total number of kits born. Involuntary culling rate was estimated in both lines from the 8th to the 10th generation. Involuntary culling included deaths for unknown cause, disease occurrence and obstetric disorders (Table 2). Disease occurrence encompassed the cases of ulcerative pododermatitis, mastitis, abscesses, coryza and enteritis-diarrhoea. Obstetric disorders included the cases of death at delivery, mummified foetuses, prolapse and infertility. Elimination for infertility was considered when a doe had four consecutive non-fertile mating or seven consecutive refusals to the buck.
Number of female rabbits and deliveries in the high (H) and the low (L) line from the 8th to the 10th generation

Number of involuntary culling female rabbits in the high and the low lines from the 8th to the 10th generation

a Does were culled for infertility after four consecutive non-fertile matings or with seven consecutive refusals to the buck.
Haemogram
White blood leukocyte count (WBC), and the percentage of lymphocytes and neutrophils were measured in 20 does of the high line and 20 does of the low line, before and after the vaccination with CUNIPRAVAC® RHD or MIXOHIPRA® H. All blood samples were collected in the same season. These parameters were assessed by ADVIA 120 Hematology Analyzer (Siemens Healthcare Diagnostics, Erlangen, Germany).
Acute phase protein
C-reactive protein plasma concentration was quantified in 74 does of the high line and 79 does of the low line, before and after the vaccination with CUNIPRAVAC® RHD or MIXOHIPRA® H, using a commercially available ELISA kit for rabbits (catalogue number 2210-5; Life Diagnostics Inc., West Chester, PA, USA).
Cortisol
Cortisol plasma concentration was measured in 29 does of the high line and 25 does of the low line, before and after the injection i.m. with 30 µg/kg of ACTH 1 to 24, using an ELISA kit (catalogue number ERK R7003; Endocrine Technologies Inc., Newark, CA, USA). Cortisol was measured instead of corticosterone because it is the predominant corticosteroid in rabbits’ blood. The sensitivity of the assay was 0.15 ng/ml. The specificity of the assay was 100% for cortisol and <0.2% for corticosterone. The intra-assay and inter-assay coefficients of variation were 5.2% and 6.5%, respectively.
Biochemical parameters
Plasma levels of complement C3, bilirubin, triglycerides and cholesterol were determined using Ecoline kits and automatic analyzer Microlab 300 (Merck®, Darmstadt, Germany), spectrophotometer Genesys 10 (Thermo Fisher Scientific Inc., Madinson, WI, USA) and microprocessor-controlled analyzer EasyLite (Medica, Bedford, MA, USA) according to manufacturer conditions. These biochemical parameters were measured in 10 does from the high line and in 10 does from the low line before and after vaccination with CUNIPRAVAC® RHD or MIXOHIPRA® H.
Statistical analysis
The correlated response in resilience indicators was estimated as the difference between the high and the low lines. In order to assess the difference between lines for SRB, the following model was used:
 $${\rm y}_{{{\rm ijklmn}}} {\equals}{\rm \mu }{\plus}{\rm YS}_{{\rm i}} {\plus}{\rm G}_{{\rm j}} {\plus}{\rm PL}_{{\rm k}} {\plus}{\rm L}_{{\rm l}} {\plus}{\rm b}\,{\rm LS}_{{{\rm ijklmn}}} {\plus}{\rm p}_{{{\rm jlm}}} {\plus}{\rm e}_{{{\rm ijklmn}}}$$
where YS i is the year-season effect with 15 levels, G j the generation with three levels (8th, 9th and 10th generation of selection), PL k the parity-lactation status effect with three levels (nulliparous, lactating and non-lactating female), L l the line effect with two levels (high and low line), b the regression coefficient, LS ijklmn the covariate litter size, p jlm the dam permanent effect and e ijklmn the residual term. It was also analysed SRB without the covariate litter size in former model.
The difference between lines for ICR was analysed using the following model:
 $${\rm y}_{{{\rm ijkl}}} {\equals}{\rm \mu }{\plus}{\rm YS}_{{\rm i}} {\plus}{\rm G}_{{\rm j}} {\plus}{\rm L}_{{\rm k}} {\plus}{\rm e}_{{{\rm ijkl}}}$$
where YS i is the year-season effect with 15 levels, G j the generation with three levels, L k the line effect with two levels and e ijkl the residual term.
The differences between lines for WBC, lymphocytes, neutrophils and biochemical parameters were analysed using the following model:
 $${\rm y}_{{{\rm ijkl}}} {\equals}{\rm \mu }{\plus}{\rm T}_{i} {\plus}{\rm LT}_{{\rm j}} {\plus}{\rm p}_{{{\rm ijk}}} {\plus}{\rm e}_{{{\rm ijkl}}}$$
where T i is the treatment effect with three levels (before vaccination, vaccination with CUNIPRAVAC® RHD and MIXOHIPRA® H), LT j the line-time effect with four levels (the high line before vaccination, the low line before vaccination, the high line at 3 days after vaccination and the low line at 3 days after vaccination), p ijk the dam permanent effect and e ijkl the residual term. The model for cortisol and CRP also included a season effect, since there were several batches throughout the year.
All analyses were performed using Bayesian methodology. Bounded uniform priors were used for all effects with the exception of the dam permanent effect, considered normally distributed with mean 0 and variance I
 $$\sigma _{p}^{2}$$
. Residuals were a priori normally distributed with mean 0 and variance I
 $$\sigma _{e}^{2}$$
. The priors for the variance were also bounded uniform. Features of the marginal posterior distributions for all unknowns were estimated using Gibbs sampling. Inferences were derived from the marginal posterior distributions. Median, the highest posterior density region at 95%, and the guaranteed value at 80% of probability were provided (Blasco, Reference Blasco2017). Notice that in a Bayesian context there is no ‘significance’, but the actual probabilities of the differences being higher or lower than 0 are estimated instead. We consider that there is enough evidence about the high and the low line being different if the probability of |D
H−L| is more than 0.90. The Rabbit program developed by the Institute for Animal Science and Technology (Valencia, Spain) was used for all procedures (more details about its features are given at http://www.dcam.upv.es/dcia/ablasco/Programas/THE%20PROGRAM%20Rabbit.pdf). We used a chain of 60 000 samples, with a burn-in period of 10 000. Only one out of every 10 samples was saved for inferences. Convergence was tested using the Z criterion of Geweke and Monte Carlo sampling errors were computed using time-series procedures.
Results
Kit’s neonatal survival and involuntary culling in dam
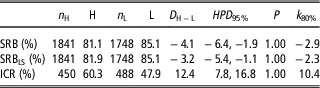
Table 3 shows descriptive statistics and the features of the estimated marginal posterior distributions of the differences between lines (D H−L) for SRB and ICR, and Table 2 gives information about the main causes for involuntary culling in these lines. The high line showed a lower SRB than the low line, before (P=1.00) and after correction for the covariate litter size (P=1.00). In a Bayesian context, several confidence intervals can be easily estimated. We can provide intervals [k, +∞), where k can be interpreted as a guaranteed value with a determined probability (Blasco, Reference Blasco2017). We considered a guaranteed value at 80%. In this context, we note that the difference between the high and low lines for SRB was at least −2.9% (before correction for litter size) and −2.3% (after correction for litter size) with 80% probability. Moreover, ICR was higher in the high line than in the low line; the difference between both lines was +12.4% (P=1.00) with a guaranteed value of +10.4%. Table 2 shows as the main causes of involuntary culling in our lines can be grouped into three groups; death (49%), disease occurrence (29%) and obstetric disorders (22%). Disease emergence is associated with several pathologies like ulcerative pododermatitis, mastitis, abscesses, coryza and enteritis-diarrhoea; while obstetric disorders are related to dam’s reproductive problems, including postpartum complication, mummified foetuses and infertility. Death rate and culling by disease were similar in both lines (47% in the high line v. 50% in the low line for death rate, and 27% in the high line v. 31% in the low line for disease occurrence). However, incidence of reproductive problems was higher in the high line than in the low one (26% v. 19%, respectively).
Correlated response to selection for environmental variability of litter size in survival rate at birth before (SRB) and after correction by litter size (SRBLS), and in involuntary culling rate (ICR) in rabbits

n H=total number of kits born in the high line; n L=total number of kits born in the low line; H=mean of the high line; L=mean of the low line; D H−L=difference between the high and the low lines; HPD 95%=highest posterior density region at 95%; P=probability of the difference being >0 when D H−L >0 or being <0 when D H−L<0; k 80%: guaranteed value at 80%, limit of the interval (k, +∞) when D H−L>0 and (−∞, k) when D H−L <0 at 80% of probability.
Blood parameters
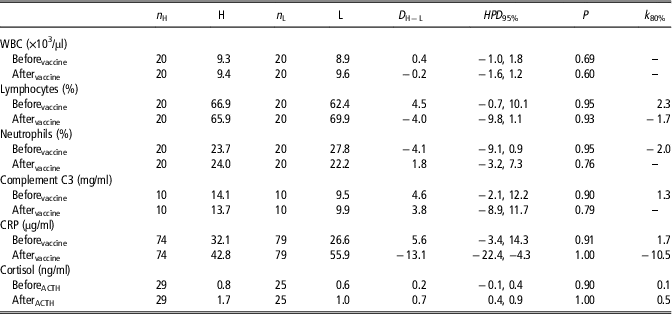
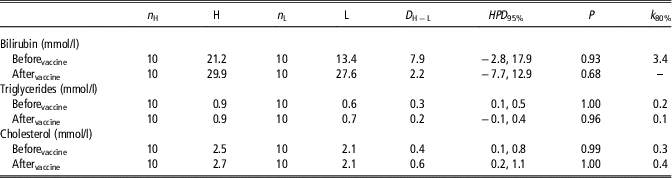
Tables 4 and 5 display the differences between lines (D H−L) for several immunological and biochemical parameters, before and after stimulation by vaccination against myxomatosis or RHD viruses. Before vaccination, no difference in WBC was found between lines (P<0.90), but the high line showed higher percentage of lymphocytes (+4.5%, P=0.95) and lower percentage of neutrophils (−4.0%, P=0.93) than the low line. Concentration of CRP and complement C3 were also higher in this line than in the low one (+5.6 µg/ml and +4.6 mg/ml, with P>0.90). This is in accordance with a higher basal immune response in this line. We also found higher basal concentration in the high line than the low line for serum bilirubin (+7.9 mmol/l, P=0.93), triglycerides (+0.3 mmol/l, P=1.00) and cholesterol (+0.4 mmol/l, P=0.99). Immunological and biochemical responses were similar for both vaccines. After vaccination, the low line showed higher percentage of lymphocytes and CRP plasma concentration than the high one (+4.0% with P=0.93 for lymphocytes, and +13.1 µg/ml with P=1.00 for CRP); since increment was greater in this line (+7.5% v. −1.0% with P=1.00 for lymphocytes, and +29.3 v. +10.7µg/ml with P=1.00 for CRP). No difference in complement C3 was found between lines after vaccination. The difference between lines disappeared for serum bilirubin concentration, due to a larger increment in the low line than in the high line (+14.2 v.+8.7 mmol/l, P=0.93). Besides, the low line increased slightly its levels of triglycerides, reducing the difference between lines (+0.11 v. +0.01 mmol/l, P=0.94). The difference in cholesterol was maintained between lines.
Correlated response to selection for environmental variability of litter size in immune parameters and cortisol in rabbits

n H=number of data in the high line; n L=number of data in the low line; H=mean of the high line; L=mean of the low line; D H−L=differences between the high and low lines at 8th generation; HPD 95%=highest posterior density region at 95%; P=probability of the difference being >0 when D H−L >0 or being <0 when D H−L<0; k 80%=guaranteed value at 80%, limit of the interval (k, +∞) when D H−L>0 and (−∞, k) when D H−L <0 at 80% of probability; WBC=white blood cells; CRP=C-reactive protein.
Correlated response to selection for environmental variability of litter size in biochemical parameters related to liver functionality in rabbits

n H=number of data in the high line; n L=number of data in the low line; H=mean of the high line; L=mean of the low line; D H−L=differences between the high and low lines at 8th generation; HPD 95%=highest posterior density region at 95%; P=probability of the difference being >0 when D H−L >0 or being <0 when D H−L<0; k 80%=guaranteed value at 80%, limit of the interval (k, +∞) when D H−L>0 and (−∞, k) when D H−L < 0 at 80% of probability.
Table 4 also shows the levels of cortisol, before and after stimulation by ACTH 1 to 24. The high line had higher baseline cortisol concentration than the low line before stimulation by ACTH 1 to 24 (+0.2ng/ml, P=0.90). The difference between both lines increased more than threefold after the injection of ACTH 1 to 24 (P=1.00), because of a higher response to stimulation by ACTH 1 to 24 in the high line than in the low one (+0.9 v. +0.4ng/ml, P=0.99).
Discussion
We have divergently selected two rabbit lines for environmental variance of litter size over 10 generations, after which the line selected for variability of litter size showed greater variability (1.7 kits2 more) and lower litter size (almost 1 kit less) than the homogeneous line (Blasco et al., Reference Blasco, Martínez-Álvaro, García, Ibáñez-Escriche and Argente2017), as a consequence of a lower early embryo development (García et al., Reference García, Blasco and Argente2016) and lesser number of implanted embryos (Argente et al., Reference Argente, Calle, García and Blasco2017) in this line. This divergence in litter size variability can be related to the dam’s different capacity of adaptation to adverse environmental changes, which would imply difference in resilience between both lines. Resilience has an important role in animal’s health and welfare. In this study, we found differences between lines in ICR related to reproductive problems, and perinatal mortality. Moreover, García et al. (Reference García, Blasco, García and Argente2018) observed in our lines that selection to increase litter size variability decreases body reserves at parturition. During delivery, there is a great energy mobilization in rabbit females. If the dam does not recover its body reserves after delivery, this leads to poor fertility (Fortun-Lamothe, Reference Fortun-Lamothe2006) and lowering of immunity defences (Castellini et al., Reference Castellini, Dal Bosco, Arias-Álvarez, Lorenzo, Cardinalli and Rebollar2010), which agrees with the larger rate of mortality at delivery and the higher elimination rate by infertility found in our heterogeneous line (16.8% and 8.2%) than in the homogenous one (13.3% and 3.7%). Therefore, increasing litter size variability can compromise dam’s survival in the farm.
In order to understand the physiological bases of resilience in both divergent lines, we assessed specific biomarkers of diseases and stress, such as CRP, complement C3, concentration of lymphocytes and neutrophils in blood, and cortisol. C-reactive protein is an acute phase protein secreted mainly by hepatic cells in response to inflammatory stimulus, activating the complement system and the phagocytes (Rosa Neto and Carvalho, Reference Rosa Neto and Carvalho2009). The complement C3 plays a central role in the complement system, attracting phagocytes to the inflammation site (Volanakis, Reference Volanakis1990). Before vaccination, the high line presented higher levels of CRP and complement C3 than the low line. A higher concentration of CRP and complement C3 are related to a higher sensitivity to diseases (Markanday, Reference Markanday2015). Besides, neutrophils provide the first-line defence against infection in innate immune response. Mature neutrophils are rapidly mobilized from the bone marrow reserve during an inflammatory episode or in response to infection, resulting in a dramatic rise in circulating neutrophil numbers within a matter of hours (Furze and Rankin, Reference Furze and Rankin2008). A higher number of neutrophils in the low line can help the rapid elimination of pathogens and would lead to inactivate the infection. If infection persists, lymphocytes will be involved in the activation of the adaptive immune response (Janeway et al., Reference Janeway, Travers, Walport and Shlomchik2001). Therefore, a lower concentration of neutrophils and a higher concentration of lymphocytes in the high line would show a weaker defend barrier and a greater susceptibility to infections in this line, corroborating a higher sensitivity to common microorganisms in the farm.
Vaccination represents a useful model for studying the dynamics of inflammatory response against pathogen exposure, with the advantage of delivering a controlled dose of antigen (Posthouwer et al., Reference Posthouwer, Voorbij, Grobbee, Numans and van der Bom2004). In this study, we used two types of vaccines: a live attenuated vaccine (as MIXOHIPRA® H) and an inactivated vaccine (as CUNIPRAVAC® RHD). Live attenuated vaccines can induce a greater immune response than inactivated vaccines. In order to increase this immunity response, inactivated vaccines include adjuvants that increase antibody production and can cause a slightly greater level of inflammation. This explains the similar response in immunological and biochemical blood parameters that we found between both types of vaccines. After vaccination, the low line showed a higher increase in concentration of CRP and in lymphocytes than the high line. These findings agree with a quicker and higher inflammatory response in this line. McDade et al. (Reference McDade, Borja, Kuzawa, Perez and Adair2005) studied the inflammatory response to influenza vaccination. These authors suggest that the combination of a low baseline CRP concentration and a robust increase in response to challenge of vaccination is related to a good functionality of the inflammatory system. This would agree with a lower risk for disease, supporting a higher resistance to disease in the low line.
Infectious and inflammatory processes induce alterations in the liver metabolism, leading to reducing inflammation and fighting infections. When an infection takes place, the most common change is a decrease in cholesterol, an increase in plasma triglycerides and an increase in secretion of hepatic very low-density lipoprotein (Feingold and Grunfeld, Reference Feingold and Grunfeld2015). Inflammation and infections can also increase bilirubin levels (Minemura et al., Reference Minemura, Tajiri and Shimizu2014). We found higher basal concentrations of serum bilirubin, cholesterol and triglycerides in the high line than in the low line. A higher concentration of bilirubin and triglycerides in the high line would be related to a larger inflammatory response in this line, due to higher sensibility to diseases. The changes in bilirubin, lipids and lipoproteins during inflammation and infection are part of the innate immune response, therefore they are likely playing an important role in protecting the host. In this sense, bilirubin is a natural antioxidant and it has been postulated as one of the principal protective mechanisms against oxidative stress and inflammatory processes (Otero et al., Reference Otero, Velasco and Sandoval2009). In relation to cholesterol, De Nardo et al. (Reference De Nardo, Labzin, Kono, Seki, Schmidt, Beyer, Xu, Zimmer, Lahrmann, Schildberg, Vogelhuber, Kraut, Ulas, Kerksiek, Krebs, Bode, Grebe, Fitzgerald, Hernández, Williams, Knolle, Kneilling, Röcken, Lütjohann, Wright, Schultze and Latz2014) identified that anti-inflammatory effects of high-density lipoprotein are mediated through the induction of activating transcription factor 3 (AFT3). The ATF3 is a key transcriptional regulator of innate immune response genes, which is induced by Toll-like receptor stimulation and acts as negative regulator of proinflammatory cytokines. Besides, Barcia and Harris (Reference Barcia and Harris2005) found that triglycerides are involved in both attenuation of the response of hepatocytes to circulating proinflammatory cytokines, thereby down-regulating the overall acute phase response and activating neutrophils. The response after the vaccine was higher in the low line for serum bilirubin (+14.2 mmol/l) and triglycerides (+0.11 mmol/l) than in the high one (+8.7 mmol/l for bilirubin and +0.01 mmol/l for triglycerides), these results agree with the protective role of bilirubin and triglycerides against the quicker inflammatory response found in the low line.
In relation to sensibility to stress, it is well documented that a stressful stimulus actives the HPA axis, releasing ACTH. Secretion of ACTH acts on adrenocortical cells to initiate synthesis and release of glucocorticoids (Janssens et al., Reference Janssens, Helmond and Wiegant1995). Thus, baseline levels of cortisol provide insight into the stress state in animals (Cabezas et al., Reference Cabezas, Blas, Marchant and Moreno2007). In this regard, the higher basal cortisol concentration in the high line would be related to a higher chronic stress. On the other hand, it was reported that the sensitivity of the adrenocortex to circulating ACTH increases after chronic stress (Janssens et al., Reference Janssens, Helmond and Wiegant1995). The higher increase in cortisol in response to ACTH in the high line would agree with a higher susceptibility to stress in this line. A larger sensibility to stress or poor coping with environmental perturbations leads to lower immune competence and higher disease susceptibility (Glaser and Kiecolt-Glaser, Reference Glaser and Kiecolt-Glaser2005). C-reactive protein and complement C3 are used as biomarkers of inflammation and infection (Volanakis, Reference Volanakis1990; Eckersall, Reference Eckersall2000). In agreement to a greater chronic stress and larger susceptibility to stress in the high line, we found higher inflammatory response in this line, that is higher levels of CRP and complement C3. Moreover, the negative effect of stress on reproduction by both poor oocyte quality and delayed embryonic development has been widely described (Burkuš et al., Reference Burkuš, Kačmarová, Kubandová, Kokošová, Fabianová, Fabian, Koppel and Čikoš2015). The high line showed a smaller embryonic development and a lower number of implanted embryos than the low line (García et al., Reference García, Blasco and Argente2016; Argente et al., Reference Argente, Calle, García and Blasco2017). These differences in reproductive fitness can be related to differences in the corticotrope response to stress and to differences in inflammatory response, which are two important components of physiological adaptation to environmental challenges, that is to resilience.
Conclusions
Selection for greater litter size variability shows a negative correlated response in SRB and ICR, which can be related with susceptibility to disease and stress; that is, with resilience. Therefore, selection for litter size variability leads to a correlated response in dam’s resilience.
Acknowledgements
This study is supported by the Spanish Ministry of Economy and Competitiveness (MINECO) with the Projects AGL2014-55921, C2-1-P and C2-2-P, and AGL2017-86083, C2-1-P and C2-2-P.
Declaration of interest
The authors declare that they have no competing interests.
Ethics statement
All experimental procedures involving animals were approved by the Miguel Hernández University of Elche Research Ethics Committee (Reference number UMH.DTA.MJA.01.14), in accordance with Council Directives 98/58/EC and 2010/63/EU.
Software and data repository resources
Data and software are available upon request to the corresponding author.