Introduction
Older depressed patients are known to exhibit electrophysiological changes such as decreased fast-wave activity (Brenner et al., Reference Brenner1986) and increased slow-wave activity (Nyström et al., Reference Nyström, Matousek and Hallstrom1986; Dahabra et al., Reference Dahabra1998). Likewise, slowed information processing on behavioral tests is a core cognitive deficit in late life depression (Butters et al., Reference Butters2004). However, it is hard to infer whether such composite neuropsychological tests reflect impairment in electrophysiological speed, psychomotor speed, working memory or decision-making speed (Salthouse, Reference Salthouse2000). It is therefore relevant to trace slowed information processing to its underlying electrophysiological signals by studying the brain's response to event-related potentials (ERPs). To investigate this, two electroencephalographic (EEG) potentials are of special interest: contingent negative variation (CNV) and P300a.
Contingent negative variation (CNV)
The CNV is a slow negative surface potential that represents increased cortical excitability, thereby facilitating the processing of stimuli (Rockstroh et al., Reference Rockstroh, Müller, Wagner, Cohen and Elbert1993). The typical paradigm involves a preparatory warning stimulus (S1), followed by a contingent imperative stimulus (S2) that calls for a behavioral response. The CNV amplitude between the responses to S1 and S2 has been related to the degree of attention (Tecce et al., Reference Tecce, Savignano-Bowman and Meinbresse1976). The post-imperative negative variation (PINV) is a potential following the behavioral response to S2 and is thought to reflect anxiety and decision uncertainty (McCallum, Reference McCallum and Picton1988). CNV magnitude has been shown to be reduced in depression (Ashton et al., Reference Ashton, Golding, Marsh, Thompson, Hassanyeh and Tyrer1988) and to correlate negatively with depression severity ratings (Ashton et al., Reference Ashton, Marshall, Hassanyeh, Marsh and Wright-Honari1994).
Auditory P300a amplitude and latency
The P300a (P3a, or novelty P300) is a positive wave that occurs approximately 300 msec after a subject is confronted with a novel auditory stimulus. A typical procedure used to obtain this response is the “oddball” paradigm whereby a novel stimulus, in this case a tone, is presented randomly amongst more frequent different tones. The P300a is the response to the rarer novel stimuli. The amplitude of the evoked potential N2P3 is thought to reflect the amount of attention paid to the novel information when mental representations are updated (Polich, Reference Polich2007). The latency reflects the time needed to evaluate and categorize the rare stimulus (Polich, Reference Polich2007), but has also been related to memory functions (Pritchard, Reference Pritchard1981). The wave is thought to originate in frontal lobe attentional mechanisms during task processing (Polich, Reference Polich2007). Studies that have reported on the P300a in late life depression show prolonged latency in some (Dahabra et al., Reference Dahabra1998; Kalayam et al., Reference Kalayam, Alexopoulos, Kindermann, Kakuma, Brown and Young1998; Kindermann et al., Reference Kindermann, Kalayam, Brown, Burdick and Alexopoulos2000) but not all (Kraiuhin et al., Reference Kraiuhin1990) investigations. Some authors found that P300a latency in older depressed patients correlated with risk factors for vascular disease (Kalayam et al., Reference Kalayam, Alexopoulos, Kindermann, Kakuma, Brown and Young1998). Others found no correlation between P300a amplitude or latency and structural brain changes including subcortical brain lesions (Dahabra et al., Reference Dahabra1998).
Aims of the present study
In this study, we aimed to replicate electrophysiological markers of (late life) depression and to study their potential neuroanatomical basis. Therefore, differences in power spectral analyses, CNV and PINV magnitude, and P300a amplitude and latency between older patients with major depression and healthy controls were measured and correlated with neuropsychological testing and structural brain changes (total brain volume and ratings of white matter hyperintensities). We recently reported on the neuropsychological deficits of this sample and found a relationship between memory and executive deficits and white matter changes but not whole brain volume (Köhler et al., Reference Köhler, Thomas, Barnett and O'Brien2010a; Reference Köhler, Thomas, Lloyd, Barber, Almeida and O'Brien2010b). In earlier work we also found close associations between white matter changes and processing speed (O'Brien et al., Reference O'Brien2002). We hence hypothesized that (a) patients would exhibit changes in electrophysiological processes including less fast-wave (i.e. alpha and beta) and more slow-wave (i.e. delta and theta) activity, lower CNV magnitude and P300a amplitude, higher PINV magnitude and prolonged P300a latencies; and (b) that these changes would relate to structural brain changes, especially white matter hyperintensities.
Methods
Subjects
Case ascertainment has been described elsewhere (Köhler et al., Reference Köhler, Thomas, Lloyd, Barber, Almeida and O'Brien2010b). In brief, 66 patients aged 60 years or older who fulfilled DSM IV criteria for major depression were recruited from inpatient and outpatient old age psychiatry services. A control group (n = 36, also all over 60 years of age) without past or current depression were recruited from community sources. Exclusion criteria for both groups were: history of prior cognitive impairment; history or evidence of stroke or transient ischemic attack; severe or unstable physical illness; Cambridge Cognitive Examination (CAMCOG; Roth et al., Reference Roth, Huppert, Mountjoy and Tym1999) score of <70; history or current substance/alcohol abuse; long-term use (>2 months) of steroids during lifetime; use of steroid or other medication within the last three months thought to interfere with HPA axis; standard electroconvulsive therapy in last three months; use of medication thought to affect cognition (e.g. use of benzodiazepines, except short-acting ones solely used as hypnotic, antipsychotics, sedative tricyclic antidepressants or anticholinergic medication); presence of other neurological diagnosis. Use of other antidepressants (e.g. SSRIs and venlafaxine) and lithium was permitted. The study was approved by the local ethics committee, and after complete description of the study, all patients and controls gave written informed consent.
Assessment
Depression was diagnosed according to DSM-IV criteria and symptom severity was rated using the MADRS (Montgomery and Åsberg, Reference Montgomery and Åsberg1979). An extensive neuropsychological test battery was administered to consenting participants. Episodic memory was assessed with the Rey Auditory Verbal Learning Test (AVLT) (Rey, Reference Rey1964). Executive functions were measured with the FAS verbal fluency test, a task sensitive to frontal lobe impairment, Trail Making Test (TMT), a test of mental flexibility and divided attention (Lezak et al., Reference Lezak, Howieson and Loring2004), and the Stroop Color Word Test (SCWT), a test for response inhibition and selective attention (Stroop, Reference Stroop1935). A computerized continuous performance task (VIGIL) assessed vigilance and information processing speed (Cegalis and Bowlin, Reference Cegalis and Bowlin1991). Over 8 minutes, subjects have to press a button to a complex target stimulus (letter K when preceded by the letter A), presented 100 times within a total of 480 stimuli (displayed serially in a pseudo-random fashion). In the present study only VIGIL response latencies (in msec) were used as a measure of behavioral processing speed.
EEG protocol and analysis
EEG measurements were conducted with the subjects in a separate quiet room in communication with a control room via a one-way glass window and an intercom system. To be included, subjects had to have sufficient hearing to hear at a normal conversational volume, which resulted in the exclusion of six individuals. Electrophysiological activity was recorded from silver/silver chloride gel-filled electrodes with impedance below 2 KΩ. Signals were amplified (Biodata PA400 amplifier) and interfaced with a Biodata Microlink III Data Acquisition System (IEEE 488) located in an Elomex PC to a computerized data acquisition and analysis package. Electrode positions were Fz, Cz, Pz, F7, F8, T3, T4, O1, O2, T5, T6. F3. F4. C3, C4, P3, P4, all referred to linked mastoids. Eye movements were minimized by asking the subjects to fixate on a mark on a screen in front of them. Compensation for eye movements was derived from nasion-linked mastoid electrodes, and any sections of the EEG record still contaminated with eye movements, muscle activity or any other artefacts were excluded from the analysis.
For the CNV, subjects were presented through earphones with a series of 10 paired signals: a warning tone (S1, 1000 Hz, 200 msec, 60 dB) and an imperative tone (S2. 650 Hz, 500 msec, 60 dB) to which they were asked to respond by pressing a button. The S1–S2 intervals were fixed at 1.25sec, but the S2–S1 intervals varied randomly between 6 and 10 sec. After averaging the response to the 10 paired signals, CNV magnitude (μVsec) was calculated from the area of negativity between the responses to S1 and S2, the baseline for which was calculated from the pre-S1 section. The PINV (μVsec) following each S2 was calculated from the area of negativity extending from S2 for a further 1250 msec. The reaction time (RT), the time (msec) between S2 onset and the subject pressing the button was measured for each response and the mean RT calculated for the series of 10 signal pairs.
To elicit the auditory P300a, a sequence of 120 tones was presented through earphones every 1.5 sec in an “oddball” paradigm consisting of 100 frequent tones (1000 Hz, 200 msec, 60 dB) and 20 randomly inserted rare tones (650 Hz, 200 msec, 60 dB). Subjects were asked to count mentally the number of rare tones in the sequence. We calculated the amplitude (μV) and latency (msec) of the late components (N2 and P300a) of the auditory evoked potentials by subtracting averaged responses to frequent and rare tones and peak-to-peak amplitude of the N2-P300a waves and P300a latency in response to rare tones was measured.
Power frequency spectra of resting EEGs were calculated by fast Fourier transform of the average of 25 × 2-sec epochs of resting EEG (eyes open and eyes closed). Totaled power, expressed as μV2/Hz, was calculated in the delta (0–3.5 Hz), theta (4–7.5 Hz), alpha (8–14 Hz), and beta (14.5–35 Hz) frequency bands.
MRI scanning protocol and analysis
As described previously (Lloyd et al., Reference Lloyd, Ferrier, Barber, Gholkar, Young and O'Brien2004; O'Brien et al., Reference O'Brien, Lloyd, McKeith, Gholkar and Ferrier2004), images were acquired using a 1.0 Tesla Siemens Magnetom Impact Expert System (Siemens Medical, Erlangen, Germany). Whole brain T1-weighted three-dimensional magnetization prepared rapid-acquisition gradient echo (3D-MPRAGE) turbo flash data sets were acquired in the sagittal plane (repetition time: 11.4 msec, echo time: 4.4 msec, inversion time: 400 msec, flip angle: 15°, matrix: 256×256, slice thickness: 1 mm, cubic voxels of 1 mm) resulting in truly isotropic voxels of 1×1×1 mm for optimal gray-white matter contrast. Axial dual spin echo sequences were also obtained to yield proton density and T2 images. Proton density and T2 images were yielded from RARE (rapid acquisition with relaxation enhancement) technique dual echo (TR = 2800ms, TE14(PD) ms / 85(T2) ms, matrix 256 × 256, field of view 230mm, pixel size 0.92 × 0.92 mm, acquisition time 4 minutes 13 seconds) sequences with axial slice thickness 5mm and 0.5mm gap. For volumetric analyses, T1 images were then transferred to a Sun Ultra 10 work station running Solaris 2.7 (Sun Microsystems, Mountain View, CA). Whole brain volume was analyzed by a semi-automated iterative process of erosion and region-growing. White matter hyperintensities were rated visually from the axial dual echo scans by two experienced raters using the well-established Scheltens scale (Scheltens et al., Reference Scheltens1993). This can provide a measure of overall severity of white matter hyperintensities by summing scores for the four regions covered by the scale (periventricular, deep white matter, basal ganglia and infratentorial) on the rating scale. Magnetic resonance imaging (MRI) images could be successfully analyzed in 35 (97%) controls and 51 (76%) patients.
Statistical analysis
All measures of EEG power spectra, the CNV and PINV magnitude and P300a amplitudes failed tests of normality and were therefore normalized by a log-normal transformation. Differences between patients and controls in background EEG and in ERPs were analyzed using repeated measures ANCOVA with electrode site (Fz, Cz, Pz,) as the within-subject factor, group (controls, patients) and sex (male, female) as between-subject factors, and age as a covariate. Potential associations and moderations of EEG results by total brain volume and WMH were analyzed by testing the interaction-effect between these measures and group on the electrophysiological signal, followed by group-stratified analyses of the effect main of WMH or total brain volume within each group. Scatter plots were drawn to check for influential cases. All analyses were run in SPSS 16.0 for Mac.
Results
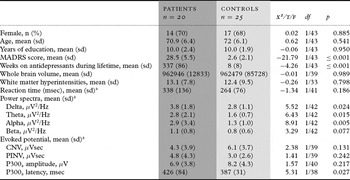
Power spectral analyses as well as measures of CNV, PINV, and P300a amplitude and latency could be obtained from 20 patients and 25 controls. Their characteristics are shown in Table 1. Groups did not differ with regard to gender, age and years of education. For 16 patients and all controls, total brain volumes could be analyzed, and for 17 patients and 18 controls we had ratings of white matter hyperintensities. There were no group differences on these measures. As expected, patients had significantly higher total MADRS scores (p ≤ 0.001) than controls. During the oddball task, 24 (96%) controls and 16 (84%) patients correctly identified at least 95% of the target (infrequent) tones, a difference that was not statistically significant (χ2 = 1.82, df = 1/42, p = 0.178).
Sample characteristics, means for resting EEG activity (condition: eyes open, averaged over the midline sites) and measures of evoked potentials in patients and controls, and tests for differences between groups

CNV = contingent negative variation, PINV = post-imperative negative variation.
a Means and standard deviations refer to raw values. With the exception of P300a latency, all tests for group differences were, however, run on the log-normal transformed values due to non-normality.
Power spectral analyses
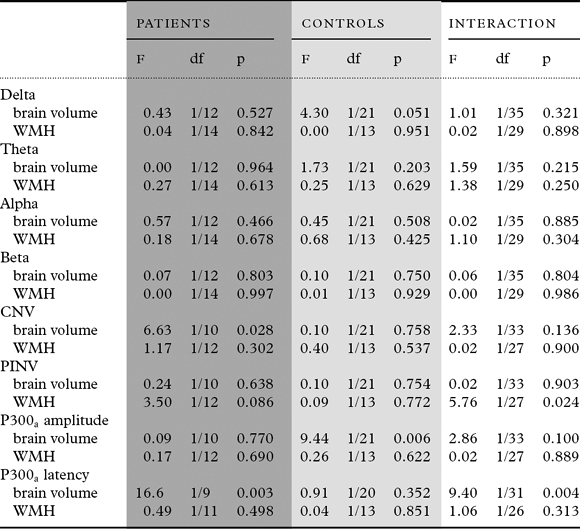
In patients, spectra frequencies were independent of current symptom severity (for delta band: F1/16 = 013, p = 0.720; theta: F1/16 = 0.00, p = 0.966; alpha: F1/16 = 0.01, p = 0.920; beta F1/16 = 0.00, p = 0.993). Lifetime duration of antidepressant use had an affected on alpha band frequency (F1/16 = 4.71, p = 0.045), but not on the other bands (delta: F1/16 = 0.13, p = 0.720; theta: F1/16 = 1.53, p = 0.235; beta F1/16 = 1.57, p = 0.228). Table 1 shows group means (raw values) and analyses for the log-normal transformed frequency band powers. Adjusted for age and gender, patients had significantly greater slow-wave (delta: p = 0.024 and theta: p = 0.015) and alpha activity (p = 0.005) than controls. Differences in the beta band activity did not reach significance (p = 0.077). Furthermore, no effect of total brain volume or WMH interactions was observed for either group (Table 2).
Associations between log-normal transformed resting EEG activity or evoked potentials and total brain volume or extent of white matter hyperintensities (WMH) for patients and controls separately, and tests for the interaction by group
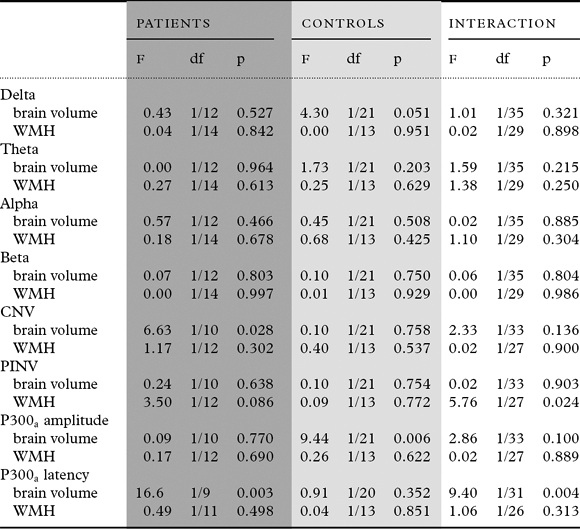
CNV = contingent negative variation, PINV = post-imperative negative variation.
Event-related potentials
In patients, there were no significant associations with current symptom severity for CNV (F1/13 =0.21, p = 0.655), PINV (F1/13 = 1.50, p = 0.242) or P300a latency (F1/13 = 0.35, p = .562), but those with higher symptom levels had lower P300a amplitudes on average (F1/14 = 7.30, p = 0.017). As shown in Table 1, there were no overall group differences between patients and controls in reaction time to S2, CNV, PINV and P300a amplitude, but patients exhibited significantly prolonged P300a latencies compared with controls (p = 0.027), reflecting longer stimulus evaluation time. Significant interactions by group were found for WMH on PINV (p = 0.024) and for total brain volume on P300a latency (p = 0.004) (Table 2). So, increasing WMH resulted in larger PINV in patients but not controls (a finding that was however not statistically significant when we stratified for group), and patients’ (p = 0.003) but not controls’ (p = 0.352) P300a latencies declined with increasing brain volume. Despite non-significant interaction (p = 0.100), analyses stratified for group suggested that controls’ P300a amplitude increased with increasing brain volume, while this was not seen in patients. This latter finding did not change after controlling for the significant confounding effect of current symptom severity on patients’ P300a amplitudes (effect of brain volume after additional adjustment for MADRS score: F1,8 = 0.01, p = 0.924). For CNV, the test for interaction was also statistically inconclusive (p = 0.136), but stratified analyses suggest that CNV increased in patients (p = 0.028) but not in controls (p = 0.758) with increasing brain volume.
Discussion
In the present study, we found that patients with late life depression showed electrophysiological abnormalities in markers of cerebral arousal and information processing compared with non-depressed elders. Changes included more slow-wave activity and prolonged P300a latencies, echoing findings in earlier reports (Nyström et al., Reference Nyström, Matousek and Hallstrom1986; Dahabra et al., Reference Dahabra1998; Kalayam et al., Reference Kalayam, Alexopoulos, Kindermann, Kakuma, Brown and Young1998; Kindermann et al., Reference Kindermann, Kalayam, Brown, Burdick and Alexopoulos2000). Since brain volumetric changes and white matter lesions have been associated with deficits in information processing on neuropsychological testing (O'Brien et al., Reference O'Brien2002; Sheline et al., Reference Sheline2008; Köhler et al., Reference Köhler, Thomas, Lloyd, Barber, Almeida and O'Brien2010b), our results are important by showing that such associations can be traced to a neuronal level by studying the relation between structural brain changes and evoked potentials.
Increases in slow-wave activity in the delta and theta band were independent of depression severity or duration of antidepressant treatment. They are generally believed to reflect decreased cortical arousal and have been found in depression as well as Alzheimer's dementia (Nyström et al., Reference Nyström, Matousek and Hallstrom1986). Although one might for this reason expect them to correlate with brain atrophy, we found no associations with total brain volume. Since we have reported similar negative findings before (Dahabra et al., Reference Dahabra1998), this suggests that abnormalities in slow-wave activity are more likely to stem from damage to subcortical structures or more subtle neurochemical changes in neurotransmitter functioning within the pathways relevant for cortical arousal and attention.
Except for P300a latencies, event-related potentials showed no significant differences between patients and controls at a group level, yet several dissociations existed with neurostructural measures. So, CNV magnitude increased in patients but not controls with increasing brain volume, indicating that in some patients, atrophic changes seem to lead to lower level of attention or state of readiness. PINV magnitude seemed to correlate with WMH severity in patients only. PINV magnitude has been shown to increase in situations in which stressor controllability is low and task-induced ambiguity is high (Rockstroh et al., Reference Rockstroh, Elbert, Lutzenberger and Birbaumer1979). In such situations, depressed patients have been found to engage frontal areas to resolve such ambiguity (Diener et al., Reference Diener, Kuehner, Brusniak, Struve and Flor2009). Although speculative, disruptions of fronto-striatal white matter tracts in subjects with cerebrovascular disease might lead to high levels of post-decision uncertainty about the appropriate response. Since the effect in the patient group was significant only at a trend-level, this finding requires replication in future studies. Next, P300a amplitude increased with increasing brain volume in controls but not in patients. Since P300a was influenced by patients’ depression severity, this might have hidden more subtle associations with volumetric changes in the present study. Indirect evidence for this is the finding that P300a latency scores did correlate with overall brain volume, but not WMH, pointing towards a global structural process underlying changes in the P300a complex. Prolonged stimulus evaluation time might compensate for neuronal loss by recruiting alternative pathways. This is consistent with the idea that P300a latency relates to cognitive ability and hence decreases as children develop but increases with progressing dementia (Polich, Reference Polich2007). Thus, we did not find support for a relation between patients’ P300a latencies and cerebrovascular disease as suggested by others (Kalayam et al., Reference Kalayam, Alexopoulos, Kindermann, Kakuma, Brown and Young1998).
Some methodological aspects have to be considered carefully when interpreting our findings. First, not all subjects with EEG recordings also had an MRI scan. Especially in the patient group, this resulted in reduced sample size and therefore a probable lack of power in stratified and interaction-analyses. It is possible that we therefore have missed some more subtle associations between total brain volume or WMH and electrophysiological signals. A small sample size also increases the risk of spurious findings, e.g. due to influential cases. Visual inspection of scatter plots, however, did not suggest this to be the case and we are therefore confident that our results are robust. In addition, as is normal in studies of this kind, there was substantial intra-individual variability in the signal strength across electrode site. We tried to circumvent this problem and the associated question of which electrodes to select for analysis, by treating electrode site as a within-subject factor in a repeated measure design. MRI scans could not be analyzed in 18 patients and this could have influenced the findings if these would have represented atypical cases. A sensitivity analysis, however, found no differences in age, gender, years of education or any EEG measurement between patients with and without MRI scans (data not shown). Finally, we did not assess auditory acuity by formal audiology tests, though intact hearing is crucial for our ERP paradigms. Reasonable effort has, however, been made to exclude those subjects with problems in hearing sounds at normal conversational volume and subjects were asked whether they encountered any hearing difficulties during EEG recording. Two subjects from the healthy comparison group answered this positively, but excluding these from the statistical analyses had only marginal effects (contrasts with the patients group were amplified). Notable strengths of this study involve the use of an age-matched healthy control group; automated peak detection followed by eyed-on inspection and corrections by an experienced electrophysiologist as appropriate; and MR data acquisition.
In conclusion, we found that patients with late life depression showed changes in several electrophysiological markers of cerebral arousal and information processing. These changes related to overall brain volume reductions and magnetic resonance markers of cerebrovascular disease. Older depressed patients have further been found to have an increased dementia risk and both vascular and degenerative changes, alone or in combination, might promote this development (Butters et al., Reference Butters2008). Our findings thus add further evidence to the clinical relevance of structural abnormalities in late life depression and advocate that patients should be monitored for such changes in order to prevent further deterioration or initiate early treatment.
Conflict of interest
None.
Description of authors' roles
Dr. Köhler performed the statistical analyses, interpreted the results and wrote the first draft; Dr. Thomas and Dr. Ashton formulated the research questions and interpreted the results; Mr. Marsh performed the EEG measurements and wrote the programs used; Mrs. Barnett collected the data; and Dr O'Brien designed the study, supervised data collection, formulated research questions and interpreted the results. All authors contributed equally to the final manuscript.
Acknowledgments
We thank the Wellcome Trust and the Stanley Foundation for financial support, Philip English for expert radiographic support, Bob Barber for ratings of white matter lesions, Adrian Lloyd for whole brain analyses, and Liz McGuckin for help with subject recruitment and assessment.