

The people, however, who build political parties are politicians. They are keenly desirous of public office, an honorable ambition, perhaps the most honorable of all ambitions. Only through the clash of such ambitions can the ideals of democracy be approached. (Key Reference Key[1949] 1984, 297, Southern Politics)
Introduction
Electoral institutions set incentives and frame choices for ordinary voters, politicians, bureaucrats and policy advocates – for every participant at every point in the policy-making process in a democratic society. Preferences over policy outcomes in any particular policy domain should generate preferences over system-wide election rules, so long as scholars can provide some guidance about the likely impact of the different types of election procedures.Footnote 1 In the United States (US), elections take place using a dizzying variety of institutions because each state has considerable latitude in setting its own election laws. Most US elections take place in two stages, a primary election followed by a general election.Footnote 2 Washington (state) and California recently adopted by ballot measure a nonpartisan (“top-two”) election procedure, intended to disrupt the operations of major party coalitions. We adapt the Advocacy Coalition Framework (ACF) (i.e. Sabatier and Jenkins-Smith Reference Sabatier and Jenkins-Smith1988; Weible et al. Reference Weingast, Shepsle and Johnsen2009) to test if the greatest political impact of this election type occurs in places likely to have the greatest policy consequence as well. We find that the new election procedure has a predictable and disparate impact across political districts, generating new coalitional opportunities.
The nonpartisan top-two election procedure, as used in California and Washington, is a radical departure from the types of elections used in most states.Footnote 3 A typical election in the US uses some kind of partisan primary procedure: candidates and voters are separated into groups by party and the following general election includes the winners of each party’s primary.Footnote 4 Office-seeking candidates attach to parties because the “brand names” are helpful: in the general election “partisans vote for their preferred party’s candidates until and unless given good reasons not to” (Aldrich Reference Alvarez and Sinclair1995, 49; referencing in part Key Reference Key1966). Partisan primaries are a way for candidates sharing roughly the same general policy orientation to sort out who will represent their coalition in a contest against the other side. The activities of the party as a whole – a large coalition of people with many roles, often thought dominated by “intense policy demanders” (i.e. Bawn et al. Reference Bawn, Cohen, Karol, Masket, Noel and Zaller2006; Cohen et al. Reference Cohen, Karol, Noel and Zaller2008) – reflect an attempt to solve problems of coordination and collective action.
The nonpartisan top-two election procedure in some circumstances interferes with the normal operation of political parties by leaving voters with two alternatives but only one party in the general election. With this procedure, all voters may select between all candidates in the first, primary, round; the two candidates with the most votes in the primary then go on to compete in the second round, the general election, even if they happen to be from the same party. Of course, in many cases the general election stage in an election using the nonpartisan top-two procedure will be very similar to traditional crossparty general elections (i.e. a Republican facing a Democrat), with the candidates separated by substantial differences in deep core beliefs. Nevertheless, it is possible that two candidates of the same party will advance to produce a copartisan general election. Copartisan general elections force the candidates to compete for votes without meaningful party cues to guide voters, potentially providing new opportunities and new incentives for the varied participants and policy-demanding groups. For the stability of a policy coalition (organised into a political party) to be disrupted, it is likely necessary for these copartisan elections to occur in a predictable way, although not necessarily with predictable coalitional splits into moderates and ideologues.
Research focussed on voter behaviour, particularly grounded in a one-dimensional spatial model, has missed the importance of the opportunities copartisan elections present. Large-scale strategic voting could be one potential pathway for the nonpartisan primary to change outcomes; however, scholars working in this area have found little evidence of this.Footnote 5 Nevertheless, there are other ways for the nonpartisan top-two election procedure to matter: the ACF highlights the opportunities this type of election produces for groups to work together in a way that threatens the stability of policy coalitions with any given domain. While parties and elections have loomed in the background of the ACF, most prior applications do not focus on the details of electoral politics. In an example focussed on air pollution, in the context of normal partisan primaries, it need hardly be said which party can safely be assumed to be associated with a coalition of “environmental and public health groups” (as in Jenkins-Smith and Sabatier Reference Jenkins-Smith and Sabatier1994, 180). Nevertheless, the ACF applies to a whole host of policy domains, domains with considerable disagreement within these larger coalitions about the implementation of lower tier beliefs. Furthermore, some policy domains are not necessarily organised in ways that match the prevailing orientation of partisan politics. The incentives in a copartisan general election may make new players relevant and scramble, or at least destabilise, existing relationships. When copartisan general elections occur in districts not competitive between parties, segments of the electorate that have previously been irrelevant, and the elite policy participants associated with them, can suddenly tip the electoral balance.
The ACF provides a theoretical framework for understanding why systematic patterns of copartisan elections are policy-relevant even if such elections are not always “moderates” against “ideologues”. This also further develops the ACF by more explicitly considering the problem of nesting domain (or subsystem) coalitions inside of the bigger coalitions that are political parties. Our quantitative results support our expectations that the copartisan elections do occur in places where parties are otherwise strong. Other scholars who have noted similar relationships – although not tested competing explanations as rigorously as we do here (McGhee and Krimm Reference McGhee2012; Alvarez and Sinclair Reference Sinclair2015) – have also focussed on the failure of the rule to oust more incumbents, “key targets of the reform”, or clearly establish dominance of readily identifiable moderates (McGhee and Krimm Reference McGhee2012). From the perspective of the ACF, however, the conflict provides openings in a more multidimensional and layered world of policymaking for different advocates to have their voices heard.
Primary elections and the ACF
The current literature on primary elections in political science remains in an unsettled state. The nonpartisan top-two election procedure, although impacting both the primary and the general election, has most widely been studied in the context of other primary election innovations. The field itself sits at the intersection of distinct research agendas on political parties, voter behaviour, presidential elections, formal electoral models and social choice theory, work on the measurement of political ideology of candidates, and the functioning of other bodies like congress and state legislatures. As John (Reference John2012, 2–4) argues, the field of public policy emerged as something distinct from other subfields in part to provide a necessary overarching picture from voters through the whole of the political institutions to the final policy results.Footnote 6 The ACF is a remarkably flexible tool for imagining how different parts of the policy process can be important – in ways that may have escaped scholars focussed more narrowly in the primaries literature oriented more towards the study of voter behaviour.
Primary rules diminished by parties
Research into the relationship between different partisan primary types and the ideology of winning candidates has not produced meaningful and consistent results, leading some scholars to conclude that parties are sufficiently strong organisations as to render the rules irrelevant. The nonpartisan top-two election procedure is strongly associated with claims of ideological moderation, particularly in California, because it was pitched as an anti-party reform (i.e. McGhee Reference McGhee2010) with a particular emphasis on ejecting incumbents who behaved in an unreasonable manner (McGhee and Krimm Reference McGhee2012). The focus on different variations of partisan primaries in the literature tilted the initial research on the top-two towards voter behaviour at the primary stage of the new procedure, with results largely disappointing to reform advocates. Although views vary, most focus on the claims of the reform’s supporters rather than a more general question: what opportunities do these rules present participants in the policy process?
Partisan primary systems are sorted by their openness – the extent formal registration or affiliation barriers block voters from picking a party on election day. Typically: closed, semiclosed, semiopen, open, nonpartisan/blanket (Gerber and Morton Reference Gerber and Morton1998; Kanthak and Morton Reference Kanthak and Morton2001; McGhee et al. Reference McGhee and Krimm2014). A closed primary limits participation to voters registered with the party whereas a semiclosed primary allows registered independents to take part. In contrast, an open primary allows all voters to choose a party (for the entire ballot) on election day. A blanket primary preserves the partisan structure for candidates but voters could switch parties as they moved through the ballot (“more open than open!”); California Democratic Party v. Jones declared the blanket primary a violation of a party’s associational rights. The nonpartisan top-two, the successor to the blanket primary, fits even more awkwardly into these categories because it has a feature – the possibility of copartisan general elections – simply not present in any of the other types, including the blanket primary.
The back-of-the-envelope political theory used to generate testable predictions for primary type and ideology has typically suggested increasingly open primaries will produce increasingly moderate results. However, this assertion is not well-supported by the formal theory literature (i.e. see this point raised in McGhee et al. Reference McGhee and Krimm2014). The conclusion from McGhee at al. remains the dominant argument in the field: “these systems have little consistent effect on ideology …” and any observed effects are “dwarfed by the considerably larger average gap between the two parties …” because of the explanations given in “recent theories of parties” (Reference McGhee and Krimm2014, 347–348). If candidates need resources to run for public office and parties (formally, or through “informal party organizations”) can provide them, then candidates must win the “invisible primary” to obtain the party resources (Cohen et al. Reference Cohen, Karol, Noel and Zaller2008; Masket Reference Masket2011). In short, there are not enough voters willing to cross party lines for most types of partisan primaries to produce different results by enabling or disabling any particular feature; even in the most extreme version of an open primary, the blanket primary, a voter-built grand coalition of the centre did not regularly appear (see Cain and Gerber Reference Cain and Gerber2002). The research on other primary election types set up the academic expectations for the nonpartisan top-two election procedure; Masket summarised this view neatly as, “I’ve written a good deal on this topic, so let me try to sum up my answer to the question of whether the top-two primary system will reduce partisanship: Probably not” (Reference Masket2013).
From the perspective of voter behaviour, there seems to be an emerging consensus that much of what was true about partisan primaries holds for the nonpartisan election procedure – at least in California, on which most of this research is centred. Ahler et al. (Reference Ahler, Citrin and Lenz2016), Alvarez and Sinclair (Reference Sinclair2015) and Nagler (Reference Nagler2015) find voters disinclined to take advantage of the ability to vote for moderate candidates. Hill (Reference Hill2015) also finds that the composition of the electorate remained the same before and after reform. Worse still, Kousser et al. (Reference Kousser, Lucas, Masket and McGhee2016) find that candidates did not represent themselves differently. In the face of this evidence – nothing different for the candidates, nothing different for the primary voters – it should not be surprising that many commentators conclude that there is nothing interesting about the nonpartisan election procedure at all.
There are some dissenting views, centred on the role of the copartisan general elections. Sinclair and Wray (Reference Sinclair and Wray2015) find increased search for information about candidates in copartisan, rather than traditional crosspartisan, races, suggesting a mechanism that might advantage moderate candidates in a copartisan general election. That would be consistent with the argument in Alvarez and Sinclair (Reference Sinclair2015) and Sinclair (Reference Sinclair2015): if a more centrist candidate can make it to a copartisan election against a less centrist candidate, the Downs (Reference Downs1957) spatial reasoning kicks in. They argue that in some districts copartisan elections resulted in the election of a more centrist candidate who likely would have lost in the older partisan primary. Hill and Kousser (Reference Hill and Kousser2016) also conducted a field experiment on turning out more unaffiliated voters, pointing out that changes in campaign behaviour might change outcomes. Nagler’s (Reference Nagler2015) concern that voters might skip copartisan elections absent a candidate from their own party and Kousser et al.’s (Reference Kousser, Phillips and Shor2015) work on the role of party endorsements sound a cautionary note. The question is: do these copartisan elections largely occur randomly or do they occur in some systematic way? And if they do occur in some systematic way, how might that influence the policy process?
The accumulated evidence suggests that voters in the primary are not coming together to act like a new centrist party. There is some evidence that when copartisan elections do happen voters from other parties are left without any choice but to select the more centrist candidate (as argued in Alvarez and Sinclair Reference Sinclair2015) or to abstain (as Nagler Reference Nagler2015 cautions they may do). Grose (Reference Grose2014) identifies (very early) moderation in the California legislature; McGhee (Reference McGhee, Masket, Shor, Rogers and McCarty2015) observed a potential impact for Democrats (but not Republicans) in the California legislature on receptiveness to the Chamber of Commerce’s agenda. Nevertheless, these results are not as of yet demonstrated to be of any great magnitude in a one-dimensional ideological space. The ACF provides a different rationale for scholarly interest in the patterns of copartisan elections.
Advocacy coalitions and elections
A copartisan general election can generate a confluence of interests perhaps unexpected in other political circumstances: the Chamber of Commerce and a liberal Democrat, a union and a conservative Republican. While those sorts of big coalitional realignments are possible with the nonpartisan primary, and represent truly a new policy opportunity structure, policy scholars have highlighted just how many less salient areas of policymaking are both important and operating as distinct policy “subsystems” – for example, the politics of marine protected areas in California (Weible Reference Weible, Sabatier and McQueen2007). This framework originated with Sabatier and Jenkins-Smith’s observation that the literature on policy analysis “developed largely independent of the literature in political science on the factors affecting the policy process” (Reference Sabatier and Jenkins-Smith1988, 123). Political scientists and policy scholars, particularly those with expertise in particular domains, could benefit from intellectually reconnecting in the context of an imminently practical heuristic for thinking about both fields; the resulting framework has proved both durable and flexible. Weible et al., in a summarizing essay, identified “more than 80 applications of the framework spanning nearly 20 years” (Reference Weingast, Shepsle and Johnsen2009, 122), although some aspects of the framework have been largely neglected. Critically, the level of subsystem observation of the ACF is sufficiently detailed as to make the coalitions not always the central players in the main political drama, especially when it comes to resolving within coalition disagreement about lower tier policy: petroleum exploration, Marine Protected Areas or the application of religious principles in US public schools (see Jenkins-Smith and Sabatier Reference Jenkins-Smith and Sabatier1994; Weible Reference Weible2005, Reference Weible, Sabatier and McQueen2007; Lugg and Robinson Reference Lugg and Robinson2009). Diving deeply into these specific issue coalitions left some aspects unexplored in adequate depth – the persistence of coalitions given the types and interests of beneficiaries, effects on coalitions of estimates of opponent strength, and consequences for coordination based on repeated interaction and information costs (Weible et al. Reference Weingast, Shepsle and Johnsen2009, 129). This is interesting because activity takes place in all these policy subsystems at once and, even within one party coalition, these networks have to scramble for attention, resources and support. We argue here that the disparate effects across political districts of the nonpartisan top-two election rearrange coalitional opportunities for important policy issues that may not be as salient as something like the agenda of the Chamber of Commerce (McGhee Reference McGhee, Masket, Shor, Rogers and McCarty2015).
While the ACF has developed over time, and seen adaptation to a number of contexts, the basic outlines of the framework are fairly simple (c.f. Jenkins-Smith and Sabatier Reference Jenkins-Smith and Sabatier1994, 181; Weible et al. Reference Weingast, Shepsle and Johnsen2009, 123). Within a particular policy domain (which they term a subsystem), we tend to observe two coalitions. These coalitions are described by hierarchies of belief, ranging from deep core beliefs (the most fundamental and difficult to alter, but also not very specific) to policy core beliefs (“of moderate scope and span the substantive and geographic breadth” – Weible et al. Reference Weingast, Shepsle and Johnsen2009, 122) to secondary beliefs that are quite susceptible to change. One can imagine, for example, a person of a deeply conservative orientation, with policy beliefs generally aligned with shrinking the scope of government activity and reducing taxes, and, as an expression of the lowest tier of belief, a preference that the top tax rates each drop by 3%. As a practical matter, it is often the case that these policy domains then split into two camps, where the expression of the lower tier of beliefs may be a function of the resources and strategic decisions taken within each coalition. Overall, one coalition actually controls the formal decision-making power (to some greater extent than the other side); those decisions ultimately are translated into policy outputs and impacts. Within the policy domain, there may also be policy brokers: “conflicting strategies from various coalitions are normally mediated by a third group of actors … whose principal concern is to find some reasonable compromise” (Jenkins-Smith and Sabatier Reference Jenkins-Smith and Sabatier1994, 182).
A standard feature of the ACF involves some kind of feedback over time. So policy outputs influence everything ranging from “external system events” to the “relatively stable parameters” (such as the constitutional arrangements) to the “long-term coalition opportunity structures” and “short-term constraints and resources” (Weible et al. Reference Weingast, Shepsle and Johnsen2009, 123). The ACF emphasises much longer time-horizons for policy work than may be common in the analysis of institutional changes in much of political science: “by adopting a time-span of a decade or more, by focusing on the belief systems of policy elites, and by examining the conditions under which analysis is likely to change those beliefs, the framework attempts to incorporate the ‘enlightenment function’ into an overall understanding of the dynamics of policy-oriented learning and the role that such learning plays in changes in public policy over time” (Sabatier and Jenkins-Smith Reference Sabatier and Jenkins-Smith1988, 124). In the context of electoral institutional change, the relevant short-run question is: does the new rule change the incentives for parts of the coalitions or for the policy brokers?
The subsystem actors are nested in a political system dominated by two large coalition political parties. Exploring differences between parties (generally) and coalitions (in the ACF) adds a level of concrete attention to an area left quite vague in many ACF studies. In Aldrich’s (Reference Alvarez and Sinclair1995) view, political parties are endogenously formed organisations, supported by formal and informal institutions, in the business of winning elections and making policy. The familiar tripartite description of a party – the party-in-the-electorate, the formal party organisation and the party-in-government (see Fiorina Reference Fiorina2002) – highlights different institutional contexts for party activity; across levels there are certainly identifiable shared types of beliefs within parties. Nevertheless, these may be only partly shared in some union of sets of beliefs tied together by the need to build a party “coalition” large enough to win public office, potentially including a number of meaningful divisions or disagreements about even these deep core beliefs. At the national level, mirrored in fierce disagreements in state-by-state contests, the 2016 presidential primaries helped to reveal these divisions with both the Democratic and Republican parties. The brokers both within and between parties (who seek to make compromise and implement policy change) play a role in producing policy proposals (in terms of platforms, legislative outputs and so on) that hold coalitions together enough to govern, although within parties this can often be quite difficult.
Schlager highlighted the need for policy scholars to think about collective action problems: “work on policy communities, policy networks, and advocacy coalitions has been extraordinarily productive … it has generally ignored … how and whether actors address collective action problems, establish and maintain relatively stable relationships, and agree upon common strategies to pursue shared goals…” (Reference Schlager1995, 224). A large coalition, cutting across multiple policy domains (like a political party), does not meet Schlager’s (Reference Schlager1995, 264) conditions of one likely to solve the collective action problems easily; it is not obvious who the major beneficiaries will be, that the benefits received by coalition members are proportional to the costs each have paid, and that the members can monitor each other’s contributions. The difference between the “long coalition” of a political party (see Bawn et al. Reference Bawn, Cohen, Karol, Masket, Noel and Zaller2006, 4) and the coalition of the ACF is that the larger coalition must, by necessity, have a wider variety of deep core beliefs; it must somehow address the true multidimensionality of politics. When we conceptualise individuals as participants in nested (and overlapping) policy coalitions, it becomes easier to imagine how severely competition for office within the same party might disrupt or rearrange coalitional opportunities as well within the type of policy-making coalition imagined in the ACF. The new requirements for getting elected to office can reshape the ACF-type coalition’s (in one domain, so conceptualised as one dimension) deep core beliefs because some camel got its nose under the party tent to win the election (in a multidimensional space).
The “coalition opportunity structures” of the ACF can merely be reimagined as North’s (Reference North1998) web of incentives. The conventional wisdom on electoral institutions holds that Gerrymandered (or politically lopsided) legislative districts and partisan primary elections contribute to a policy environment, in many places, with only one functioning coalition. In those settings, a partisan primary can be seen as a contest over lower tiered beliefs but, since partisans (and their attendant interest groups and elites) of the other party are functionally irrelevant, the stronger coalition never needs to engage at higher levels of belief. Freudenburg and Gramling pay detailed attention to the electoral consequences of actually imposing decisions in an ACF application on oil policy: “those who are within the governing coalition might well be emboldened to move forward particularly vigorously on the basis of their beliefs – which is to say, to act as if those beliefs were in fact accurate – doing so with more brashness and less caution than might otherwise be in evidence” (Reference Freudenburg and Gramling2002, 39). This is not far from the policy concerns V.O. Key had for one-party states: “ruling groups have so inveterate a habit of being wrong that the health of a democratic order demands that they be challenged and constantly compelled to prove their case” ([Reference Key1949] 1984, 310). Parts of California and Washington certainly are quite uncompetitive between parties. V.O. Key rightly placed the direct primary as a potential “escape from one-partyism”; at least holding a party nomination contest avoided a complete “denial of popular government” (Reference Key[1956] 1966, 87–88).
If the nonpartisan primary results in regularly occurring copartisan elections in the most partisan districts in a predictable fashion, groups not previously aligned with the standard party coalitions have an opportunity to intervene in the selection of new legislators. We may not yet be able to observe major policy results; the nonpartisan procedure has only been used in Washington since 2008 and in California since 2012. Nevertheless, the ACF guides us towards what to test and how to understand the importance of these results so far. For example, that a Democrat from very liberal Santa Monica, California, owes his seat in the state legislature in part to pro-business groups is not likely to turn him into a Republican, but doors might be open that would otherwise be closed (Alvarez and Sinclair Reference Sinclair2015). As Beyers and Braun note,
… getting a foot in the government’s door is one of the core challenges for interest groups if they are to be successful in influencing public policy. While outside lobbying and media strategies are certainly important, direct access to policymakers seems to count most … direct access is often assumed to be driven by a policymaker’s demand for policy goods, such as expertise and political support … the main explanatory factor for interest group access is, accordingly, a group’s capability to produce and supply these policy goods (emphasis added, Reference Beyers and Braun2014, 93).
A copartisan general election is an opportunity for groups typically participating only in one coalition to cross over and provide political support in another. Coalition size is the important criterion, rather than easily measurable ideological differences, because size opens up opportunities for advocacy on a whole host of issues, many of which may be particularly local in origin: for example, coalitions formed around beliefs about the proper use of public space, such as a dog park at the beach (Alvarez and Sinclair Reference Sinclair2015). The lesson from the ACF is that the time horizon needs to be long to give potential coalition partners time to reshape their decisions and figure out how to operate together politically: the occurrence of copartisan elections needs to be systematic even if the rearrangement of coalitions is not the same across districts.
Testing systematic disruptions
We collected district-level data from California and Washington for 2012–2016 for state legislative offices (lower house and upper house) and US House races. Washington voted for the nonpartisan top-two election in 2004 but the implementation was delayed by court challenges until 2008 (Donovan Reference Donovan2012). California voted for the procedure in 2010, which was then used for the first time in 2012. We used the overlapping period in which the district geography remained stable and thus could capture two key partisanship measures, Democratic Party presidential vote share from the more typical presidential election in 2012 and then information about the 2016 presidential primaries to capture party disagreement. In this period, there were 240 California State Assembly, 60 California State Senate, 159 California US House, 294 Washington state House of Representatives, 77 Washington State Senate and 30 Washington US House of Representatives races for a total number of 860. The unit of observation is the legislative district: we are interested in where copartisan elections take place. Traditional crossparty elections are still the most common type of election, highlighting the disparate impact of the nonpartisan top-two election procedure. Of the 860 observations, there are 117 copartisan general elections, accounting for 13.6% of all general elections occurring at all levels.
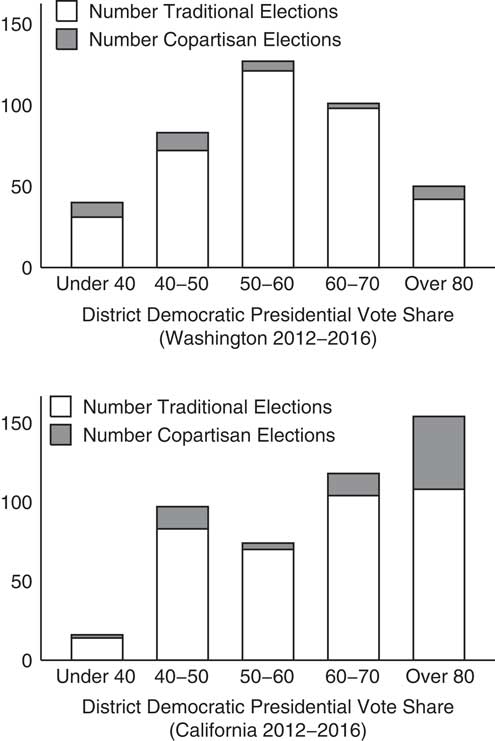
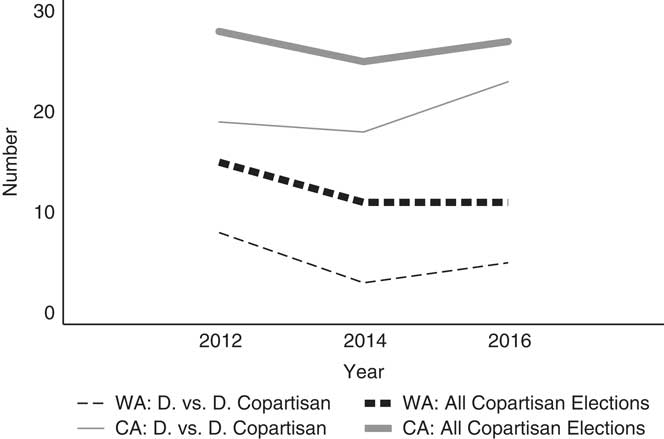
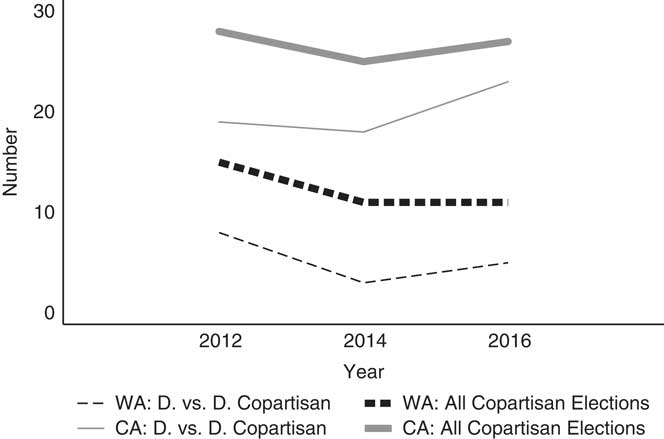
Although the copartisan elections are relatively infrequent, Figure 1 illustrates that they do tend to occur more frequently in the most partisan districts. This figure uses the two-party vote share for the Democratic Party candidate, President Obama, from 2012: this reflects a much more traditional campaign and partisan divide between Democrats and Republicans than the 2016 campaign. There are more extremely uncompetitive districts in California than in Washington; in California, it is quite common for Democrats to sail easily to victory in districts President Obama won by 60% of the vote share or more. Somewhat surprisingly, given all the other year-to-year variation (midterms, a strange 2016 election), the copartisan rate in both states is roughly the same over this three-year time span as illustrated in Figure 2. This extends the observation from McGhee and Krimm (Reference McGhee2012), among others, into two more election cycles and an additional state.
Legislative election type and partisanship in California and Washington, 2012–2016. Note: Washington features 37/401 copartisan elections; California features 80/459 copartisan elections, using 2012 presidential vote.

Frequency of copartisan legislative elections in California (CA) (153 total elections each year) and Washington (WA) (133–134 total each year) for 2012–2016.
The 2016 presidential primaries provide a window into within-district party cleavages. The situation in each party was unique but similarly contentious. On the Democratic side, supporters of Hillary Clinton and Bernie Sanders fought it out in the primaries despite little practical meaning in either: in Washington, delegates were awarded from the March 26 Caucus rather than the May 24 primary.Footnote 7 By the June primary in California, the race was in effect over. Despite this, in the typical district in both states the contest was fairly close, even if the advantage went to Clinton; in 31% of the districts in Washington, and 16% in California, Sanders had a higher vote total. The cutpoint is relevant because it indicates in which districts voters preferred the “outsider” candidate while the legislators may have felt a pull more towards the interests of the party “establishment.”
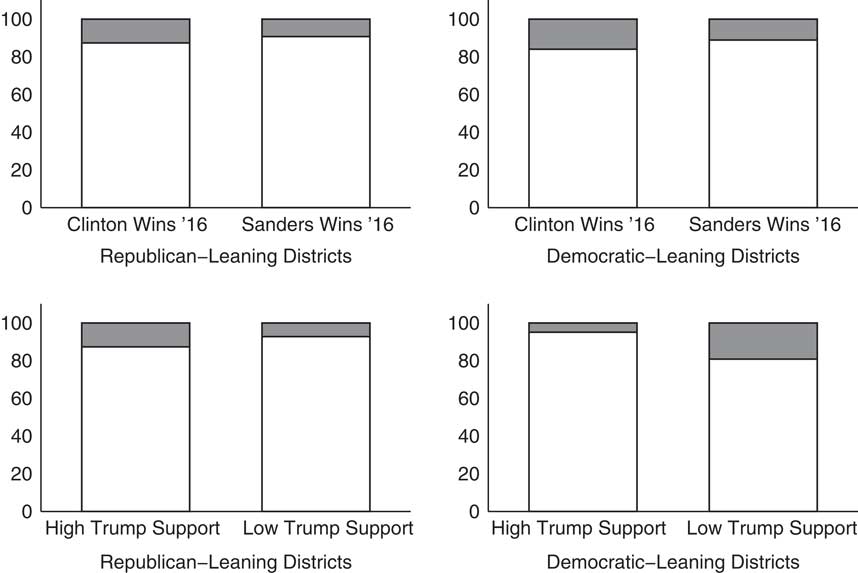
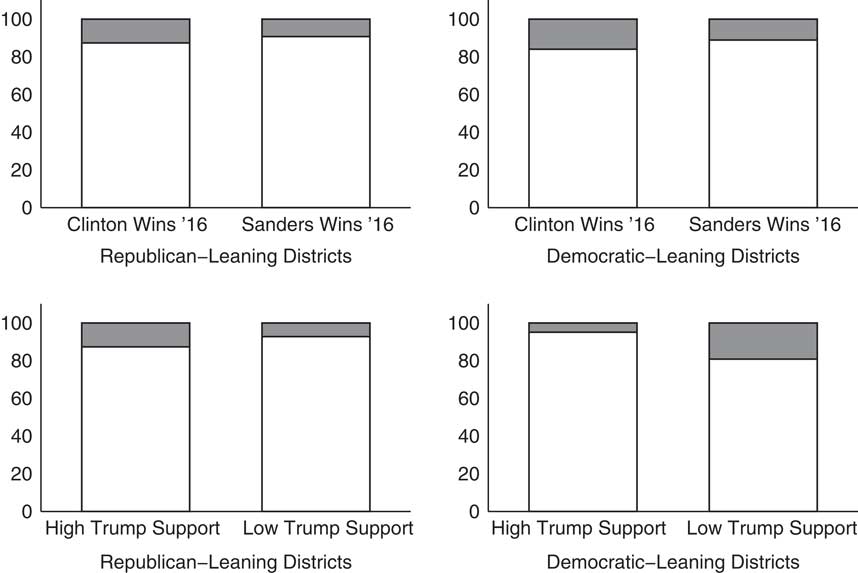
On the Republican side the relevant computation is not quite as obvious: by the time of the primaries in both states President Trump had already effectively obtained the nomination and no longer faced serious organised opposition. Republican voters could express their disapproval, however, by casting a ballot for one of the other candidates still listed, if no longer campaigning, or by staying home. We generate an indicator for whether the ratio of the Trump ’16 primary vote to the Romney ’12 general vote is below its state average. Low Trump vote suggests a district with particularly low interest or enthusiasm. Figure 3 shows the per cent of each category, sorted by the party with the greatest strength in the district, for both the Clinton and the Trump variables. Do divisions among one’s own side or divisions among the other side promote the conditions in which nonpartisan elections are more likely? The only category that visually appears interesting is the difference between low and high Trump-supporting Democratic-leaning districts: among those with low Trump support there is a greater proportion of copartisan elections.
Party splits in the 2016 presidential primary and copartisan elections, 2012–2016. Note: Shown as a proportion of observations in each category. Of the 124 Republican-leaning districts, only 22 had low Trump support. Of the 165 Democratic districts, 119 had low Trump support. Sanders won 37 or 124 Republican-leaning districts and 31 or 163 Democratic-leaning ones. Shaded region: percent of copartisan elections of total in category; using all districts 2012–2016.
We formally test our expectations, at the most general level, using a binary logistic regression for whether a copartisan election occurs or not. We have four main hypotheses tested in the model. Hypothesis 1a captures our notion that there must be enough “elbow room” for different coalitions, with differing policy-tier beliefs, to fail to coordinate on a candidate:
(H1a) Partisan Extremity: Increasing district extremity (in terms of voter party preference) should be associated with an increased probability of a copartisan election, although this effect should grow most quickly as districts cease to be competitive and then level off as districts grow increasingly out of reach.
Hypothesis 2a makes use of the 2016 presidential data.
(H2a) Partisan Extremity: Own-side divisions – low Trump support for the Republicans, or a Sanders win for the Democrats – predicting copartisan elections would suggest that these elections reflect divisions in the majority party. A strong vote for the less compromising candidate on the party of the minority (for the Republicans, Trump; for the Democrats, Sanders) corresponding with a decrease in copartisan elections would suggest that refusal to assent to the other party undermines the minority’s ability to engage in influencing the composition of the winner’s coalition.
Another way of accessing reliably policy divisions within parties is to examine district characteristics capturing racial division (measured as per cent white), policy divisions related to industry (% in agriculture) or wealth (median income). Such larger characteristics could cause representational challenges reflected in within-party competition between candidates who represent a local flavour against those more tied to the state organisation.
Of course, the powers of incumbency are also strong. If we consider politics to be fundamentally distributional (Weingast et al. Reference Weible1981), incumbents have more to distribute and are able to build party networks (see Masket Reference Masket2011) likely to prevent entry. This is important for the ACF because an association of open seats with copartisan elections would suggest that these are opportunities to influence policymakers at the very moment they are likely to choose among potential partners (e.g. consider the influence of campaign staff selection). These are interacted with party as the effects are likely in opposite directions if present at all.
(H3a) District Characteristic Division: The probability of copartisan elections should vary by district-level demographic or economic characteristics.
(H4a) Incumbents See Few Challengers: The probability of copartisan elections should decrease in the presence of an incumbent.
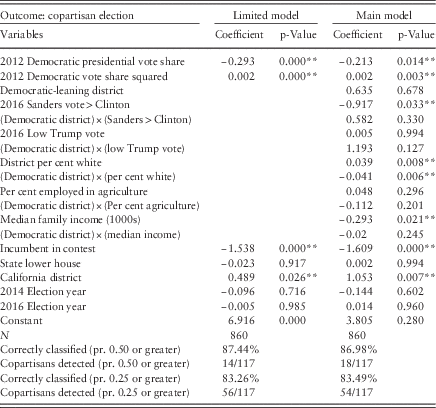
The model includes indicator variables for whether the election is in the state lower house, an indicator for California (as opposed to Washington), and the 2014 and 2016 election years. We estimate the model with robust standard errors. Table 1 contains both a more limited and full version of the model results.
Logit model for copartisan elections (without entry information)
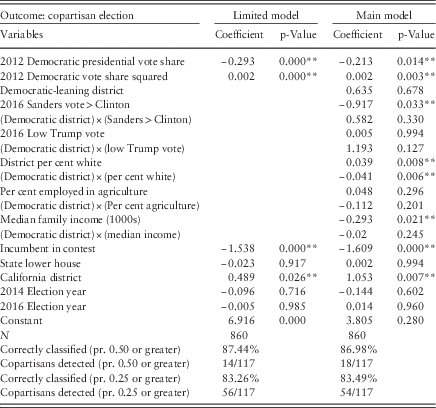
pr=probability.
*=p<0.10, **=p<0.05.
It should be readily apparent that the strongest meaningful effects are from presidential vote share (Hypothesis 1a) and incumbency (Hypothesis 4a). While there may be some effect for Hypothesis 2a, it is not very consistent; a similar story appears for Hypothesis 3a as well. The main model produces only miniscule improvements in the per cent of the outcomes correctly predicted; both models are hardly improvement over the naïve prediction that copartisan elections never occur. The probabilities are low and, while the results are in some way systematic, outcomes are noisy.
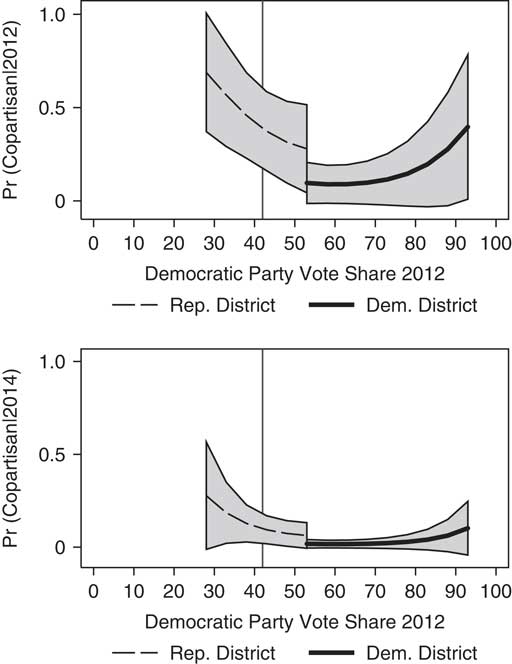
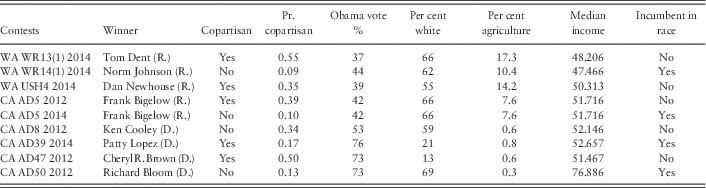
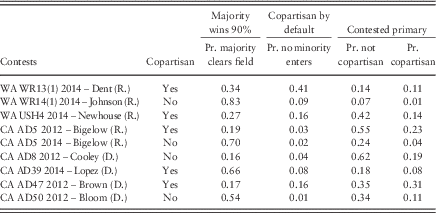
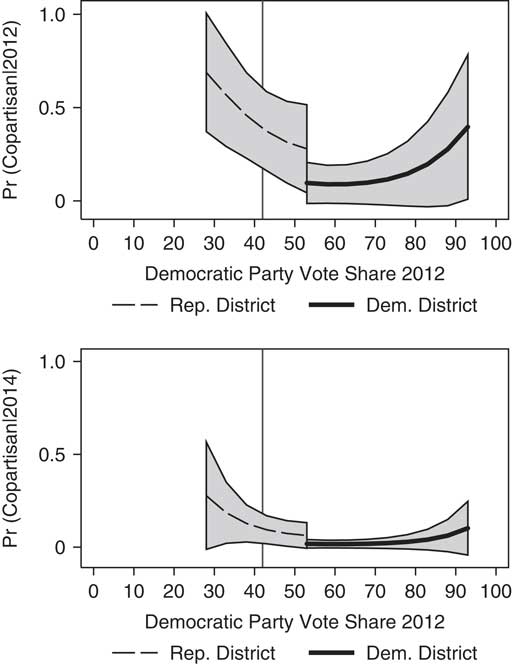
Examining several specific districts can help illustrate how these copartisan elections might interface with the ideas outlined in the ACF. Table 2 includes predicted probabilities for several specific election contests along with other relevant information. This begins with California’s Assembly District 5 (AD5) in 2012. This district, analysed in Alvarez and Sinclair (Reference Sinclair2015) and Sinclair (Reference Sinclair2015), was an open seat in a safe Republican district. Current Assemblyman Frank Bigelow, viewed as the more moderate or pragmatic candidate, defeated fellow Republican Rico Oller in the general election after placing second in the primary. In our model, the probability of a copartisan general election was only 0.39. This would have increased or decreased rather dramatically in a scenario where the presidential vote share was not so safely conservative (see Figure 4). Even as it was, this race resulted in a copartisan general election in part because independent expenditure groups decided to target Frank Bigelow’s opponent and in part because two Democrats entered – splitting the vote and lowering the threshold for Bigelow to come in second place in the primary. In 2014, with Bigelow now an incumbent, the predicted probability falls from 0.39 to 0.10. He did not face a same-party challenger that year or in 2016.
Margins for California (CA) Assembly District 5 (AD5) in 2012 and 2014. Note: Frank Bigelow won a copartisan election for an open seat in 2012 and returned as an incumbent in 2014 – and again in 2016. Rep=Republicans; Dem=Democrats. Vertical lines represent true CA AD5 value. Estimates for ranges in sample only.
Predicted probabilities and observed results for selected districts, main model
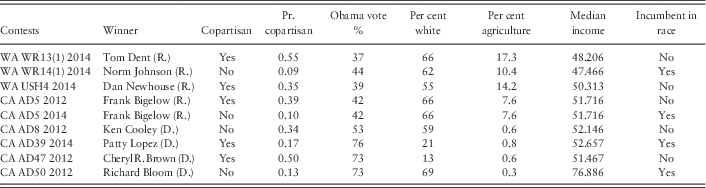
Note: CA AD=California Assembly District; WA WR=Washington State House of Representatives District; USH=United States House of Representatives District.
In contrast, another open seat in 2012, California’s AD8, had a similar probability of going to a copartisan general election (0.34). It shared many other characteristics with AD5 but was a much more competitive district across parties. This resulted in a traditional crossparty election, sending Democrat Ken Cooley to the legislature. There can be surprises, though, which is part of the reason why the differences in probabilities are not larger (i.e. our model explains some of the variance, but not all of it). Sometimes unlikely events do occur. In California’s AD39 in 2014, a safe Democratic seat, Patty Lopez defeated incumbent Raul Bocanegra in a copartisan election. Lopez, whose campaign was described as “a bare-bones operation, funded partially by selling tamales and pozole,” won in November by a margin fewer than 500 votes (Mason Reference Mason2014). Bocanegra, the chair of the Assembly’s Revenue and Taxation Committee and potential future speaker of the Assembly, had raised more than $1 million for the 2014 campaign and come out 40 points ahead in the primary (Mason Reference Mason2014). The Times credited as a factor “protest votes against the status quo by conservative voters who had no Republican to choose in the race” (Mason Reference Mason2014). To even qualify for the general, however, Lopez had to make second place in the primary. Bocanegra’s incumbent status should have (and did) shut out any well-connected and reasonably financed Democratic opponents, producing a low probability that this would go to a copartisan election; Lopez should not have been able to build enough support with limited resources to overcome the Republican for second place. Nevertheless, in this case, no Republican filed. She merely had to beat Michael B. Boyd’s 36 Republican write-in votes and a fellow Democratic nobody. With multiple entrants, all from the same party, a copartisan general election is nearly assured and these types of results are possible. This foreshadows the findings of our sequential model. Bocanegra came back in 2016 and handily defeated Lopez.
At the other extreme, sometimes the copartisan elections are expected. Our model gives California’s AD47 in 2012 a 50% chance of having a copartisan election – and it did. Two Democrats entered and fought it out with two nearly irrelevant Republican spectators (Alvarez and Sinclair Reference Sinclair2015). This district also featured a Black woman against a Latino man as Democratic copartisans in a Latino majority district. This race’s outcome suggests how that process might work, with each building on separate pathways to power, but the driver of the high probability here is just the extremity of the vote share difference between the Republican and Democratic parties. AD47 would have a copartisan election again in 2014 and again in 2016, with Cheryl Brown eventually falling to Eloise Reyes. One potential explanatory factor here is the district’s low 2016 Trump support relative to its 2012 Romney vote – an opposition lacking in rancorous spirit appears to reduce the chance of credible entry.
Alvarez and Sinclair (Reference Sinclair2015, 158) argue that California’s AD50 in 2012 represented a case in which a one-dimensional spatial model failed to capture the multidimensional group-type contest between three Democrats and one Republican. The Democratic vote split among several issue coalitions. Both the primary and the general election – featuring incumbent Assemblywoman Betsy Butler and fellow Democrat Richard Bloom – were very close, with the Republican Brad Torgan coming within a handful of votes of second place; Bloom won the copartisan general election by a very narrow margin. Butler had only represented a small fraction of the district previously, however, and thus Table 2’s prediction likely underestimates the probability of obtaining a same-party runoff because her incumbency status was worth less than it would be for a typical incumbent.
Washington has had fewer copartisan runoffs, although the patterns are similar. In a Republican copartisan general election, Tom Dent faced Dani Bolyard, both former Grant County Republican Party Chairs and cattle ranchers, for the open seat to represent Position 1 for LD13 in the State House in 2014. The main model assigns this seat a 55% chance of a same-party runoff. No other candidates filed, and therefore a copartisan election was inevitable: Dent won 65–35 in the primary and 63–37 in the general. The Yakima Herald endorsed Dent, the more mainstream candidate (Prill et al. Reference Prill, Crider, Purdy and Troianello2014). In a district with such a low chance of electing Democrats, LD13 may serve as a blueprint for locally weak parties: coordinate on the most acceptable candidate in the other party by running nobody in your own party.
Write-in candidacies highlight the value of merely showing up. Write-in candidates in Washington face minimal filing requirements (O’Grady Reference O’Grady2014): after Michael Brumback was disappointed to find incumbent Republican Norm Johnson as the only option for Position 1 for LD14, the Yakima attorney decided to run as a write-in. Brumback listed “No Party Preference” on his candidate filing form, though he identifies as Republican, arguably making the race a single-party runoff (although not coded as such). Brumback was not a first-time candidate: he had filed for the ballot and run against Johnson before in 2010 as a Democrat and lost. He later changed his party affiliation to the Republican Party (Runquist Reference Runquist2014). Brumback collected 645 write-in votes in the primary and qualified for the general election in which he won 43% of the vote in November. The vote shares obtained by unfunded write-ins, or otherwise hopeless partisan candidates, go a long way towards explaining how the top-two mechanism functions. There seems to be near universal agreement – especially for lower-level races – that citizens are voting based on very limited cues (party preference, ballot title), and this makes sophisticated coordination (involving strategic voting by weak-party voters) very difficult in the first stage. Therefore, copartisan runoffs occur probabilistically, with patterns of entry making a big difference in the ultimate outcome. Nevertheless, the patterns are at least somewhat predictable.
In an open seat, Congressional District 4 for 2014, Republican Dan Newhouse defeated copartisan Clint Didier in the general election 51–49%. Didier had defeated Newhouse 32–26 in the August primary, and hence this represented another “reversal of fortune”. Democrat Estakio Beltran finished third in the primary, far behind the district’s 40% 2012 Obama vote. Our model predicts a 35% chance of a copartisan general election. Newhouse was seen as a moderate; in the primary, Didier received national attention when he raffled off three guns to supporters when they signed up online for campaign updates (Geranios Reference Geranios2014). Nevertheless, Newhouse obtained important party endorsements (Song Reference Song2014). This represents the sort of “establishment” against “activists” divide generally tied to ideology within the modern Republican Party; it perhaps should not be surprising that this district was in the top half of support for President Trump in 2016. For our hypotheses, the other key point is that Clinton’s vote exceeded Sanders’ on the Democratic side. While it is difficult to know how this might have played out in a different primary election format, the reversal of the candidate’s relative position between the primary and general stage is certainly suggestive.
Adding entry
There remains a considerable amount of noise relative to signal in the main logit model: although the estimates capture many of the interesting dynamics, rarely do we estimate a probability of a copartisan election as over 50%. Individual choices, particularly for candidate entry – as the vignettes in the above section illustrate – have large consequences for the ultimate outcome. A more structured model of the process, the sequential logit model, can leverage these choices to obtain additional insights into the process. In particular, this can help highlight the role of what might be termed ordinary divisions – the main splits in the parties reflected in their presidential primary outcomes – and opportunities for subdomain divisions represented by sheer coalition size alone.
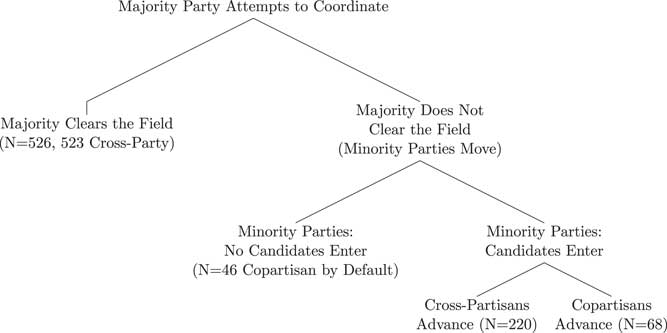
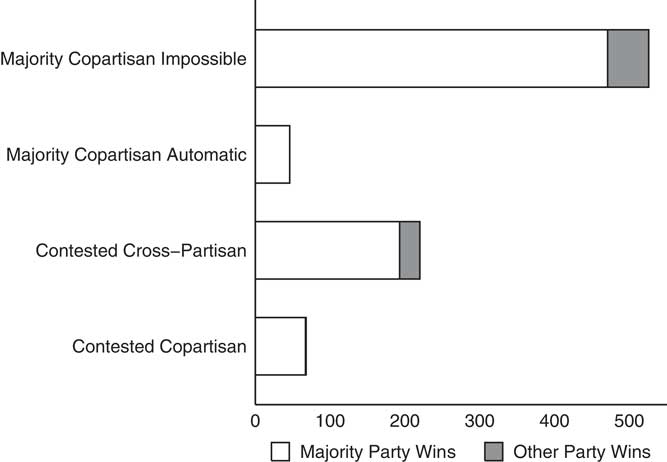
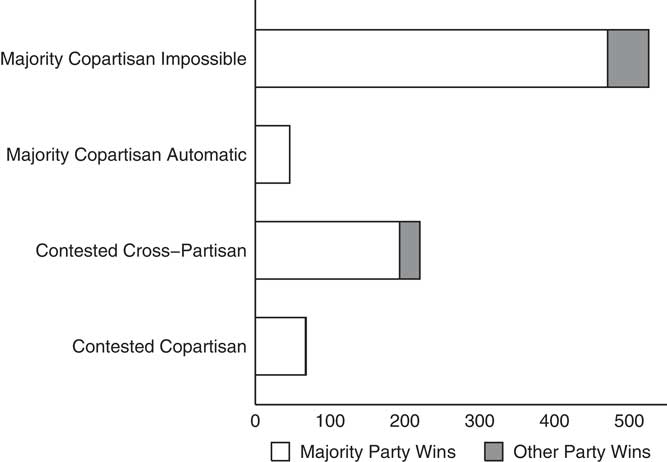
Figure 5 displays the tree of events and the number of observations in each category for a structured way of imagining the role of candidate entry. We imagine at the first level the majority party attempts to coordinate; if successful, and only a single candidate enters, the majority party has cleared the field. The result is that about 90% of the time the majority party wins the seat and in only three cases do we have a minority party copartisan election.Footnote 8 Should the majority fail to clear the field, we move to a level two decision for the candidates of minority parties. At this point, it may be the case that not a single minority party candidate enters the election; since the contest has reached this stage because multiple candidates of the majority party have entered, without opposition this automatically becomes a copartisan general election (although the identity of the final two candidates may be in doubt). If at least one candidate from a minority party enters the election, now the ultimate election type is up to the voters at level three: if two candidates from the same party get the most votes, a copartisan election is the result; otherwise, a crossparty election occurs. The majority party almost always wins in all types of contests (we return to this in the conclusion; see Figure 7).
Sequential model for path to copartisan election.
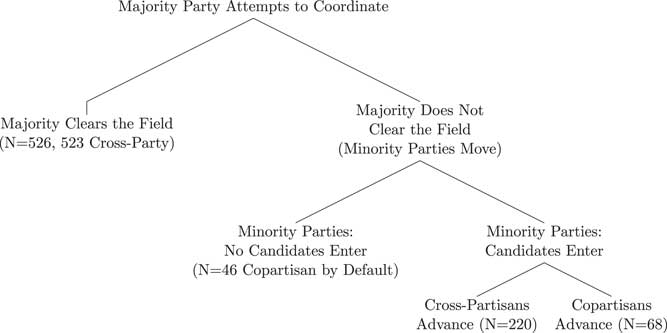
We can reframe the hypotheses from the prior section but now with greater precision about their likely impact on the process.
(H1b) Partisan Extremity: Increasing partisan extremity should increase the odds that the majority fails to clear the field at level 1; decrease the odds that the minority candidates enter at level 2; and increase the odds that copartisans advance out of a contested election type at level 3.
(H2b) Coalition Disagreement: At level 1, own-side disagreement – low Trump support for the Republicans, or a Sanders win for the Democrats – should increase the risk the party fails to clear the field; zeal of the opposition – evidenced by a Sanders win for Republican districts and Trump strength for Democratic districts – should correspond with entry of minority party candidates at level 2; and there should be no direct effect at level 3.
(H3b) District Characteristic Division: At level 1, characteristics at odds with the overall majority party orientation should increase the odds that the party fails to clear the field; at level 2 and level 3 there should be no effect.
(H4b) Incumbents See Few Challengers: Incumbency should decrease the odds the party fails to clear the field at level 1; decrease the odds that a minority party candidate bothers to enter at level 2; and decrease the odds that a copartisan election occurs at level 3.
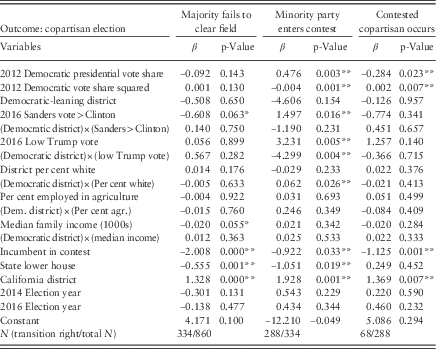
The results of the sequential logit model are presented in Table 3, where positive values at each level are associated with passing to the right in Figure 5. The intuition behind this argument is that larger policy disagreements should show up in readily identifiable cleavages within parties – at level 1 and level 2, both through the majority’s ability to coordinate and the minority’s interest in noncollaboration. At level 3 the issues become more local and less systematic – while the major cleavages within the party still matter, candidates seem to do well by trusting to the size of their own party coalition and emphasising issues about which their own party is not in disagreement at the deep core belief level: Betsy Butler’s education vote and the dog park at the beach in California’s AD50 in 2012 (Alvarez and Sinclair Reference Sinclair2015) or Frank Bigelow’s cowboy hat in California’s AD5 (Sinclair Reference Sinclair2015). Incumbency is a big coordinating advantage to defeat all of that: we expect the greatest impact of incumbency at level 1 and level 2 rather than level 3. The incumbents are still likely to win at level 3, even if a copartisan election does occur, but this is a potential point of higher risk.Footnote 9
Sequential logit model
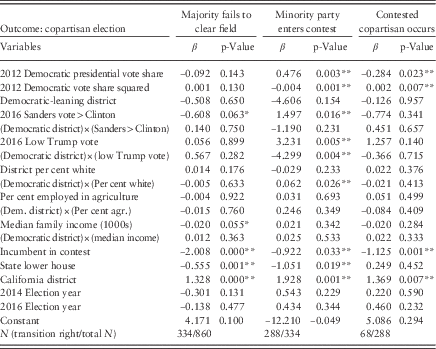
agr.=agriculture.
*=p<0.10, **=p<0.05.
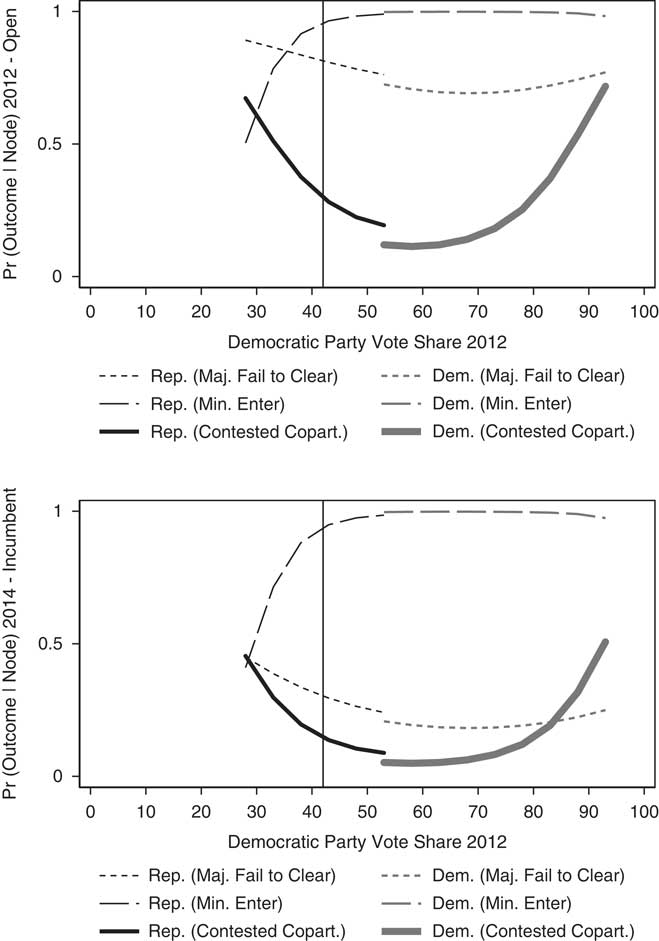
The results of the sequential logit model are in some ways quite surprising. The incumbency effect (Hypothesis 4b) is so strong at level 1 as to render nearly everything else irrelevant.Footnote 10 At level 2 we see the consequences of both party coalition size (Hypothesis 1b) and disagreement (Hypothesis 2b), although the results should be viewed in the context of the high probability the minority party enters a candidate.Footnote 11 At level 3, we see the reassertion of Hypothesis 1b as the dominant story with an additional small role for incumbency. Figure 6 displays these results for a district using the parameters of California’s AD5 in 2012 and 2014, manipulating the partisanship characteristic of Hypothesis 1b, and highlighting that Frank Bigelow won an open contest in 2012 and won again as an incumbent in 2014.
Simulating Assembly District 5 (AD5) in the sequential logit model. Note: Rep=Republicans; Maj=majority; Dem=Democrats; Min=minority. Vertical lines represent true CA AD5 value. Estimates for ranges in sample only.
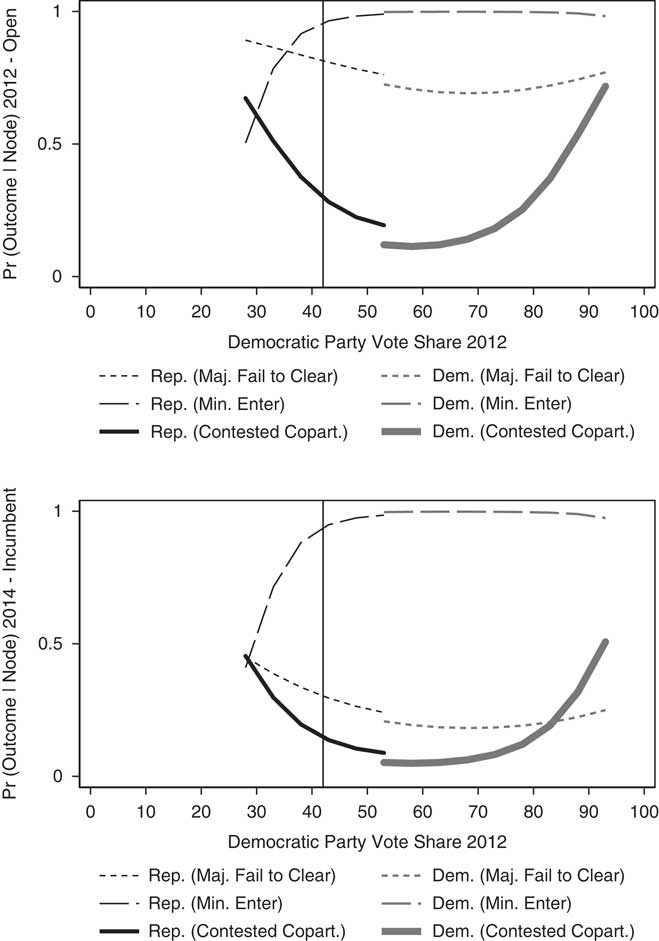
The visual of Figure 6 tells the main story: incumbency has a dramatic impact on level 1, on the order of a change in probability of about 0.50 at the party-break. Table 4 displays predicted probabilities for each outcome for the districts described in detail earlier. Incumbency appears to have a much more limited impact on level 2 and level 3, although Table 3 does indicate a slight impact. Level 2 reflects some characteristics about parties (supporting Hypotheses 1b and 2b) and not much of Hypothesis 3b – but, generally speaking, minority parties are quite likely to enter if there is a challenge in the majority. Level 3 is really about Hypothesis 1b: the more elbow room there is, the more likely a copartisan election happens. It is the absence of Hypothesis 2b at level 3 that points the way towards thinking more deeply about the ACF.
Predicted probabilities for each outcome, selected districts
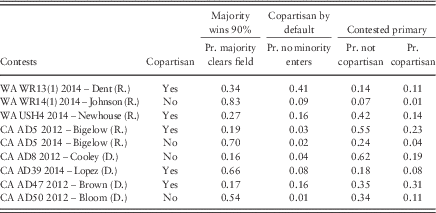
Note: CA AD=California Assembly District; WA WR=Washington State House of Representatives District; USH=United States House of Representatives District.
Discussion
The hopes many pro-reform advocates had for the nonpartisan top-two election procedure centred around the notion that voters would use the new institutions, with knowledge of the candidates and a sophisticated sense of political strategy, and support moderate candidates for office through both the primary and the general election (i.e. McGhee Reference McGhee2010). This assumed, in many ways, that ordinary voters had the talents and virtues the political elite hoped they might. One imagines this idealised democratic citizen, seated at the kitchen table, reading three newspapers per day, carefully weighing the advantages and strategic dynamics of a choice for the lower house of the state legislature; such a citizen might decide to abandon a hopeless candidate of their own party for an electable moderate of the other. Although such citizens do exist, it has been known for quite some time that they are rare: “systematic research … has consistently revealed that these high standard and historically perceived requisites for democracy are not being met or even approached” (Cobb and Elder Reference Cobb and Elder1971, 893). The absence of evidence for widespread sophisticated voting behaviour in the primary component of the nonpartisan elections fits this observation. So, then, do the institutions matter for policymaking at all?
Tocqueville promises that “there is therefore at the bottom of democratic institutions some hidden tendency which often makes men promote the general prosperity, in spite of their vices and their mistakes, whereas in aristocratic institutions there is sometimes a secret bias which, in spite of talents and virtues, leads men to contribute to the afflictions of their fellows” (Reference Tocqueville[1966] 1969, 234–235). This is the value of Tocqueville’s observation: even in the absence of widespread “aristocratic” behaviour, as long as the institutions support different kinds of incentives, they may mechanistically produce different kinds of outputs too. Figure 7 starkly illustrates how rarely the weaker major party wins elections. The nonpartisan top-two election procedure does two things: (1) it allows for voting choices disallowed under other primary election institutions and (2) it matches up general election candidates – sometimes, if two copartisans advance – in a way not possible under other primary election institutions. Framing an investigation of the operation of the nonpartisan election procedure in terms of Advocacy Coalitions highlights the potential meaning of the systematic occurrence of the copartisan general elections in a way that a search for sophisticated voting behaviour would miss.
Election results by election configuration.
What we have here is not a direct test of the ACF: it is an exploration of the opportunities this institution may present. Even in the absence of sophisticated voting, the copartisan elections generate openings for advocacy in a regular and predictable way. There remains a great deal of variability, to be sure, and these elections do not happen as often as some pro-reform advocates might have wanted, and often the same types of candidates win as would have won under any other system. The ACF highlights the value of the variability, the disruption the usual coalitions, even if these disruptions do not always result in electoral success and especially if they are not predicted by regular party cleavages (Hypothesis 2b at level 3 in the prior section). Some of these copartisan elections have brought together unusual political coalitions to win elections with candidates unlikely to have won otherwise where the key political fact may have been issues tangential to the main axis of crossparty conflict (see Alvarez and Sinclair Reference Sinclair2015). For advocacy coalitions typically nested within parties, they may instead find themselves working with traditional opponents and against traditional allies to elect a certain candidate; this may rearrange the “long-term opportunity structures” (Weible et al. Reference Weingast, Shepsle and Johnsen2009) for parts of a coalition, joined to a party by a deep core belief, but losing internal party conflicts about the implementation of secondary policy beliefs.
The ACF would also call for patience. We did not here test the ultimate policy results in the way McGhee (Reference McGhee, Masket, Shor, Rogers and McCarty2015) sought to do with the Chamber of Commerce agenda; instead, we hope to direct the attention of policy scholars to patterns of events. The time-horizons built into the ACF, thinking about policy change in terms of decades, even, indicate that we may not see major policy results yet – but policy scholars working across a variety of domains should start looking for them and pay attention to the electoral institutions. We should expect innovation from both the policy winners under the old system and policy entrepreneurs seeking opportunities under the new one. North argues that “institutional change is typically incremental and is path-dependent” and dependent on the types of investment participants in the system have made (Reference North1998, 18). It takes time for entrepreneurs to spot new openings and find ways to make the necessary investments to exploit them. They may not always make a consistent change to the legislative process, as well. Kingdon’s (Reference Kingdon1995, 204) “policy windows” – combinations of problem, idea and political ability to implement solutions – are “small and scarce”. The nonpartisan top-two election procedure would have the greatest impact in the set of circumstances in which there is a well-defined problem, a policy solution at hand and a political situation that requires legislators to break with their traditional party apparatus and support something favoured by the majority of their district (if not their partisans).
Of course, in one-party states with partisan primaries, traditional elections provide a measure of democratic input. V.O. Key observed of the one-party South of the 1940s that “factions of the Democratic Party play the role assigned elsewhere to political parties” (Reference Key[1949] 1984, 298). And, in San Francisco or Seattle – or along the Nevada or Idaho borders, on the Republican side – the same would be true with the top-two or without it. The difference with the nonpartisan top-two procedure is that a party rebel need only survive to the second round to have a chance to build a big enough coalition, including groups typically working with the other (partisan) side. Promises can be delivered on specific issues within a policy subdomain. It is more plausible for an insurgent to fight on, to produce a genuinely competitive general election in which all voters are suddenly important. The groups who would benefit from a more traditional primary should face higher costs to obtain the same outcomes in these types of districts.
Institutional innovations such as the nonpartisan top-two election procedure challenge policy scholars to formalise their notions of coalitions. It is often safe to make assumptions about the beliefs of the coalitions within policy subsystems, as much of the research using the ACF does, when those coalitions (and thus beliefs) remain stable. The operation of any given subsystem (or subdomain) of policy activity, though, is just part of a larger whole. The nonpartisan top-two primary has the capacity to produce changes in any of these subsystems, particularly as new candidates are elected, using or fighting against perhaps unusual political coalitions, in unusual places. Although we have highlighted the dynamics of the opportunities, the exact outcomes remain quite uncertain – and will only really change if groups and individuals seize them and do their best to shift policymaking.
Acknowledgement
Funding and support for this project came through the Rose Institute of State and Local Government of Claremont McKenna College, New York University – Wagner, and from the Irvine Foundation and California Forward during the preliminary stages of this research. Thanks also to Melissa Muller and Lane Corrigan at the Rose Institute for their research assistance, in addition to the support of Dr. Kenneth P. Miller.