Introduction
Ventricular septal defect is the most prevalent subtype of CHD, accounting for approximately 30–40% of the total CHD cases. Reference Hoffman and Kaplan1 Estimated birth prevalence of ventricular septal defect is around 2.62 per 1,000 live births (95% CI: 2.59–2.65). Reference van der Linde, Konings and Slager2,Reference Ko and Cedars3 Currently, transcatheter closure has become one of the treatment option for ventricular septal defect. However, studies have shown that this procedure can lead to a range of adverse complications. The onset of arrhythmias, particularly conduction disturbances like right bundle brunch block or rarely complete atrio-ventricular block, constitutes one of the most frequent and clinically serious complications following device closure. Reference Santhanam, Yang, Chen, Tai, Rajgor and Quek4 In past years, reports for arrhythmias after ventricular septal defect transcatheter closure lies about 10%. Reference Santhanam, Yang, Chen, Tai, Rajgor and Quek4–Reference Bergmann, Germann, Nordmeyer, Peters, Berger and Schubert6 Some previous studies reported that bundle branch block and complete atrio-ventricular block occurred in 3.5–8.6% of cases. Reference Knauth, Lock and Perry7–Reference Carminati, Butera and Chessa9 Consequently, the procedural manoeuvres and the physical existence of the occluder can directly injure or cause sustained pressure to the conduction tissue. Surrounding tissue oedema, the formation of fibrous scar tissue or sustained local inflammatory responses may also damage the conduction system. Reference Wang, Li and Wang5,Reference Bergmann, Germann, Nordmeyer, Peters, Berger and Schubert6,Reference Butera, Piazza, Saracino, Chessa and Carminati10–Reference Joye, Beghetti and Wacker12
Beyond the immediate risk of heart block, emerging evidence points to a more complex, long-term alteration in cardiac autonomic regulation following ventricular septal defect closure. The autonomic nervous system is crucial for cardiovascular homeostasis, and its dysfunction can increase susceptibility to arrhythmias. Some studies suggest that ventricular septal defect closure may lead to impaired cardiac autonomic modulation whatever the procedure is surgical or TIC, indicated by decreased heart rate variability. Reference Heiberg, Eckerström and Rex13,Reference F.14 Although investigators have demonstrated that heart rate variability bears several pitfalls when used in analysing autonomic nervous system, and its relevance is still unclear in paediatric ages, Reference Hayano and Yuda15 it still leaves us a hint. This sympathovagal imbalance, which may persist into adulthood, could represent an underlying substrate that predisposes patients to late arrhythmic events and contributes to long-term morbidity. Reference Ataya, Chung, Cope and Alnuaimat16
In summary, although transcatheter closure is an effective treatment for ventricular septal defects, the risk of postoperative arrhythmia remains and may affect patients’ quality of life and long-term prognosis. Reference Esmaeili, Behnke-Hall, Schrewe and Schranz17,Reference Yoo, Kim, Eun, Choi and Kim18 Therefore, a comprehensive preoperative assessment of patient risk factors, monitoring during surgery, and postoperative surveillance is crucial to reduce the incidence of arrhythmia. Further investigation into the mechanisms underlying arrhythmia and the development of proactive preventive strategies represent important directions for future research. Reported risk factors in early post-closure arrhythmias include a large (≥8 mm) or eccentric ventricular septal defect diameter, a short distance from the defect to the aortic valve (<3 mm), and long fluoroscopy time. Reference Zhao, Han, Zhang, Yi, Jiang and Lyu19 Blood pH < 7.35 and arteriovenous track building time after the success of the Seldinger technique ≥60 min were also considered as predictors of post-closure arrhythmias. Reference Sun, Gao and Zhou20 Notably, a novel three-dimensional electroanatomic mapping technique has been proposed for adults with perimembranous ventricular septal defect, which precisely measures the minimum distance between the defect margins and the adjacent His-Purkinje system with a mapping catheter to conduct 3D electroanatomic mapping of the His-Purkinje system in the left ventricular. A distance of <2 mm is associated with a substantially higher risk of procedure-related conduction block (60% vs. 6.7% for distances>2 mm), offering a potential preoperative predictive tool. Reference Tang, Zhan and Zhang21 However, it takes a particular device to measure during the operation, raising a burden to patients and clinicians. Although previous studies have identified several anatomical and procedural factors associated with post-procedural arrhythmias following ventricular septal defect closure, these analyses have predominantly relied on traditional univariate or multivariate statistical models. Such methods are limited in their ability to capture the complex nonlinear interactions among multiple risk factors, and they are inadequate for efficiently integrating and screening high-dimensional features from rich electronic medical record to construct robust, individualised predictive tools.
To enable early intervention and provide any treatment of postoperative atrial fibrillation, we developed a postoperative prediction model using a Random Forest classifier. Patients’ clinical information, details of TIC surgery, and multiple postoperative electrocardiogram data were used in training. Random Forest model can output feature importance scores, which can provide valuable guidance for clinical practice. Leveraging this, we ranked the relative importance of different patient characteristics in predicting the occurrence of arrhythmias after TIC. We also conducted a post hoc analysis to identify the key patient characteristics that have a significant impact on treatment outcomes, providing a valuable reference for clinical diagnosis and management.
Material and methods
Patient population
This study was established to analyses the predictive values of detect anatomic features, interventional characteristics, perioperative electrocardiogram parameters in determining long-term persistent conduct block associated with device implantation (including atrioventricular blocks and bundle branch blocks). This study was approved by the Ethics Committee of West China Second University Hospital of Sichuan University (NO. 2021-069). Written informed consents were obtained from all subjects. The data are from the cohort of 1599 paediatric patients who received percutaneous closure of ventricular septal defect at West China Second University Hospital from January 2011 to December 2021 and completed at least 3-year follow-up.
Utilising the cohort, we recruited candidates for further analysis using the following criteria: (1) All the patients had been diagnosed as congenital ventricular septal defects by transthoracic or trans oesophageal echocardiography; (2) all the patients received transcatheter closure of ventricular septal defect by Amplatzer (Amplatzer like) occluders or ADO-II according to the Guidelines for interventional treatment of common CHD in children (China, 2015 Version); (3) prior electrocardiogram recorded within 3 days before closure applicated; (4) recurrent electrocardiogram assessments should be performed 1st, 3rd, and 30th days post-closure; (5) the follow-up duration should beyond 3 years with convinced electrocardiogram records; (6) the electrocardiogram records contained the data of vectorcardiogram. While the exclusion criteria included the following: (1) Combined other cardiac malformations which were required surgical corrections; (2) isolated arrhythmias without any association to ventricular septal defect and transcatheter closure, including atrioventricular nodal reentry tachycardia, atrioventricular reentry tachycardia, etc.; (3) inherit cardiomyopathy and ion channel disorders; (4) metabolic disorders; (5) survivor of tumour; (6) suffering vasculitis and autoimmune diseases; (7) underwent recorded myocarditis; and (8) high degree or complete atrioventricular block received device take over and surgical treatment.
Transcatheter closure procedure
The ventricular septal defect closures were performed under general anaesthesia in children < 10 years old and local anaesthesia in older children. Right and left cardiac catheterisation was performed via percutaneous transfemoral route. Haemodynamics of the pulmonary vessels were measured, and pulmonary vessel resistance was evaluated before the final occlusion. Real-time TTE imaging was performed during the procedure to assess the profile ventricular septal defect in the left ventricular long-axis oblique view. The size of the ventricular septal defect and the distances to the aortic and tricuspid valves were further confirmed by angiography. The size of the device was usually selected to be 1–2 mm larger than the defect measured by angiocardiography. Heparin (100 U/kg) was administered to all patients after successful femoral artery access. No prior antibiotic was applied in routine strategy perioperation. Aspirin was given for 6 months after the procedure. Reference Li, Hua, Fang, Wan, Wang and Zhou22
Follow-up and clinical outcomes determination
All patients should receive a strict follow-up at 1, 3, 6, 12, and 36 months post-procedure. The patients and their guardians were informed in advance and reminded for each scheduled visit. During follow-up, clinical characteristics were measured, echocardiography and electrocardiogram were performed. In cases of unexpected late complications, patients underwent chest X-ray to understand the position and shape of the occluder. Once arrhythmias, especially for atrioventricular blocks, detected within 5 days post the procedure, dexamethasone was provided for at least 3 days (1 mg/kg/d, max. 20mg/d). Given the fact that not all patients could attend full-scheduled hospital follow-up visits, only patients who completed at least 3 follow-up visits within the first year were included in the retrospective review and subsequent analyses. If the patients were free from any heart conductive disorder, scheduled follow-up was not strictly required for such patients. So that, the primary clinical outcome was designed as persistent heart conduction blocks which should be newly identified post-transcatheter device closure of ventricular septal defect at the 3rd years follow-up.
Data preprocessing
The patients’ information collected and used for the establishment of predictive model included basic clinical information, ventricular septal defect anatomic features, interventional parameters (size of occlude, size of delivery sheath, etc.), and perioperative electrocardiogram and vectorcardiogram parameters (within 3 days before closure, 1st and 3rd post-closure, as well as 1-month follow-up results), which was carefully detailed in Supplementary materials. The clinical outcome input to machine learning was considered as a single binary variable for dividing training / testing set, model training, and final validation: persistent of any heart conduction blocks at the 3rd year electrocardiogram + vectorcardiogram assessments.
Based on their characteristics, the data can be categorised into two types. Continuous data include numerical measurements that can take on any value (heart rate, occluder size, electrocardiogram voltage, and duration values, etc.), they are recorded normally. Categorical data includes descriptive results, such as ventricular septal defect anatomic classification, the presence or absence of valvular regurgitation, and electrocardiogram diagnoses.
Missing value preprocessing
In the context of dealing with missing values in observed data, we employed the Random Forest algorithm for data completion. Reference Tang and Ishwaran23 The main idea is to build a Random Forest model by treating known variables as independent variables and variables with missing values as dependent variables to predict the missing values. Specifically, we firstly remove the entries with missing values and using these complete data to train a Random Forest model for self-regression Reference Lawton, Sylvestre and Maggio24 to establish a mapping between different variables. Then, after training the Random Forest model, we use the trained model to predict the missing values in the original dataset.
Random Forest for predict postoperative of the TIV
Random Forest Reference Breiman25 is a widely used machine learning technique for tasks such as classification and regression. The approach involves creating multiple decision trees with randomness incorporated in two ways. Firstly, each tree is built using a different bootstrap sample, which is obtained by randomly selecting training data with replacement. Secondly, during the construction of each tree, ID3 algorithm Reference Slocum26 is conducted where only a subset of k variables from the original set are randomly chosen to determine the best split at each node. In particular, we adopt the commonly used information gain as the splitting measurement for constructing each decision tree.
 \begin{equation}Gain\left(A\right)=H-H_{A}\end{equation}
Where H and H A are the entropy value before and after splitting the data. For prediction purposes, the decisions made by these trees are combined through majority voting for classification or averaging for regression tasks. To evaluate the effectiveness of the electrocardiogram data for predicting the postoperative of the TIC, we separately conduct the Patient clinical information, interventional closure information, multiple postoperative electrocardiogram data as an input to train a Random Forest model for TIC prediction.
Further, note that our data are quite imbalance, before we training the Random Forest classification model, we conduct SMOTE algorithm Reference Wang, Xu, Wang and Zhang27 on the training data to enhance the model performance.
Random Forest for key variable selection
To determine the significance of features in prediction, we employ the random forests to compute feature importance scores Reference Janitza, Celik and Boulesteix28 for assessing the relevance of features in classification tasks. Feature importance scores are extensively utilised in evaluating and selecting features, providing valuable guidance for practical applications. Random Forests commonly employ the mean decrease accuracy Reference Hong, Xiaoling and Hua29 approach to quantify feature importance.
The mean decrease accuracy is a measure of the reduction in accuracy that would occur if a particular feature was removed from the model. It is the average of the decrease in accuracy over all trees in the forest when that feature is randomly permuted. A higher mean decrease accuracy value indicates that a feature is more important for the model’s prediction accuracy.
Model evaluation
To verify the model performance, we used out-of-distribution testing for evaluation. Specifically, we split the data into training and test sets by a ratio of 7 (training Set) to 3 (test sets). In addition, for the training set, we use five-fold cross-validation to split the data for hyperparameter selection. We use the depth and the number of the decision tree as the hyperparameters of the Random Forest. The range of the depth of the decision tree is set as [1, 2, …, 19, 20] whereas the number of the decision tree is set as [10, 20, …, 190, 200]. Accuracy (proportion of correctly classified cases among all cases), precision (proportion of correctly predicted positive cases among all cases predicted as positive), recall (also known as sensitivity, proportion of correctly predicted positive cases among all actual positive cases), specificity (proportion of correctly predicted negative cases among all actual negative cases), F1-score (harmonic mean of precision and recall, providing a balanced measure), and AUC value (area under the receiver operating characteristic curve) are utilised for evaluating of different measurements. The mathematical definitions of accuracy, precision, recall, and specificity are provided below.
 \begin{equation}\text {Accuracy}={TP+TN \over TP+TN+FP+FN}\end{equation}
 \begin{equation}\text {Precision}={TP \over TP+FP}\end{equation}
 \begin{equation}\text {Recall}={TP \over TP+FN}\end{equation}
 \begin{equation}\text {Specifity}={TN \over TN+FP}\end{equation}
 \begin{equation}F_{1}\text { score} ={2\times \text{ Recall}\times \text{ Accuracy} \over \text{ Recall}+\text{ Accuracy}}\end{equation}
TP represents the count of correctly classified positive subjects in the classification task. Similarly, TN (True Negative), FP (False Positive), and FN (False Negative) denote the respective counts for their corresponding subjects.
Results
Included patients
874 of 1599 patients fall into the inclusion criteria, who were also free from the exclusion criteria. The included patients were aged 2–13 years, including 433 males (49.54%) and 441 females (50.46%). All patients were diagnosed with ventricular septal defect by convinced strategies and re. Patients were evaluated again by echocardiography before closure procedure. According to follow-up results, there were 117 patients presented persistent heart conductive disorders. Among them, 53 patients demonstrated incomplete right bundle branch block, 27 patients demonstrated complete right bundle branch block, 15 patients presented left anterior hemiblock, 14 patients revealed complete right bundle branch block + LAH, 3 patients demonstrated intermittent or continuous complete left bundle branch block, and 5 patients present first degree AVB. All the 874 patients were included for model validation and test set to analyses the predictive values of detect anatomic features, interventional characteristics, perioperative electrocardiogram parameters in determining long-term persistent conduct block associated with device implantation.
Optimisation of the number of decision trees for each model
The search range for the number of decision trees was set to [0, 200], and the models were evaluated at intervals of 10 (step size). Figure 1 shows the relationship between the number of trees and the generalisation error (out-of-bag error) for each model. Optimal number of decision trees for the models built on patient pathology characteristics, surgical procedure characteristics, preoperative electrocardiogram, postoperative 1st and 3rd day and 1-month follow-up electrocardiogram + vectorcardiogram are 141, 191, 31, 151, 191, and 61, respectively.
Optimisation of the maximum depth of decision trees for each model
The search range for the maximum tree depth was set to [0, 20] with a step size of 1. With the optimal number of decision trees for each model, the relationship between the maximum tree depth and the generalisation error (out-of-bag error) was plotted (Figure 2). Optimal maximum depths for the model of patient pathology characteristics, surgical procedure characteristics, preoperative electrocardiogram, postoperative day 1, 3, and follow-up electrocardiogram were identified as 12, 6, 9, 15, 11, and 10. The tuning results demonstrate that all six models trained on this ventricular septal defect closure patient dataset achieved a satisfactory fit and exhibited robust overall performance. Each model is effective for the prediction of post-operation arrhythmias.
Relationship between the number of decision trees and generalisation error (out-of-bag error) for each model, optimal number of decision trees is marked at lowest point of generalisation error. ( a ) for anatomic features, ( b ) for interventional information, ( c ) for preoperative electrocardiogram, ( d ) for 1st post-closure, ( e ) for 3rd day post-closure, and f for 1-month post-closure.

Figure 1. Long description
Six line graphs depict the relationship between the number of decision trees and generalization error for different models related to ventricular septal defect closure. Each graph shows the generalization error on the vertical axis and the number of decision trees on the horizontal axis. The optimal number of decision trees is marked at the lowest point of generalization error. Panel A: For patients’ pathology characteristics, the graph shows a decreasing trend in generalization error as the number of decision trees increases, with the optimal number of decision trees being 141. Panel B: For surgical procedure characteristics, the graph also shows a decreasing trend, with the optimal number of decision trees being 191. Panel C: For preoperative ECG, the graph shows a sharp decrease in generalization error initially, leveling off at around 31 decision trees. Panel D: For postoperative day 1 ECG, the graph shows a similar sharp decrease, leveling off at around 151 decision trees. Panel E: For postoperative day 3 ECG, the graph shows a sharp decrease initially, leveling off at around 191 decision trees. Panel F: For postoperative follow-up ECG, the graph shows a sharp decrease initially, leveling off at around 61 decision trees.
Relationship between the maximum tree depth and the generalisation error (out-of-bag error), optimal number of maximum tree depth is marked at lowest point of generalisation error. ( a ) for anatomic features, ( b ) for interventional information, ( c ) for preoperative electrocardiogram, ( d ) for 1st post-closure, ( e ) for 3rd day post-closure, and ( f ) for 1-month post-closure.

Model validation and performance
A total of 874 samples data were split into a training set and a test set at a 7:3 ratio. Then, for each feature set, Random Forest model with optimised parameters given above was trained on the training set using 5-fold cross-validation. Test sets were then applied to the trained models for evaluation. All six datasets were well-balanced, while minimal differences on total sample size in each test set are occurred due to random splitting. Overall, the models demonstrated a high accuracy in classification, and errors were generally low across models. The model based on surgical procedure characteristics produced the highest number of errors (67 of 512, 13.08%), followed by the models based on preoperative electrocardiogram (24 of 504, 4.76%) and postoperative day 3 electrocardiogram (23 of 500, 4.60%). Fewest errors happened on postoperative 1st day electrocardiogram + vectorcardiogram (8 of 506, 1.58%).
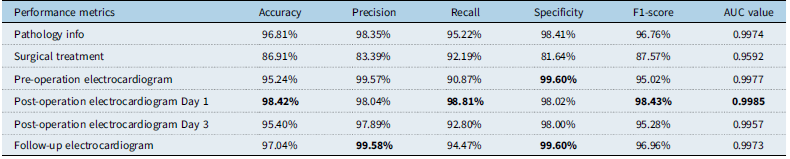
Based on the validation results on test sets, the performance metrics for each model were calculated. As shown in Table 1, all indicators for the six Random Forest models exceeded 80%. Specifically, the models based on patient ventricular septal defect pathology characteristics, postoperative day 1 electrocardiogram, and follow-up electrocardiogram characteristics have all indicators above 95%. Preoperative electrocardiogram and postoperative day 3 electrocardiogram achieved 90%. Receiver operating characteristic curve is shown in Figure 2. The area under the curve for receiver operating characteristic curve is 0.9974, 0.9592, 0.9977, 0.9985, 0.9957, and 0.9973, respectively. All AUC values are greater than 0.85. Receiver operating characteristic curve for each Random Forest model lies above the diagonal line (y = x), indicating that the models’ predictions are superior to random guessing and thus are valid.
Performance metrics of each model on test sets

Table 1. Long description
A table with seven rows and seven columns comparing performance metrics of different models on test sets. The columns are labeled Accuracy, Precision, Recall, Specificity, F1-score, and AUC value. The rows are labeled Pathology info, Surgical treatment, Pre-operation electrocardiogram, Post-operation electrocardiogram Day 1, Post-operation electrocardiogram Day 3, and Follow-up electrocardiogram. Row 1: Accuracy, 96.81 percent; Precision, 98.35 percent; Recall, 95.22 percent; Specificity, 98.41 percent; F1-score, 96.76 percent; AUC value, 0.9974. Row 2: Accuracy, 86.91 percent; Precision, 83.39 percent; Recall, 92.19 percent; Specificity, 81.64 percent; F1-score, 87.57 percent; AUC value, 0.9592. Row 3: Accuracy, 95.24 percent; Precision, 99.57 percent; Recall, 90.87 percent; Specificity, 99.60 percent; F1-score, 95.02 percent; AUC value, 0.9977. Row 4: Accuracy, 98.42 percent; Precision, 98.04 percent; Recall, 98.81 percent; Specificity, 98.02 percent; F1-score, 98.43 percent; AUC value, 0.9985. Row 5: Accuracy, 95.40 percent; Precision, 97.89 percent; Recall, 92.80 percent; Specificity, 98.00 percent; F1-score, 95.28 percent; AUC value, 0.9957. Row 6: Accuracy, 97.04 percent; Precision, 99.58 percent; Recall, 94.47 percent; Specificity, 99.60 percent; F1-score, 96.96 percent; AUC value, 0.9973.
Definitions and calculations of indicators are provided in model evaluation part of Random Forest methods.
Receiver operating characteristic curve and area under the curve value of each model. Orange line, receiver operating characteristic curve; violet dashed line, diagonal line (y = x). ( a ) for anatomic features, ( b ) for interventional information, ( c ) for preoperative electrocardiogram, ( d ) for 1st post-closure, ( e ) for 3rd day post-closure, and ( f ) for 1-month post-closure.

Figure 3. Long description
Panel A: A receiver operating characteristic curve graph depicts the model for patients’ pathology characteristics. The x-axis represents the false positive rate, and the y-axis represents the true positive rate. The area under the curve (AUC) value is 0.9974. The orange line represents the ROC curve, and the violet dashed line represents the diagonal line (y = x). Panel B: A receiver operating characteristic curve graph depicts the model for surgical procedure characteristics. The x-axis represents the false positive rate, and the y-axis represents the true positive rate. The AUC value is 0.9592. The orange line represents the ROC curve, and the violet dashed line represents the diagonal line (y = x). Panel C: A receiver operating characteristic curve graph depicts the model for preoperative electrocardiogram (ECG). The x-axis represents the false positive rate, and the y-axis represents the true positive rate. The AUC value is 0.9977. The orange line represents the ROC curve, and the violet dashed line represents the diagonal line (y = x). Panel D: A receiver operating characteristic curve graph depicts the model for postoperative day 1 ECG. The x-axis represents the false positive rate, and the y-axis represents the true positive rate. The AUC value is 0.9985. The orange line represents the ROC curve, and the violet dashed line represents the diagonal line (y = x). Panel E: A receiver operating characteristic curve graph depicts the model for postoperative day 3 ECG. The x-axis represents the false positive rate, and the y-axis represents the true positive rate. The AUC value is 0.9957. The orange line represents the ROC curve, and the violet dashed line represents the diagonal line (y = x). Panel F: A receiver operating characteristic curve graph depicts the model for postoperative follow-up ECG. The x-axis represents the false positive rate, and the y-axis represents the true positive rate. The AUC value is 0.9973. The orange line represents the ROC curve, and the violet dashed line represents the diagonal line (y = x).
Significant predictors identified by machine learning
A key advantage of the Random Forest model is its ability to provide and rank the importance score of input factors, which provides valuable insights for clinical decision. The feature importance scores for each model are presented in Supplementary Tables 1–6. And all the contribution shares aere summarised in Figure 4 and Supplementary Figure 1.
Figure 3. All the shared contributions of electrocardiogram and vectorcardiogram parameters in predicting long-term persistent heart conductive disorders at different time points.
All the shared contributions of electrocardiogram and vectorcardiogram parameters in predicting long-term persistent heart conductive disorders at different time points.

For the model based on patient ventricular septal defect pathology and surgical details, preoperative left atrial and left ventricular dimensions, and the size of the ventricular septal defect occluder, were identified as the most significant predictors of postoperative arrhythmias. Left ventricular size ranked highest in this model, with an importance score of 0.2088, followed by left atrial size with a score of 0.1876. The features ranked 3rd to 6th were defect’s outlet size, inlet size, distance to the aortic valve rim, and the condition of valvular regurgitation, with importance scores of 0.1194, 0.1140, 0.0955, and 0.0791, respectively. The total score of these 6 features was 0.8044, indicating that they take up the main effect for predicting postoperative disease outcome through defect’s pathology. For the interventional procedure characteristics model, occluder size ranked highest with an importance score of 0.5838, much higher than others. It suggests that occluder size may be the most critical feature for postoperative prediction in ventricular septal defect. Number of occluders and additional intraoperative use of dexamethasone ranked 2nd and 3rd in all 6 features of surgical characteristics, indicating that these two features also have some influence.
In the preoperative electrocardiogram characteristics, RV5 voltage represents left ventricular thickness, ranked highest with a score of 0.063220, followed by the sagittal plane R–T angle, which indirectly reflects if right ventricular is hypertrophy, with a score of 0.054462. Frontal plane III quadrant area, transverse plane I quadrant area, R-wave axis, transverse plane III quadrant area, and corrected QT interval had importance scores above 0.04; these all reflect the relationship between left and right ventricular thickness and electrical axis among two champers. However, the scores for other electrophysiological features such as QRS duration, PR interval, RV1 voltage, P wave axis, diagnosis of conduction block, and diagnosis of electrical axis were relatively small. For the electrocardiogram characteristics on postoperative day 1, the T wave axis, R wave axis, and transverse plane R–T angle had greater predictive influence, with scores of 0.065601, 0.061065, and 0.054768, respectively. They all reflect changes in ventricular repolarisation and its electrical axis deviation. QRS duration, diagnosis of conduction block, and P axis ranked 3rd to 6th, showing a significant increase compared to the preoperative electrocardiogram model. For the electrocardiogram on postoperative day 3, the scores of the top 14 features were all greater than 0.03. QRS duration ranked highest with an importance score of 0.080781, and it’s ranking further increased compared to the postoperative day 1 electrocardiogram. The 2nd feature is RV5 voltage with an importance score of 0.064122. R-wave axis, corrected QT interval, and SV1 voltage ranked 3rd to 6th, with importance scores of 0.049645, 0.045209, and 0.043465, respectively. For the 1-month follow-up electrocardiogram, defined as the patient’s last electrocardiogram result within one year after surgery, RV1 voltage had the highest importance score of 0.074209, representing right ventricular voltage. The diagnosis of conduction block, R-wave axis, transverse-plane R–T angle, and QRS duration followed, with importance scores of 0.062316, 0.060563, 0.059487, and 0.051679, respectively. From the perspective of long-term follow-up, the degree of right ventricular thickness, diagnosis of conduction block, R-wave axis, R–T angle, and QRS duration showed a more obvious correlation with prognosis. All the shared contributions of electrocardiogram and vectorcardiogram parameters in predicting long-term persistent heart conductive disorders were summarised in Figure 3.
Discussion
The establishment of Random Forest models based on various datasets provides insights into the rules that how the model’s decision trees are generated. These rules show how each model classifies ventricular septal defect patients according to their features. In clinical practice, this capability allows for dynamic patient monitoring at different postoperative stages, facilitating the early detection of abnormalities. Timely intervention may reduce postoperative risks, which is the fundamental objective of developing this predictive model.
In the analysis of the two models based on patient ventricular septal defect pathology and surgical procedure information, a notable finding emerged. The specific measurements of left atrial and left ventricular dimensions obtained from preoperative echocardiography ranked highest in importance. However, the diagnostic labels for left atrial enlargement and left ventricular enlargement scored at the bottom, presenting an apparent paradox. Reference Li, Liao and Wu30–Reference Li, Zhou and Hua32 By reviewing the model algorithm and the raw data, this anomaly is likely attributable to data missingness patterns and the feature extraction process for discrete variables. In the original dataset, cases with recorded specific left atrial/left ventricular measurements were also those diagnosed with chamber enlargement in majority. Patients with normal chamber sizes typically did not have these specific numerical values documented. During model training, the discrete diagnostic variables (recorded as 0 or 1) were transformed. The algorithm for treating missing value converted these into a vector where a value of 0 and assigned a random value less than 0.34, ultimately treated them as continuous variables. This transformation resulted in a distribution of values for the “enlargement diagnosis” features that were numerically similar, diminishing their discriminative power and leading to their lower importance scores. This specific case represents a unique exception among all the models constructed. No other models exhibited such a discrepancy where closely related indicators yielded opposing performance scores.
Regarding the results from preoperative electrocardiogram examinations, the high importance score of the RV5 voltage, which reflects left ventricular size and thickness, corroborates the significance of left ventricular dimensions in relation to postoperative arrhythmias. This was followed by the sagittal-plane R–T angle, which reflects right ventricular pressure and wall thickness and also demonstrated notable predictive value. The importance scores for the diagnoses of atrial enlargement and presence of premature or escape beats were zero, indicating that these specific electrocardiogram diagnoses show no apparent association with the postoperative arrhythmias within the scope of preoperative electrocardiogram. While left atrial size measured by preoperative echocardiography held a dominance in its respective model, P-wave amplitude in lead II, an electrocardiogram parameter that can indirectly reflect atrial size, ranked significantly lower in the electrocardiogram model. This disparity suggests that electrocardiogram has weaker detection efficacy for atrial dimensions, and P-wave data may be difficult to utilise for prognostic prediction in this context. Conversely, the RV5 voltage ranked highest in the preoperative electrocardiogram model, which aligns perfectly with the top-ranking position of left ventricular size in the echocardiography-based model. This mutual corroboration between an electrical parameter (RV5) and an anatomical measurement (left ventricular size) strongly validates the correlation between left ventricular dimensions before operation and postoperative prognosis.
Among the indicators from the postoperative day 1 electrocardiogram, the T-wave axis, QRS axis, and transverse plane R–T angle showed notable significance for the prognosis. More importantly, the ranking and scores for QRS duration, diagnosis of conduction block, and P-wave axis increased significantly compared to the preoperative electrocardiogram model. This indicates that the ventricular septal defect closure procedure distinctly altered the electrophysiological processes related to these conduction-related parameters. It suggests that early postoperative electrocardiogram changes could be correlated with long-term prognosis. In the postoperative day 3 electrocardiogram, QRS duration and RV5 ranked highest. QRS duration represents ventricular depolarisation time and can indicate the presence of intraventricular conduction delay. Its ranking improved from the third place on postoperative day 1 to the first place on day 3, suggesting that the degree of left ventricular thickness and possible occurrence of bundle branch block on early days may led to more pronounced influence in prognosis. Furthermore, the correlation of early conduction abnormalities may become more distinctly expressed at a slightly later time point, such as postoperative day 3.
In the follow-up electrocardiogram, indicators reflecting the degree of right ventricular thickness (RV1 voltage), diagnosis of conduction block, R-wave axis, R–T angle, and QRS duration had a greater impact on prognosis. A shift happens in the indicators that shows a clear correlation with prognosis over a longer postoperative period. While the ranking of QRS duration decreased, it still remained significant over the long term. It was supplanted in prominence by the degree of right ventricular thickness, the R-wave axis (reflecting the ventricular size imbalance), and the presence of conduction block over time. The descriptive indicator “normal electrocardiogram result” (meaning an electrocardiogram without any abnormal diagnoses) had an extremely low importance score through all four electrocardiogram model. This implies both patients with ultimately normal or abnormal outcomes may exhibit some minor electrocardiogram abnormalities, but in the end, not all abnormalities are result in a bad outcome.
Based on ventricular septal defect pathological characteristics, surgical procedure information, and a total of four sets of preoperative and postoperative electrocardiogram data, we were able to establish a suite of models capable of learning and classifying different data types. Reference Li, Hua, Fang, Wan, Wang and Zhou22,Reference Lin, Tang, Zhang and Li33,Reference Wang, Zhou and Luo34 The models demonstrated good predictive performance for postoperative outcomes on the test set, confirming their utility for prognosis assessment. Reference Promphan, Wongwaitaweewong and Eleena35–Reference Liu, Zhang, Zhang, Han and Jiang38 A key value provided by the Random Forest model is its ability to rank the importance of all input features. Beyond highlighting the most relevant factors, this allows us to observe how the significance of certain indicators evolves across the six models corresponding to different time points, from preoperative to postoperative stages. This evolution assists in understanding the roles of various pathological features during the disease and treatment.
The primary limitation of this study lies in the extensive data exclusion during the compilation and curation process. Only approximately one-third of the cases in the overall patient dataset met the predefined data requirements for the research objectives. Furthermore, the model’s imputation method for handling isolated missing data points introduced potential issues, like the conflicting importance scores between left atrial and ventricular measured dimensions and their corresponding diagnostic labels (presence of chamber enlargement). For study design, the outcome definition was heterogeneous, as all types of conduction blocks were grouped together into a single binary outcome (block vs. no block) due to limited sample sizes for every individual subtype. Although this approach was necessary to increase the sample size of the conduction-block group, it provides only a crude prediction of the presence or absence of conduction block and may obscure differences in the clinical significance and underlying mechanisms of specific conduction disturbances. Second, the models lack external validation. Although our internal test sets demonstrated robust performance, the absence of an independent external cohort limits the generalisability of our findings to other populations or institutions. Third, the follow-up process and inclusion criteria of 3-year data may leave potential bias: patients with favourable outcomes may be less likely to adhere to the full follow-up schedule, as they might perceive less need for regular hospital visits. This could lead to uneventful cases in the longer-term follow-up data, potentially influencing the observed associations and model performance.
Conclusion
Despite these limitations, the model based on electrocardiogram and vectorcardiogram alternations exhibited robust predictive performance on this retrospectively curated real-world dataset in predicting long-term persistent heart conductive disorders after transcatheter closure of ventricular septal defect, demonstrating its compatibility and resilience. As future clinical activities will generate new, well-curated, and complete case data, incorporating these into the model is expected to further enhance its predictive efficacy and generalisability.
Supplementary material
The supplementary material for this article can be found at https://doi.org/10.1017/S1047951126123506.
Data availability
All the data had been presented in the manuscript. Other data sets used in this study are available from the corresponding author upon reasonable request.
Acknowledgements
YL was funded by National Natural Science Foundation of China (grant no. 82470249 & 82370236), Open Research Fund Program of State Key Laboratory of Biocatalysis and Enzyme Engineering (grant no. SKLBEE2021008), and the Technology Project of Sichuan Province of China (grant no. 2024YFFK0078 & 2024YFFK0367). WL was funded by Medical Research Project Plan of Sichuan Province (S22068).
Author contribution
Wang Q and Xia Y contributed equally to this work. Wang Q, Wei L, and Xia Y collected the clinical data. Wang Q, Hua Y, Zhou K, and Li Y reviewed the literature and contributed to manuscript drafting; Li Y, Li W, and Hua Y conceptualised and designed the study, coordinated and supervised data collection, and critically reviewed the manuscript for important intellectual content. Li W and Li Y were responsible for the revision of the manuscript for important intellectual content; all authors issued final approval for the version to be submitted.
Competing interests
The authors declare that they have no conflict of interest.
Ethical approval
This study was approved by the Ethics Committee of West China Second Hospital of Sichuan University (2021-069). And informed consent from all the patient’s parents had been obtained, including the patient’s clinical and imaging details in the manuscript for the purpose of publication.