INTRODUCTION
The estimation of food consumption is of basic importance to implement multi-species fishery models that incorporate trophic interactions (Ross, Reference Ross1986). Consumption estimates also constitute important parameters in aquatic ecosystem models (e.g. ECOPATH, Christensen & Pauly, Reference Christensen and Pauly1992) helping to assess energy flows between compartments or trophic levels. Usually consumption rates, combined with digestion rates, are estimated using stomach content weights measured over a given sampling interval (Eggers, Reference Eggers1977; Elliot & Persson, 1978; Pennington, Reference Pennington1985; Hall et al., Reference Hall, Gurney, Dobby, Basford, Heaney and Robertson1995). In particular, the standard procedure consists in specific surveys designed to provide samples of stomach contents at regular time intervals throughout a 24 hour period.
Such an exercise may be particularly difficult for species such as the gadoids (e.g. cod and hake), whose catch decreases significantly during night as a result of diel vertical migration (Bowman & Bowman, Reference Bowman and Bowman1980; Beamish, Reference Beamish1966; Pillar & Barange, Reference Pillar and Barange1997; Carpentieri et al., Reference Carpentieri, Colloca, Belluscio, Criscoli and Ardizzone2006). The use of consumption methods for these species could underestimate the rate of food intake, because a substantial proportion of the population shows a reduced catchability at night. This is particularly true for juvenile hake in the Mediterranean, which accomplish extensive vertical migrations at night to feed euphausiids (Orsi-Relini et al., Reference Orsi Relini, Zamboni, Fiorentino and Relini1997) and consequently reduce to zero their catchability during night bottom trawls (Carpentieri et al., Reference Carpentieri, Colloca, Belluscio, Criscoli and Ardizzone2006).
European hake (Merluccius merluccius) is one of the most abundant commercial fish species in the Mediterranean Sea, particularly off the western coasts of Italy where large nursery areas are located (Orsi-Relini et al., Reference Orsi Relini, Cappanera and Fiorentino1989; Ardizzone & Corsi, Reference Ardizzone and Corsi1997; Colloca et al., Reference Colloca, Belluscio and Ardizzone2000; Abella et al., Reference Abella, Serena and Ria2005). In the Mediterranean, the importance of hake in the trophic web has been demonstrated by different studies (Stergiou & Karpouzi, Reference Stergiou and Karpouzi2001). Despite those studies analysing its feeding behaviour also in relation with growth (Bouaziz et al., Reference Bouaziz, Djabali and Maurin1990; Bozzano et al., Reference Bozzano, Recasens and Sartor1997; Carpentieri et al., Reference Carpentieri, Colloca, Belluscio and Ardizzone2005) the information on consumption rate for juvenile and adult hake is still fragmentary, with the exception of Cartes et al. (Reference Cartes, Rey, Lloris and Gil de Sola2004) who gave a partial estimation of the consumption rate of M. merluccius during three 8 hour sampling cycles.
In the present study, stomach data of juvenile hake (<16 cm total length) were collected during four 24-hour bottom trawl surveys to obtain a direct estimation of daily ration by back-calculating the fresh weight of food eaten at night. We also provide an evaluation of the bias that the application of traditional consumption methods (e.g. Elliot & Persson, 1978; Eggers, Reference Eggers1979) may introduce in estimating the consumption rate for juvenile hake.
MATERIALS AND METHODS
Hake sampling was carried out on the continental shelf-break of the central Mediterranean Sea. This area goes from 120 m to 160 m in depth and occurs at approximately 30 km far from the shoreline. The continental shelf-break is characterized by detritic organogen sediments colonized by the crinoid Leptometra phalangium (Colloca et al., Reference Colloca, Carpentieri, Balestri and Ardizzone2004). This is a suspensivor macro-epibenthic species confined in the Mediterranean Sea on the shelf break area. Colloca et al. (Reference Colloca, Carpentieri, Balestri and Ardizzone2004) showed that this area hosts a well defined fish assemblage, persistent over years and seasons which is characterized by a high abundance of juveniles and spawners of commercially exploited species (i.e. M. merluccius).
All the samples were collected during four 24-hour surveys conducted respectively in July and November 2001, and March and May 2002. Surveys were carried out with a commercial otter trawl vessel, equipped with a cod-end bag liner of 40-mm-stretched-mesh size. Vertical opening of net was around 150 cm. The towing speed of the vessel was about 3 knots and each trawl haul covered a distance of approximately 2.8 km.
In each survey 8 hauls of 30-minutes were performed every three hours throughout the 24-hour period to cover the entire diel cycle. The trawling station was located at a depth of 140–160 m (outer boundaries: latitude 41°30′08, longitude 12°14′66; latitude 41°314′3, longitude 12°13′21). Fish were brought back to the laboratory, where individual total body weight (BW; measured to the nearest 0.01 g), and total length (TL; rounded to the next half centimetre) were measured. Stomachs were removed and preserved in 70% ethanol solution, and prey were identified to the lowest possible taxonomic level, counted, and weighed (to the nearest 0.1 mg).
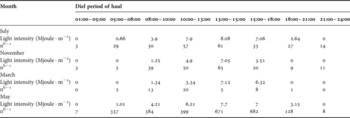
Three common measures were used to evaluate the relative importance of various prey types and to provide a quantitative description of stomach contents: per cent frequency of occurrence (%F), per cent numerical abundance (%N) and the wet weight prey abundance per cent (W%) (Hyslop, Reference Hyslop1980). The diel feeding periodicity during the 24-hour cycles was investigated by means of stomach fullness index, expressed as the percentage ratio of the weight of a fish's stomach contents to its total body weight (%FI = Ws/Wt * 100), computed per setting time (Tudela & Palomera, Reference Tudela and Palomera1995; Benli et al., Reference Benli, Kaya, Unluoglu, Katagan and Cihangir2001). The diel pattern in feeding activity was discussed comparing two independent variables: stomach fullness index (%FI) and fish density (expressed as number of individuals per hour d = nh−1). One way-ANOVA was used to test for differences in fullness index (%FI) and fish abundance between day periods (dawn, daylight, sunset and night), used as a proxy for light intensity. The differences were considered significant at P < 0.05. To carry out the analysis all four surveys catch data were log-transformed (y + 1). Variables were tested for normality using the Shapiro–Wilk test. Average values of light intensity for each day period were obtained from data collected at Anzio (latitude 41°26′30, longitude 12°37′84) by MIPAF (Italian Ministry of Agricultural and Forest Policy) during the period 2001–2002 (Table 1).
Daily values of the monthly average surface light intensity (MJoule · m−2) recorded during the four sampling periods. For each haul the total collected number of specimens (nh−1) is reported.

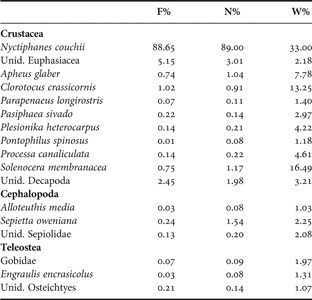
An estimate of the amount of food consumed was deduced empirically by computing the mean weight of a fresh food item, the euphausiid Nyctiphanes couchii. This crustacean was found in 90% of the stomachs of juvenile hake (Table 2). The mean weight of N. couchii (0.01 g) was calculated weighing all the individuals still undigested in the stomachs and comparing the results with the data available in the literature (Fanelli, Reference Fanelli2007). Once we identified the number of specimens present in the stomachs at time t0+1 it was possible to estimate the weight of wet food ingested at time t0 (initial feeding time). Once we determined the total consumption at time t0, the mean value of all non-digested prey on the basis of the ratio of the per cent stomach wet weight to predator weight (%BW) was used as an estimate of the food consumed during the sampling period. Starting from this assumption, it was possible to back-calculate food ingested at the beginning of the time interval for each period of the year. The inaccuracy of this method originates from the possibility of either erroneously accounting for food items from previous digestion (e.g. carapax or other hard parts that have a long residence time in the predator's stomach) or, conversely, missing fragile or soft parts that may have been digested between any two sampling periods.
Juvenile hake trophic spectrum. Prey items are reported as frequency of occurrence (F%), numerical abundance (N%) and biomass composition (W%).

Unid., unidentified
Our empirical results were compared to the daily ration (%BW) calculated using the models developed by Elliot & Persson (1978) and Eggers (Reference Eggers1979), that have already been adopted for other species in the central Mediterranean deeper shelf (Carpentieri et al., Reference Carpentieri, Colloca, Belluscio, Criscoli and Ardizzone2006). In order to estimate daily ration, the instantaneous food evacuation rate R must be obtained. The R value was determined both experimentally and from a temperature based model (Worobec, Reference Worobec1984; Macpherson, Reference Macpherson1985).
The first method was ascertained by the apparent rate of decline in stomach fullness (per cent body weight evacuated per hour), defined as:

Empty stomachs were excluded from the analyses described above because they would have biased estimates of evacuation rates (Olson & Mullen, Reference Olson and Mullen1986; Pillar & Barange, Reference Pillar and Barange1995).
The second model, the most widely accepted in the literature to describe food evacuation in most fish species, is probably more appropriate for describing the evacuation of small, relatively easily digested particles from the stomach (Jobling, Reference Jobling1986). In this model: R = 0.0175T−0.0442, where T is the temperature in degrees Celsius. Evacuation rate R depends primarily on water temperature and on the prey food type whereas it is not influenced by fish size, food size and by the frequency of feeding (Elliot & Persson, 1978; Durbin et al., Reference Durbin, Durbin, Langton and Bowman1983; Macpherson, Reference Macpherson1985). The constant temperature regime in the study area, around 13°C±0.5 down to 120–200 m depth all year around (Ifremer, 1997), means that our estimates of daily ration were probably free of temperature influence.
RESULTS
Daily abundance
The highest density value (d = 327 nh−1) was obtained in May during the recruitment period. The lowest values were obtained in March (d = 6 nh−1) and November (d = 25 nh−1), respectively. Table 1 shows the diel change in hake density in the different sampling periods.
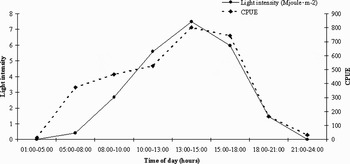
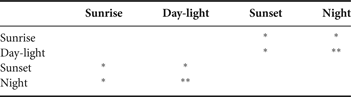
Diel pattern of M. merluccius (Figure 1) indicated a strong correlation between abundance (CPUE) and day-light hours from 08:00 to 18:00 h (r: 0.72; P < 0.01). In each period (Table 3) the abundance measured during diurnal hauls (light > 1.50 MJ/m2) was significantly higher (P < 0.01) than that measured during nocturnal ones (light <1.50 MJ/m2). Fish density ranged from 8–1098 nh−1 (average 164 nh−1) during daylight and from 0–337 nh−1 (average 17 nh−1) at night. The daytime/density was significantly higher in May (P < 0.01) with light values >2 MJ/m2.
Relationship between mean daily values (MJoule · m−2) of the surface light intensity recorded during the sampling periods, and the CPUE (catch per unit effort) reported as number of specimens per hour (n · h−1).

Differences in hake abundance between day and night hauls.
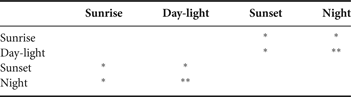
* significant at P < 0.05; **significant at P < 0.01.
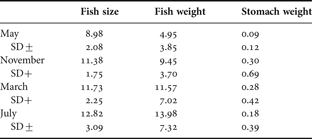
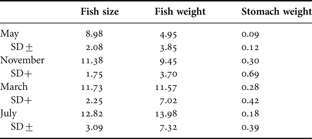
As regards size distribution (Table 4), fish length ranged between 4 and 16 cm TL. In May the bulk of the population was constituted of newly settled hake (8.98 cm TL, DS ± 2.08), with an increase in size in July (12.82 TL cm, DS ± 3.09), while in March and November the mode was quite similar (around 11.50 cm TL).
Summary data of trawl samplings. Mean size of individuals in cm (TL); mean weight of fish and stomach contents in g. SD, standard deviation.
Feeding periodicity
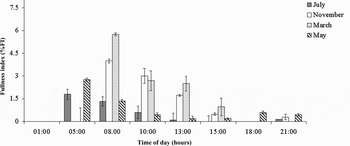
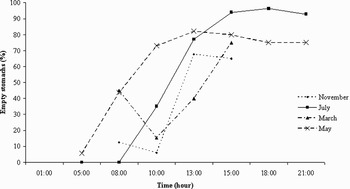
Data revealed a clear pattern of feeding activity by juvenile hake although no reliable data on stomach fullness were available for the night time (i.e. from 23:00 to 03:00 h), when fish move out of the bottom, and consequently from the trawler-net. Fullness index (%FI) was generally higher during sunrise when migratory activity ceased and juvenile hake return to the bottom after feeding (Figure 2). The fullness of stomachs decreased significantly (P < 0.05), during the day, attaining minimum values around 18:00 h. Conversely the proportion of empty stomachs (Figure 3) was significantly lower (P < 0.01) in early morning than in the period from early afternoon (13:00 h) to sunset (18:00–21:00 h).
Relationship between time and stomach fullness expressed as %FI (weight of a fish's stomach contents to its total body weight) in the different sampling periods.

Relationship between time and empty stomachs expressed as a percentage of the number of stomachs examined during the 24-hour sampling periods.

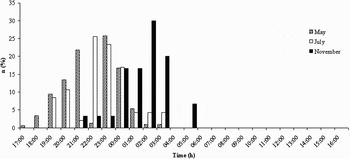
Stomachs showed prey items at different digestion stage during sunrise and this is reflected by the frequency distribution of back-calculated feeding time (Figure 4). Starting at 19:00 h, a variable proportion of the population is feeding at any one time, showing a rather heterogeneous pattern, even though one or two main peaks can be observed, depending on the season. Back-calculated feeding time in May and July seems to be more concentrated between 23:00 and 01:00 h followed by a slight decline in the hours before dawn. In November, feeding activity was estimated to range between 01:00 and 04:00 h. Back calculation of feeding time was not possible in March due to the low number of specimens collected.
Back-calculated feeding time over the 24-hour sampling periods; n% represents the proportion of hake specimens feeding at different time (h).

Gastric evacuation rate and daily ration
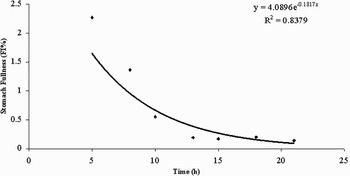
The rate of decline in stomach fullness was calculated for hakes captured during the day, when no feeding on euphausiids is ongoing. The mean stomach fullness values (%FI) showed an exponential rate of decline over the entire study period (Figure 5). The gastric evacuation rate R by juvenile hake feeding on euphausiids was estimated to be equal to 0.183 h−1 giving a projected mean time of 9.5 hours to evacuate around 95% of their gut contents. The R value estimated in this study resulted in full agreement with the 0.181 h−1 obtained from experimental data by Worobec (Reference Worobec1984), who considered fish feeding on small prey (i.e. small crustaceans).
Exponential decrease in mean stomach fullness (%FI) of juvenile hake over 24-hours.

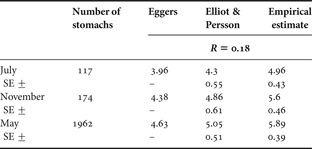
Consumption rate calculated by our empirical attempt, at the beginning of each of the sampling periods, was projected to an estimation of food consumed during the day between 4.96 and 5.89 %BW (Table 5).
Daily ration estimates (expressed as percentage of fish body weight) obtained both with the Elliot & Persson (1978) model and Eggers (Reference Eggers1979) model, and with the direct estimation of the consumption rate. SE, standard error.
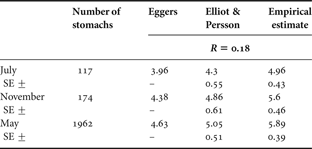
Applying an R value of 0.183 h−1, daily consumption varied between 4.3 (July) and 5.05%BW (May) using the Elliot & Persson model and from 3.96 (July) to 4.63 (May) %BW derived from the Eggers method (Table 5). Also in this case, the small number of specimens collected in March did not allow estimation of daily ration.
DISCUSSION
Hake is a nektobenthic fish that accomplishes diel vertical migrations, concentrating near the bottom during daytime and moving into pelagic layers at night (Alheit & Pitcher, Reference Alheit and Pitcher1995). This behaviour has been documented for most of the hake species in the Atlantic and Pacific area (Merluccius capensis: Payne et al., Reference Payne, Rose, Leslie, Payne, Gulland and Brink1987; Pillar & Barange, Reference Pillar and Barange1995; Merluccius paradoxus: Gordoa & Macpherson, 1981; Merluccius hubbsi, Merluccius australis: Angelescu & Prenski, Reference Angelescu and Prenski1987; Merluccius productus: Sakuma & Ralston, Reference Sakuma and Ralston1997). Pillar & Barange (Reference Pillar and Barange1997) and Adlerstein & Welleman (Reference Adlerstein and Welleman2000) evidenced light as one of the most important factors to determine gadoid abundance throughout the 24-hour period in the Atlantic Ocean. A similar pattern was already observed for juveniles of cape hake M. capensis (Pillar & Barange, Reference Pillar and Barange1995). In any case, as pointed out by Bozzano et al. (Reference Bozzano, Sardà and Rìos2005), the response of fish to light condition could be affected by other environmental factors, such as prey availability.
Results of our study show juvenile hake off the central coast of western Italy begin to move up in the water column after dusk, breaking away from the bottom, to prey upon euphausiid shoals. The strong reduction in catch rate at night indicates that such migration involves a large part of the juvenile hake population. During daytime fish stay close to the bottom avoiding any feeding activity until their stomachs are virtually empty. In the Mediterranean, this phenomenon is well known for hake (<16 cm TL) and is clearly linked to feeding activity (Orsi-Relini et al., 1997; Bozzano et al., Reference Bozzano, Sardà and Rìos2005). As observed by Orsi-Relini et al. (1997) in the Ligurian Sea (north Mediterranean), the pelagic migration of juvenile hake coincided with intensive feeding during evening and night.
Stomach content analyses indicate that juveniles of hake feed mostly on planktonic crustaceans, typically the euphausiid N. couchii. This species carries out nictemeral migrations forming large schools that move near surface at night (Casanova, Reference Casanova1970; Vallet & Dauvin, Reference Vallet and Dauvin1998). The seasonal trend of euphausiid abundance in the western Mediterranean basin generally shows an increase from spring to autumn (Franqueville, Reference Franqueville1971). These peaks are associated with the existence of permanent frontal systems (Sabatés et al., Reference Sabatés, Gili and Pages1989) offshore to the shelf area occupied by hake. The concentration of zooplanktivorous predators, such as juvenile hake, on the shelf break during spring period (May) is correlated with the occurrence of large patches of macrozooplanktonic organism in this area (Colloca et al., Reference Colloca, Carpentieri, Balestri and Ardizzone2004). Papaconstantinou & Caragitsou (Reference Papaconstantinou and Caragitsou1987) confirmed that juveniles of M. merluccius of the eastern Mediterranean follow these migrations moving from near the bottom to midwater at night. The same pattern occurs off the coast of California at or near the shelf break, where an overlap of large shoals of Pacific hake (M. productus) and large patches of euphausiids have been observed (Swartzman, Reference Swartzman1999). This species feeds principally at night, following the movements of its prey along the water column (Bailey et al., Reference Bailey, Francis and Stevens1982; Livingstone, Reference Livingstone1983). The same pattern was evidenced for M. bilinearis and M. paradoxus in the Atlantic (Vinogradov, Reference Vinogradov1977; Bowman & Bowman, Reference Bowman and Bowman1980; Durbin et al., Reference Durbin, Durbin, Langton and Bowman1983; Roel & Macpherson, Reference Roel and Macpherson1998). Predator avoidance can be another explanation for the vertical displacement in water column of juvenile hake schools, particularly when cannibalism is high (Tanasichuk et al., Reference Tanasichuk, Ware, Shaw and McFarlane1991).
Movements in the water column are mainly evident during the first year of hake life as Neilson & Perry (Reference Neilson and Perry1990) pointed out. Such movements in the water column are considered to be at least partially responsible for the fact that, in the Mediterranean shelf-break, bottom diurnal trawl catches of hake are mainly composed of juveniles (Papaconstantinou & Caragitsou, Reference Papaconstantinou and Caragitsou1987; Colloca et al., Reference Colloca, Belluscio and Ardizzone2000; Carpentieri et al., Reference Carpentieri, Colloca, Belluscio and Ardizzone2005).
Reduced bottom trawl catches at night (from 21:00 to 05:00 h) imply that the feeding starting point through night hours is missed and, as a result, the application of commonly used consumption models (i.e. Eggers, Reference Eggers1977; Elliott & Persson, Reference Elliott and Persson1978) may underestimate consumption and daily ration. The metabolic rates obtained by our empirical estimates, 15–20% higher than those achieved using common models, could be a source of evidence for this. The direct estimation of consumption rate, through back-calculation of fresh stomach content weight, depends on the validity of two main assumptions: (1) fish do not feed during daylight hours; and (2) food ingested during night hours is not completely digested before dawn, i.e. it is possible to estimate the exact number of prey eaten by each individual captured at dawn. These two assumptions seemed to be met by juvenile hake considering, as shown above, their daily feeding pattern and the estimated gut evacuation time.
As stated by Boisclair & Leggett (Reference Boisclair and Legget1988), the use of the Eggers (Reference Eggers1979) method is more indicated for species that show marked feeding peaks. However, special care is necessary when dealing with species whose behaviour may make them unavailable to the sampling gear at given periods of the day. In our study, the population of juvenile hake follows a diel cycle that partially precluded the estimation of food consumption from daily ration models. Our approach, although more time-consuming, allowed for the identification of partially digested prey remains to the lowest taxonomic level and to back-calculate the biomass of prey ingested. The accuracy of this method is uncertain but it can be used as an approximation of the actual food consumed by juvenile hake.
As stated by Worobec (Reference Worobec1984), the error in the calculation of food consumption is mainly dependent upon R. In our study, the estimation of R from field data was consistent with that obtained using Macpherson's equation (1985) at 13°C (0.183 h−1), the temperature where all the fish in our study were collected. This value corresponds to our estimate (0.181 h−1) and is well within the range of values used for other nektobenthic species with diets based on small prey (i.e. Carpentieri et al., Reference Carpentieri, Colloca, Belluscio, Criscoli and Ardizzone2006).
The estimated time of stomach content residence (7–13 hours up to the point of 90% of evacuation) suggests that juvenile hake feed every night. This is confirmed by the very high proportion of fish with full stomachs found during the early morning hauls in every season. It is difficult to compare the residence of contents found in this study with values reported in the literature: the methodology tends to differ and the information available, at least in the Mediterranean, is scanty. Slow rates of gut evacuation (from 42 hours to 3 days) found for other Merluccius species in the Atlantic appear to be a characteristic of cold-water gadoids (Bromley, Reference Bromley1991; Pillar & Barange, Reference Pillar and Barange1995). Differences could be also attributable to numerous factors, including assumptions relating to feeding periodicity and digestion rates, and in prey type and abundance (Durbin et al., Reference Durbin, Durbin, Langton and Bowman1983).
The present daily ration estimates with the empirical approach fall well within the range of estimates obtained by Pillar & Barange (Reference Pillar and Barange1995) for juvenile cape hake M. capensis off the west coast of South Africa (4.15–5.51%BW) feeding upon small pelagic fish. Conversely, our estimates are higher than the daily ration values reported for juvenile M. capensis, feeding mainly on crustaceans in Namibia waters (3.12–4.61%BW; Andronov, Reference Andronov1987). Velasco & Olaso (Reference Velasco and Olaso2000), estimating food consumption of M. merluccius in the Bay of Biscay, calculated that food ration for age 0 and age 1 ranged between 1.50 and 4.42%BW. Our estimates were also higher than those found for the silver hake M. bilinearis (2.3–3.1%BW) in the western North Atlantic (Edwards & Bowman, Reference Edwards, Bowman and Cleper1979).
A study by Durbin et al. (Reference Durbin, Durbin, Langton and Bowman1983) in the western North Atlantic, estimated the daily ration of silver hake <20 cm TL to be around 1.9 and 4.6%BW according to the season. Merluccius productus (over 35 cm TL) daily ration was estimated to be 2.5%BW by Livingstone (Reference Livingstone1983) and to range between 1.35 and 2.07%BW (Tanasichuk et al., Reference Tanasichuk, Ware, Shaw and McFarlane1991). Francis (Reference Francis1983) estimated a lower daily ration of 1.1%BW for the same species (with individuals ranging from 35–39 cm TL).
In the Mediterranean, food consumption of European hake has been poorly investigated. In a sampling survey carried out recently from the deeper shelf and the slope off the Catalan Sea (Cartes et al., Reference Cartes, Rey, Lloris and Gil de Sola2004), daily food consumption by hake showed a large spectrum (1.01 to 5.51%BW). Moreover, the estimated daily ration values are high compared to the range of other macroplanktonic active swimming predators (i.e. Hoplostethus mediterraneus; Madurell & Cartes, Reference Madurell and Cartes2005) or other benthic and nektobenthic species with diets based on small crustaceans (from 0.76 to 2.87%BW; Carpentieri et al., Reference Carpentieri, Colloca, Belluscio, Criscoli and Ardizzone2006).
The pattern of increasing food consumption with increasing mobility is similar to that found by Koslow (Reference Koslow1996) in a review of studies on metabolism and daily ration in deep sea species. The author showed that mesopelagic migrators or active swimmers (i.e. Hoplostethus atlanticus and myctophid fish) had progressively higher metabolic rates and daily ration than slow moving species.
Although the estimates that we presented are calculated over a restricted area and should be integrated with estimates obtained over larger geographical areas and with varying rates of food intake, the different 24-hour periods studied showed clear patterns for juvenile M. merluccius. The empirical model used in this study gave a good description of daily ration and therefore can be used as an available approach to the study of hake food consumption from stomach contents collected in the field. The lack of adequate information in the current Mediterranean literature on feeding processes in young hake makes comparison with the results presented here difficult. Thus, further research on daily ration for this species is needed, especially considering that such studies provide an indirect source of information on the carrying capacity of different environments (Tudela & Palomera, Reference Tudela and Palomera1995; Maynou & Cartes, Reference Maynou and Cartes1997).