Implications
The number of lambs weaned per ewe joined considerably increases the economic efficiency of meat sheep production. This trait is included in the selection objective of most French breeds. Numerous major genes affecting the ovulation rate, which contributes to the number of lambs weaned, have been identified in sheep populations. This paper aims to understand the consequences of various strategies of major gene management on the genetic trends of prolificacy in a nucleus breeding program and their economic impact at both the nucleus and commercial population levels.
Introduction
Major genes are managed in various livestock breeding programs including pigs (de Vries et al., Reference Villanueva, Pong-Wong, Grundy and Woolliams1998), poultry (Sodhi et al., Reference Sánchez, Ilahi, Manfredi and Serradilla2013), goats (Sánchez et al., Reference Piper and Bindon2005) and sheep (McEwan, Reference Martin, Raoul and Bodin1995; Palhière et al., 2003; Martin et al., Reference Manfredi, Barbieri, Fournet and Elsen2014). Standard BLUP (Best Linear Unbiased Prediction) selection tends to increase favorable allele frequencies in the population if no specific management practices are implemented (Fontanesi et al., Reference Elsen2015). However genetic prediction based on major gene information can increase the efficiency of selection, especially for low heritability traits, recessive alleles, low initial frequencies and strong allele effects (Larzul et al., Reference Hill1997; Gomez-Raya and Klemetsdal, Reference Fontanesi, Schiavo, Scotti, Galimberti, Calò, Samorè, Gallo, Russo and Buttazzoni1999; Sánchez et al., Reference Piper and Bindon2005; Carillier-Jacquin et al., Reference Carillier-Jacquin, Larroque and Robert-Granié2016). Manfredi et al. (Reference Larzul, Manfredi and Elsen1998) and Dekkers and Van Arendonk (Reference Dekkers and van Arendonk1998) found that including genotype information, by dynamic optimization of within-genotype selection and planned genotype-based mating, increased the cumulated and discounted genetic progress due to both a higher polygenic gain and an optimal increase in favorable allele frequency across generations. A simulation study highlighted the importance of the major gene management on long-term genetic progress and the inbreeding level (Villanueva et al., Reference Sodhi, Jeong, Sharma, Lee, Kim, Kim, Kim and Oh1999) and reported that including major gene information for breeding value prediction had only a limited effect.
The number of lambs produced per female has a large impact on profitability in meat sheep production (Cheype et al., Reference Cheype, Guerrier, Tortereau, François, Poivey, Chile and Raoul2013) and several major genes affecting this trait (indirectly through the ovulation rate) have been identified since the initial discovery in Booroola Merinos (Davis et al., Reference Davis, Montgomery, Allison, Kelly and Bray1982; Piper and Bindon, Reference Palhière, Elsen, Astruc, Barillet, Bed’Hom, Bibé, Bouix, Brochard, Catrou, Dion, François, Griffon, Jullien, Orlianges, Perret and Tribon1982). Most often, these polymorphisms have a positive effect on heterozygous carriers but, in homozygous ewes, the effect is either too large leading to high rates of neonatal lamb mortality, or there are fertility issues. Consequently, the optimal management of such genes is still a challenge (Bodin et al., Reference Bodin, Raoul, Demars, Drouilhet, Mulsant, Sarry, Tabet, Tosser-Klopp, Fabre, Boscher, Tiphine, Bertrand, Bouquet, Maton, Teyssier, Jouannaux, Hallauer, Cathalan, Gueux and Pocachard2011). For mutations localized on the X chromosome, such as Inverdale, several strategies can be implemented as pointed out by McEwan (Reference Martin, Raoul and Bodin1995) and Amer et al. (Reference Amer, McEwan, Dodds and Davis1998). However, the optimal management of a mutation localized on an autosomal chromosome, such as the FecL mutation (Drouilhet et al., Reference de Vries, Sosnicki, Garnier and Plastow2009), might be different. A planned mating scheme based on sire and dam genotypes (say mm, m+ and ++ for a biallelic m/+ locus) is one of the most important components for the optimal management of such a mutation. A maximum of nine mating types are possible with a biallelic locus. The selection of the parents within each genotype based on their polygenic value (Estimated Breeding Value, EBV) is the other component of this management strategy. With the exception of matings between homozygous carriers and non-carriers (mm by ++), all mating combinations are self-sufficient: parental genotypes are present in the progeny born from their mating (e.g. m+ females mated to ++ males produce both m+ and ++ progeny). Each mating type has its own characteristics: the proportion of a given genotype in their progeny varies (e.g. mm by ++ will produce only m+ progeny, whereas mm by m+ produce 50% of m+ and mm) as well as the number of progeny produced (higher for m+ compared with ++ females due to the allele effect). Matings between homozygous carriers mm and non-carriers ++ cannot be implemented alone and need at least one additional type of mating to produce replacements. In addition, some mating combinations increase the selection intensity and result in a higher genetic gain. For each mating combination, the heterozygous frequencies in both the nucleus and the commercial population, the genetic gain and the amount of genotyping involved can be determined.
The aim of this study was to determine the optimal strategy (combination of matings) that maximizes the benefit of the breeding scheme when homozygous carrier females are systematically culled. Complex breeding organization would typically be required to implement the optimal strategy, so the latter was also compared with simpler strategy that breeders would find easier to implement. First, a simple discrete generation deterministic model was developed to determine the optimal strategy according a range of genotype effects (GEs) and genotyping costs (GCs). Then, an overlapping generation deterministic model was developed to illustrate such an approach with the real example of the French Lacaune meat sheep breeding program OVI-TEST (Reference McEwan2016).
Material and methods
Discrete generation model
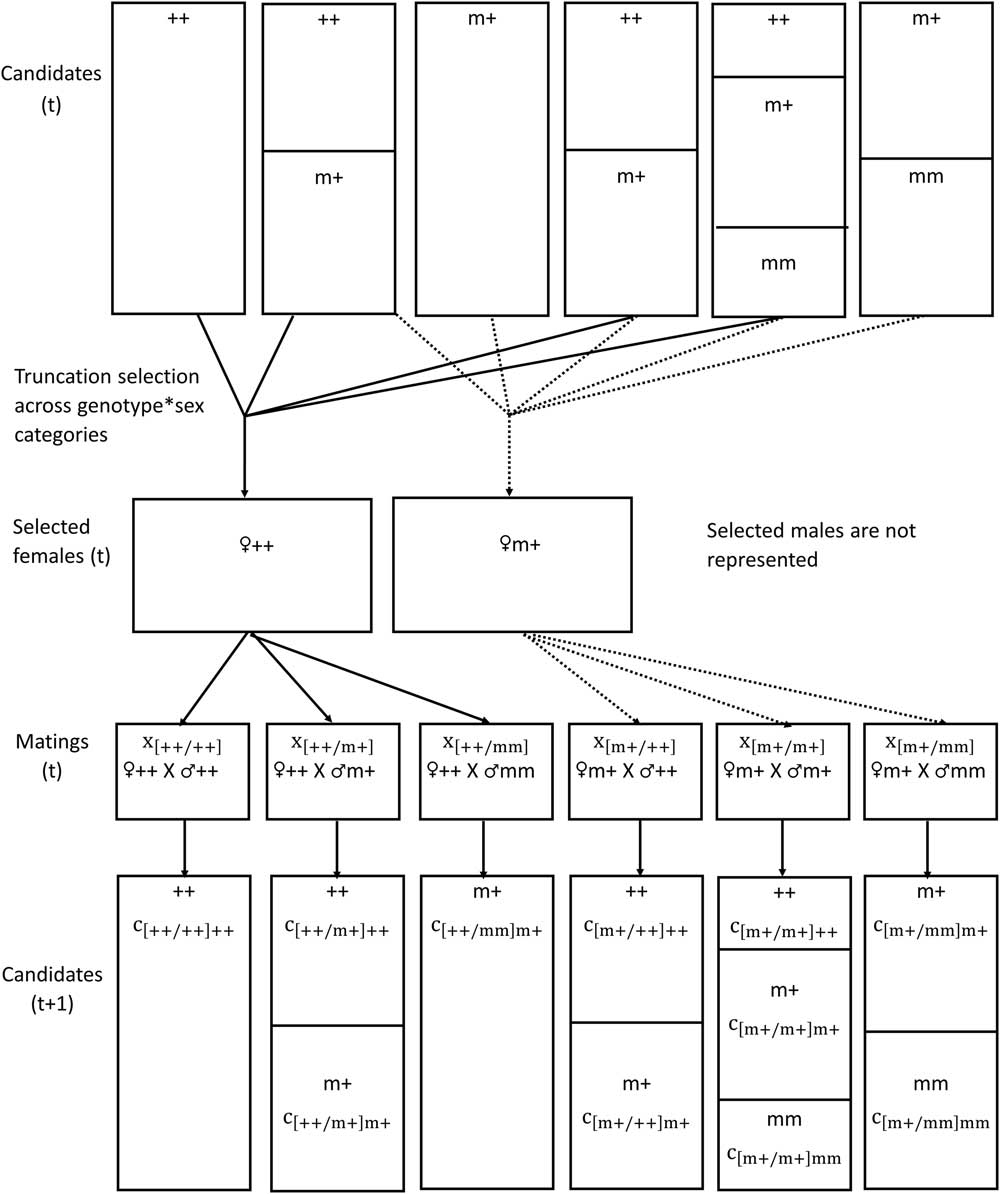
Variables, parameters and input values of parameters are defined in Table 1. At each time t, nb F =1000 females were mated to nb M =200 males to produce a new candidate generation. A steady state was supposed and the proportions of each possible mating, that is, parental genotype combinations, were constant across generations. Homozygous carrier females were not used due to the negative phenotypic effects on reproduction associated with this genotype, leaving six possible matings: heterozygous (♀ m+) and non-carrier (♀++) females could be mated with non-carrier (♂++), heterozygous (♂ m+) or homozygous carrier (♂ mm ) males. As described in Figure 1, the candidate population was divided into categories according to their sex a (m or f), their genotype g=++, m+, mm and their dam×sire genotype combination (i.e. mating [g d g s ]). The number of weaned lambs per female was the only selected trait. Parents of the next generation were selected based on their EBVs within each genotype and the mating combinations (i.e. dam×sire genotype combination) from which those genotypes where produced (e.g. mm progeny can be derived from ♀ m+×♂ m+ and ♀ m+×♂ mm ). It was assumed that polygenes affecting the selected trait and the major gene genotypes were genetically independent. The mean EBVs of the categories in the next generation were computed in accordance with the mating plan and selection intensities. An objective function which included discounted incomes (from slaughtered lambs) and costs (due to genotyping) was used to assess the economic value of the mating design assessed.
Overview of the discrete generation model. To simplify the subscript a (sex) has been removed.
 $c_{{\left[ {g_{d} g_{s} } \right]g (t)}} $
=animal number belonging to [g
d
g
s
]ga category at t; [g
d
g
s
]=parental genotype (mating type); g=candidate genotype.

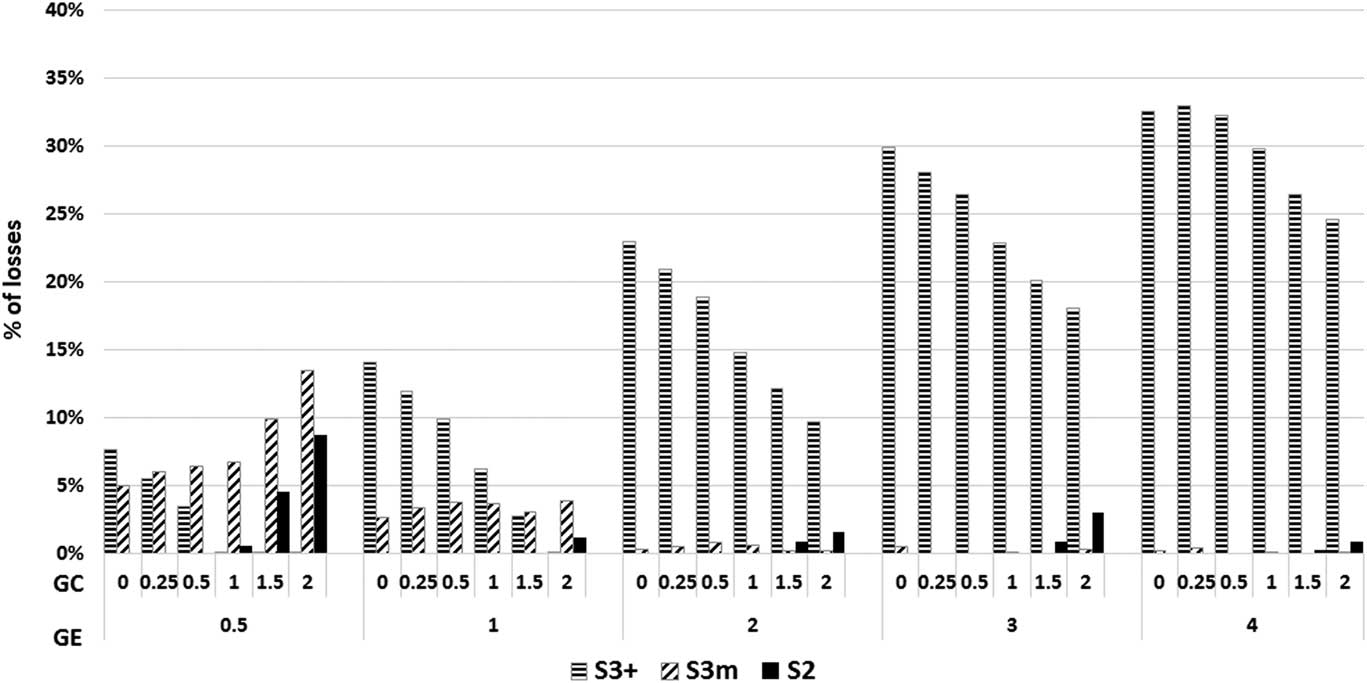
Parameters of the models

1 Variable only implemented in the overlapping generation model.
2 Variable only implemented in the discrete generation model.
3 Per productive life for the discrete model and per lambing for the overlapping model.
Categories
The number of animals per candidate category at time t,
 $c_{{\left[ {g_{d} g_{s} } \right]ga\left( t \right)}} $
, depended on
 $x_{{\left[ {g_{d} g_{s} } \right]}} $
, the number of g
d
dams mated to g
s
sires,
 $\beta _{{\left[ {g_{d} g_{s} } \right]g}} $
, the proportion of candidates of genotype g born from parents of genotype [g
d
g
s
],
 $NLFN_{{g_{d} \left( {t{\minus}1} \right)}} $
the number of progeny per nucleus dams with genotype g
d
at t−1 and the proportion of sex a (0.5) among progeny:
 $c_{{\left[ {g_{d} g_{s} } \right]ga(t)}} \,{\equals}\,x_{{\left[ {g_{d} g_{s} } \right]}} {\times}\beta _{{\left[ {g_{d} g_{s} } \right]g}} {\times}NLFN_{{g_{d} (t{\minus}1)}} {\times}0.5$
. As some genotypes were not produced for a given mating (e.g.
 $\beta _{{\left[ {{\plus}\!{\plus}\!/\!{\plus}\!{\plus}} \right]m{\plus}}} {\equals}\beta _{{\left[ {{\plus}\!{\plus}\!/\!{\plus}\!{\plus}} \right]mm}} \,{\equals}\,0$
), only 11 categories corresponding to
 $\beta _{{\left[ {g_{d} g_{s} } \right]g}} \,\ne\,0$
are reported in Figure 1. A mating design was fully described by the set x of
 $x_{{[g_{d} g_{s} ]}} $
values (g
d
=++, m+ and g
s
=++, m+, mm). Without loss of generality, the GE was defined as the phenotypic difference between m+ and ++ females for the selected trait due to the major gene. Different values of GE were assessed (Table 1). The EBV average reliability of parents was assumed to be 0.35 for all candidate categories.
Genetic model
A genetic model was implemented to describe the genetic evolution of the selected trait over time. The classical gene flow approach described by Hill, Elsen and Mocquot (Elsen and Mocquot, Reference Drouilhet, Lecerf, Bodin, Fabre and Mulsant1974; Hill, Reference Gomez-Raya and Klemetsdal1974; Elsen, Reference Elsen and Mocquot1993) was adapted to candidate categories (but not parents) using:
 ${\bf ebv}_{{{\mib{t}} {\plus}1}} \,{\equals}\,{\mib{P}} {\times}({\bf ebv}_{{\mib{t}} } {\plus}{\mib{d}} _{{\mib{t}} } )$
, where
P
denotes the transition matrix describing the gene flow between candidate categories after one generation, ebv
t
and
d
t
the vectors of the average EBV and selection differential per candidate category at time t.
New parents were selected within sex×genotype by truncation selection on their EBVs: five single truncation thresholds (two for females and three for males) were determined across candidate EBV distributions: ++ parents were selected among candidates produced from matings [++/++], [++/m+], [m+/++] and [m+/m+], m+ parents from [++/m+], [++/mm], [m+/++], [m+/m+] and [m+/mm] and mm males (only) from [m+/m+] and [m+/mm]. Selected parents were randomly assigned to a type of mating to produce the next generation.
To minimize boundary effects (i.e. a very low number of selected animals within a category that would lead to extreme selection differentials), we computed selection differentials for categories that represented at least 2% (within sex) of the parent population. Applying the gene flow equation, we computed the mean EBV per category at t+1 and updated the average phenotypic value of parents selected for the nucleus or transferred to the commercial population. Computational details are provided in Supplementary Material S1.
Objective function
Incomes were modeled as the number of lambs slaughtered multiplied by the marginal value per animal slaughtered (independent of genotypes), whereas costs were proportional to the genotyping needs. As marginal value per animal and cost per genotyping are subjected to evolve, we expressed the GC as a proportion of marginal value. A low GC means that the cost per genotyping is low regarding to the marginal value per slaughtered animal. A large range of values was considered (from 0 to 2, see Table 1) to cover all possible situations. The genotyping needs at time t, Geno t , depended on the number of parents selected from each type of mating. The genotypes of animals born from [++/++] and [++/mm] were known without genotyping. For other matings, genotyping needs, computed by sex, depended on the relative number of animals selected of each genotype and originating from the same mating. For example, the number of genotyping related to the mating [++/m+] for females depended on the number of ++ and m+ females selected from this specific mating. In this case the number of genotype is computed as the maximum of ++ v. m+ females selected. The number of slaughtered lambs related to time t, NS t , included both animals slaughtered at t in the nucleus and t+1 in the commercial population. Non-selected males were slaughtered at time t, whereas non-selected nucleus females born from the mating types [++/++], [++/m+], [++/mm] and [m+/++] were transferred to the commercial population and produced offspring slaughtered at time t+1. For non-selected females born from [m+/m+] and [m+/mm], to avoid the transfer of mm females to the commercial population, we chose to either genotype all females and transfer only ++ or m+, or cull all females, depending on which option resulted in the best economic value. To distinguish the short- and long-term effects of mating management, three profit functions were computed for the short-term (t={2,6}), for the long-term (t={16,20}) and for the whole time horizon (t={2,20}). Details on how Geno t , NS t and the profit function were computed are provided in Supplementary Material S2.
Overlapping generations
To deal with the real case of the French Lacaune meat sheep breeding program run by the OVI-TEST breeding society, we extended the previous model to an overlapping generation deterministic model taking into account dam parity and the aging of males. The number of weaned lambs was expressed per lambing and the GE was derived from the effect of the FecL allele, that is, +0.5 lamb born per lambing, as estimated by Martin et al. (Reference Manfredi, Barbieri, Fournet and Elsen2014) in the OVI-TEST population. The full description of the overlapping model is provided in Supplementary Material S3.
Optimal and simple strategy comparison
Schemes were modeled to optimize the number of each mating (x), which were the decision variables. The values of state variables (number of animals and average EBV by category) at time t depended on decision variables at t and values of state variables at t−1. Output variables (incomes and costs) depended on decision variables and the values of state variables at t. Using the NAG routine E05UCF (The Numerical Algorithms Group (NAG), Oxford, United Kingdom) based on sequential quadratic programming methodology, we obtained the x that maximized the profit function subject to constraints:
 ${\mib{lb}} \leq \left(\!\!{\matrix{ {\mib{x}} \cr {{\mib{Ax}} } \cr } } \!\!\right)\geq {\mib{ub}} $
, where
lb
and
ub
were the lower and upper bounds and
 {\mib{A} the matrix that described linear constraints between variables. Details of linear constraints are given in Supplementary Material S4. With this approach, an optimal mating scheme (OPT) was obtained, fully defined by the optimum values of the vector x elements. Simple strategies were compared to OPT. In strategy S2, two matings were organized: [++/m+] and [m+/++] such that only matings between non-carriers (++) and heterozygotes were allowed. This strategy required systematic genotyping of candidates but did not produce mm individuals. In strategy S3+, three matings were organized: [++/++], [++/mm] and [m+/mm]. The strategy S3+ required homozygous carrier males (♂
mm
) and homozygous females (♀++) to produce heterozygous females (♀
m+) by [++/mm]. This type of mating produced heterozygous females that did not need to be genotyped but required at least one additional type of mating to replace the parents (♀++ and ♂
mm
). Homozygous carrier males (♂
mm
) were produced by a small proportion of [m+/mm], whereas non-carrier females (♀++) were produced by [++/++]. In strategy S3m, three matings were organized: [++/mm], [m+/++] and [m+/mm].This strategy, based on the mating between homozygous carrier males (♂
mm
) and non-carrier females (♀++) was similar to S3+ but non-carrier females (♀++) were produced by [m+/++].
Results
Using a discrete generation model, this study assesses the consequences of the proportion of mating types (combination of parental genotype) on a profit function computed at different time horizons. The optimal strategy (OPT) corresponded to the strategy that maximizes the profit function and was assessed for various combinations of GE and GC. The profit obtained for the optimal strategy was then compared with simpler strategies based on either only two (S2) or three mating types (S3+, S3m). An overlapping model was then used to illustrate such an approach with the real example of the French Lacaune meat sheep breeding program OVI-TEST.
Discrete generation model:
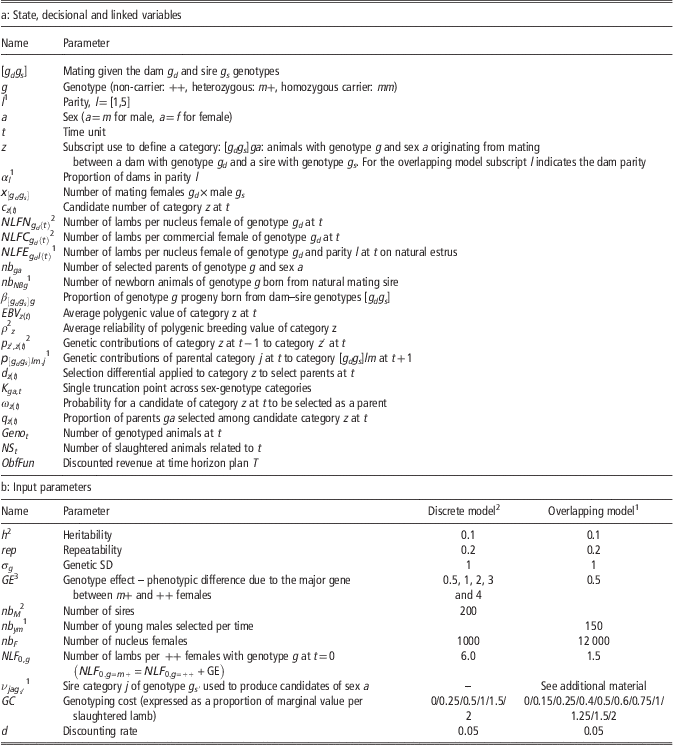
The mating combinations that yielded the maximum return depending on GE and GC in the short-term, the long-term and over the whole time horizon are reported in Figure 2a to c. In the short term, the optimal scenarios were diverse, and depended on GC. The [m+/++] mating, that is, the use of heterozygous females (♀ m+), was generally predominant in optimized designs. Heterozygous females (♀ m+) were replaced by genotyping the progeny of [m+/++] when the GC was low, but increasingly from [++/mm], which does not need genotyping, when the cost was higher. In this situation a small proportion of [m+/mm] was required to produce homozygous carrier rams (♂ mm ). This situation was very close to the S3m strategy. When the gene effect was very low and the GCs high, homozygous females (♀++) were used either with homozygous non-carrier rams ([++/++]), approaching 100% in the extreme scenario where GC=2 and GE=0.5, or with homozygous carrier rams ([++/mm]), which produced m+ ewes to be mostly used in commercial flocks. A proportion of [++/m+] was observed when both GE and GC were low, in combination with [m+/++], a scenario which optimized the use of genotyping as all females, ++ and m+, were candidates for replacement. This situation was very close to the S2 strategy. The latter scenario was predominant for the long-term time horizon. It was only when GE was very low and GC high that [++/++] dominated, as in the short term. The relative proportion of [++/m+] increased with GC and decreased with GE. Optimization over the whole time horizon gave scenarios clearly intermediate between short- and long-term optimizations.
Mating combinations that gave the maximal return as a function of genotype effect and genotyping cost – discrete generations in (a) short-term, (b) long-term, and (c) whole time horizon term. Matings: [dam genotype×sire genotype]. GE=genotype effect – phenotypic difference due to the major gene between m+ and ++ females. GC=genotyping cost (expressed as a proportion of marginal value per slaughtered lamb). 1 t={2,6}; 2 t={16,20}; 3 t={2,20}.

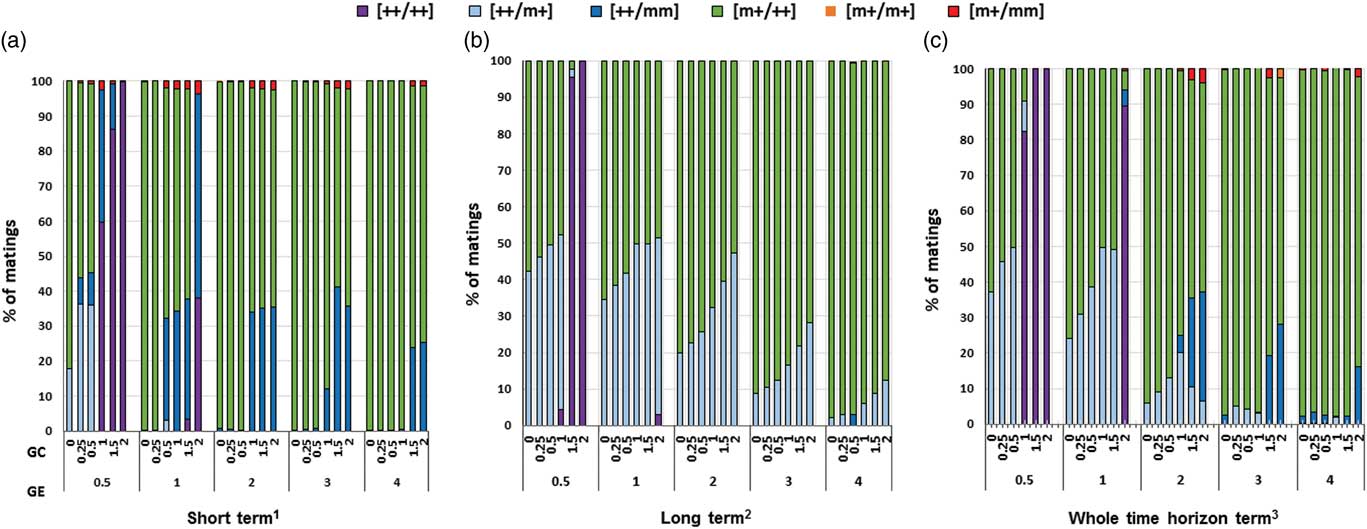
The percentages of losses over the whole time horizon of S2, S3+ and S3m strategies compared with the OPT strategy, for a range of GE and GC, are reported in Figure 3. Except at low GE and high GC (e.g. GE=0.5 and GC=1.5), the losses for the S3+ strategy were higher than losses for S2 and S3m strategies. The percentage of losses of S3+ increased with GE and decreased with GC. At a low GE (⩽1), S2 outperformed S3m, whatever the GC. For a low GE and high GC (GE=0.5 and GC=2), the loss for S2 was ~10%. Otherwise, for higher GE, the S2 and S3m strategies gave similar results and were close or equal to the OPT strategy. Only at high GE and GC, S3m slightly outperformed S2.
Losses of economic returns for various strategies compared with the optimal strategy as a function of the genotype effect and genotyping cost – discrete generations. Matings: [dam genotype×sire genotype]. S2=strategy based on [++/m+] and [m+/++]; S3m=strategy based on [++/mm], [m+/++] and [m+/mm]; and S3+=strategy based on [++/++], [++/mm] and [m+/mm]. GE=genotype effect – phenotypic difference due to the major gene between m+ and ++ females. GC=genotyping cost (expressed as a proportion of marginal value per slaughtered lamb). Time horizon, t={2,20}.

Overlapping generation model
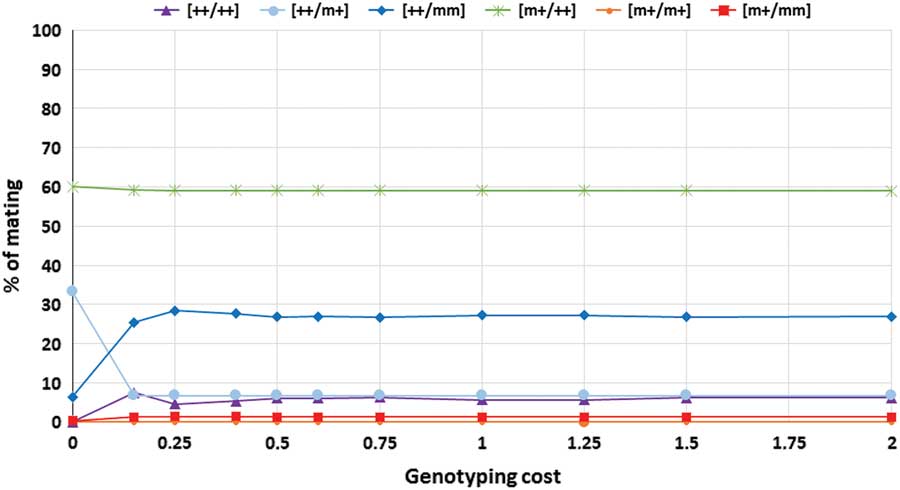
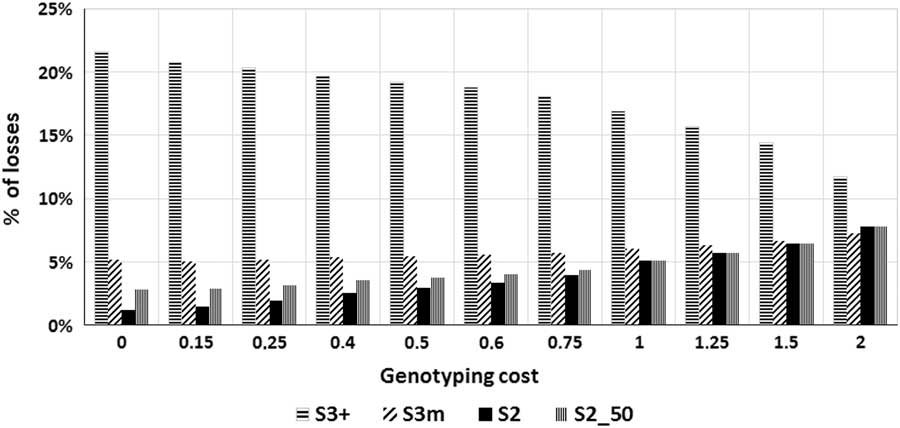
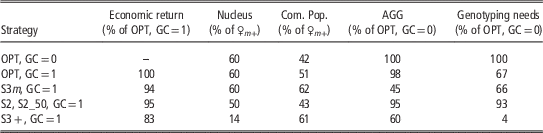
The optimal combination of matings as a function of GC is reported in Figure 4. Two optimal combinations can be described. First, when GC was null, OPT was based on [m+/++] (60%), [++/m+] (33%) and [++/mm] (6%) (plus [m+/mm] to produce ♂ mm ). Second, for the range of GC assessed, OPT was nearly stable and based on the same matings plus [++/++]: [m+/++] remained high at 59%, whereas [++/mm] increased (to ~27%), [++/m+] decreased (~7%) and [++/++] reached 6% ([m+/mm] remained low at 1%). The OPT strategy consisted of a combination of five types of mating. The results of the comparison of OPT with simple strategies are reported in Figure 5. An additional strategy, S2_50, identical to S2 but with a balanced proportion of [++/m+] and [m+/++] was tested. Figure 5 shows that S3+ displayed the highest losses (from 12% to 22%) irrespective of GC. The losses with the S3m strategy were higher than for the S2 and S2_50 strategies at low GC values but the gap was reduced at higher GC. At the highest GC, the losses of S3m were slightly lower than for S2 and S2_50. For all cases, for S3m, S2 and S2_50, the losses were limited and ranged from 1% to 8%. The [++/m+]/[m+/++] ratio obtained for the S2 strategy was of 40/60 up to GC=0.75, and about 50/50 above (results not shown). The percentage of heterozygous females (♀ m+) mated in the nucleus and transferred to the commercial population, as well as annual genetic gain (AGG) and genotyping needs obtained for the current estimated GC (GC=1) are reported in Table 2 for each strategy. The AGG and genotyping needs were expressed as relative values compared with the idealistic situation (OPT, GC=0). Optimal mating scheme gave both the highest AGG (98% to 100%) and the highest ♀ m+ frequency in the nucleus (around 60%) for a moderate level of genotyping (66% to 69%). The S2 and S2_50 strategies gave a similar AGG (91% to 95%) but were associated with higher genotyping needs (93% to 112%), whereas S3m gave the highest ♀ m+ frequency in the commercial population (62%) but a lower AGG (45%). S3+ was associated very low genotyping needs (4%) but gave both a lower AGG (60%) and ♀ m+ frequency (14%) at the nucleus level.
Optimal combination of matings as a function of genotyping cost – overlapping generations. Matings: [dam genotype×sire genotype]. GE=genotype effect – phenotypic difference due to the major gene between m+ and ++ females; GC=genotyping cost (expressed as a proportion of marginal value per slaughtered lamb).

Percentage of losses of simpler strategies compared with the optimal strategy as a function of genotyping cost – overlapping generations. Matings: [dam genotype×sire genotype]. S2=strategy based on [++/m+] and [m+/++]; S3m=strategy based on [++/mm], [m+/++] and [m+/mm]; and S3+=strategy based on [++/++], [++/mm] and [m+/mm]. GE=genotype effect – phenotypic difference due to the major gene between m+ and ++ females. GC=genotyping cost (expressed as a proportion of marginal value per slaughtered lamb).

Heterozygous frequency of dams in nucleus and commercial populations, annual genetic gain and genotyping needs given the strategy – overlapping generations

OPT=optimal combination that gave the maximal economic value; GC=genotyping cost (expressed as a proportion of marginal value per slaughtered lamb), GC=1 corresponds to the current estimated genotyping cost and GC=0 corresponds to the idealistic situation (no genotyping costs); S2=strategy based on [++/m+] and [m+/++]; S2_50=strategy based on a balanced proportion of [++/m+] and [m+/++]; S3m=strategy based on [++/mm]; [m+/++] and [m+/mm]; S3+=strategy based on [++/++], [++/mm] and [m+/mm]; Com. Pop.=commercial population; AGG=annual genetic gain.
Mating: [dam genotype×sire genotype].
Discussion
In this study we modeled a discrete generation breeding program to determine the optimal combination of matings when a major mutation affects a selected trait and heterozygous carriers are desirable, whereas homozygous carriers are not. In a second step, an overlapping generation model was adapted to the OVI-TEST Lacaune meat sheep breeding program as a real case study. Using sequential quadratic programming methodology, we determined the optimal combination of matings (OPT) that maximized the economic value achieved by the population in the short-term, in the long-term and over the whole time horizon for a range of GEs and GCs. Optimal mating scheme strategy was then compared with simpler strategies based on a limited number of matings; two matings for S2 or three matings for S3+ and S3m.
Parameter values and optimal designs
The optimal combination of matings varied according to the time horizon, GE and GC values assessed. Given the values of parameters, it was more profitable to either increase the AGG, increase the heterozygous frequency of females in both the nucleus and the commercial population, or decrease genotyping needs. Values of each variable were reported for the overlapping model (Table 2) but not for the discrete model as results were consistent between models. At high GE and low GC values, OPT put more emphasis on maximizing the heterozygous frequency. At very low GE and high GC values, the AGG was the unique goal and the mutation eradicated. In between, depending on the combination of the GE and GC parameters and the time horizon considered, OPT varied. The strategy either led to increased emphasis on maximizing the heterozygous frequency in both the nucleus and commercial population or on maximizing the AGG. As expected, strategies that put more emphasis on heterozygous frequencies were superior in the short term, whereas strategies that put more emphasis on AGG were superior in the long term. Over the whole time horizon, for a low GE, OPT was mainly based on [++/m+] and [m+/++], a combination that favored the AGG as all progeny were considered as candidates for replacement. As the GC increased, the proportion of each type of mating became more balanced. A higher AGG was obtained for a balanced proportion of [++/m+] and [m+/++] (50% of each type of mating) than those obtained for unbalanced proportions (results from simulations not shown). A balanced proportion decreased the frequency of heterozygous carriers in the nucleus but maintained the frequency in the commercial population, resulting in a higher AGG and decreased genotyping needs. For high GE values, OPT was mainly based on [m+/++] and led to a high frequency of heterozygous carriers at the nucleus level. In this case, as non-carrier females and heterozygous males were not candidates for replacement, lower selection intensities resulted in a lower AGG. For higher GC values, [m+/++] was associated with [++/mm] (and [m+/mm]): the frequency of heterozygous females decreased at the nucleus level but increased at the commercial population level, whereas genotyping needs decreased. [m+/mm] was always superior to [m+/m+] for the production of homozygous carrier males (♂ mm ).
With the overlapping model, the OPT strategy obtained across a range of GC values was based on five different types of mating. Except when GC was null, the proportion of each mating remained stable irrespective of GC. The OPT strategy observed for the overlapping model (time unit=year) was close to the short-term OPT strategy with the discrete model (time unit=generation): at low GC values, OPT was mainly based on [++/m+] and [m+/++] and then at higher GC values, on [++/mm] and [m+/++]. At high GC values, [m+/++] was replaced by both [++/++] and [++/mm] for the discrete model, whereas the combination of matings remained stable for the overlapping model across the range of GC values assessed. Differences in the breeding scheme modeling might explain this result. In the overlapping model, after estrus induction non-pregnant ewes were mated by natural mating with non-carrier males in multiple-sire matings. Due to the use of non-carrier males, the optimal balance between AGG and heterozygous frequency would be different in the overlapping and discrete models, with a higher emphasis on AGG in the overlapping model. To test this hypothesis, we assessed the OPT strategy for a higher GE, using the overlapping model and assuming that a higher GE would rebalance the relative importance of AGG and heterozygous frequency. The optimal combination we obtained (result not shown) was based on the same types of mating as those obtained for the discrete model for a lower GE. Another difference is due to the intrinsic proprieties of discrete and overlapping generation models: the discrete model quickly reached a steady state compared with the overlapping model in which genetic values fluctuated more in the early stages of the breeding program. Consequently, we also studied OPT for the overlapping model and simpler strategies when the first 15 reproduction cycles were removed; the results (not shown) obtained were consistent with those presented in this paper.
Optimal design and simpler strategy comparison
Optimal mating scheme was compared with simpler mating strategies. The results obtained for both discrete and overlapping models were consistent and were of the same magnitude: compared with OPT, the economic losses were limited for S2 and S3m and higher for S3+. The S2 strategy favored a high AGG, whereas S3m favored a high heterozygous frequency. Both strategies gave similar results in terms of economic value and the differences with OPT were limited. More significant was the increased loss of efficiency for the S3+ strategy as GE increased (GE⩾1). In S3+, a proportion of the nucleus females was used to produce heterozygous females ([++/mm]) and only parents involved in [++/++] matings contributed to the genetic progress of non-carrier females. This strategy led to a reduction in the effective size of the nucleus as a proportion of the female nucleus population exclusively produced newborn females for transfer. An improvement might be obtained by assigning the non-carrier females to [++/++] and [++/mm] according to their EBV as most of the female progeny born from [++/mm] were transferred to the commercial population.
At the estimated current GC (approximately GC=1), the S2_50 strategy was the best simple strategy for the French Lacaune meat sheep population OVI-TEST. The breeding program is currently close to S2_50 (Martin et al., Reference Manfredi, Barbieri, Fournet and Elsen2014) and it would be straightforward to implement this strategy based on only two different types of mating. Although the GC considered did not take into account cost of breeder labor, the results were identical for higher GC values. For lower GC values, the best simple strategy was S2, based on the same mating types than S2_50 strategy but with a higher frequency of heterozygous females (60% v. 50%). Single-nucleotide polymorphism panels containing both parentage and major gene mutations may become available at lower cost in the coming years. The S3m strategy, as well as S3+ and OPT strategies, require matings [m+/mm] to produce homozygous carriers. Even if the proportion of [m+/mm] is low, they could be an issue for flocks of limited size (e.g. [m+/mm]=5 for a flock of 500 ewes). These strategies would be based on specialized flocks producing homozygous carrier males (♂ mm ) and would therefore be more sensitive to animal health problems or nucleus breeder turn-over.
Transition phase and multi-trait breeding goal
The initial allele frequency may be quite different to the optimal or desired frequency. In this case, the transition phase from the initial to the stationary state should be described and optimized using a dynamic model as developed in other studies (Larzul et al., Reference Hill1997; Dekkers and Van Arendonk, Reference Dekkers and van Arendonk1998; Manfredi et al., Reference Larzul, Manfredi and Elsen1998). Contrary to the OVI-TEST breeding program, where parents were born from artificial insemination, managing natural matings would be more complicated and should be taken into account when comparing strategies. In our study, the major gene has an effect on the number of weaned lambs, which was also the selected trait. The genetic and phenotypic evolution of the trait under selection tended to increase the AGG over time: the number of progeny (candidates) increased, whereas the number of selected parents was constant. This phenomenon was not considered in our modeling, assuming limited consequences in the course of the selection scheme. If we included another selected trait, the emphasis on both the heterozygous frequency and the AGG would depend on the relative economic value of the number of weaned lambs and other traits as well as the objective function modeling (number of expressions and relationships among traits): strategies that allow for a higher genetic gain might be promoted. Selection indexes that combine all traits would probably be useful in this situation, and the weight of each trait in the selection index and the mating combination must be included as variables to be optimized. A strategy based on the eradication of the m allele with polygenic selection of prolificacy only outperformed others when the GE is low (GE=0.5) and GC high (GC⩾1.5). Such a strategy could be competitive over a very long time horizon as the wild genotype could reach the desired level of number of weaned lambs by polygenic selection. However, in the case of a substantial GE, the period to reach the desired level might be very long with profitability issues in the short term. In addition, we did not address the potential consequences of the different strategies on inbreeding. Strategies that limit the number of candidates among the progeny produced, such as S3+ or [m+/++] only strategies, could have deleterious effects.
Conclusion
In this study, a procedure based on a deterministic genetic model and an optimization algorithm was proposed to determine the optimal mating strategies, in terms of economic returns, to manage heterozygous carriers of a major gene in purebred meat sheep breeding programs. Our results show that the optimal strategy, that is, the optimal combination of matings, varied and put more emphasis either on the AGG, the frequencies of heterozygous females or the genotyping needs depending on the GE, GC and the horizon term considered. In the short term, strategies that favored heterozygous female frequency tend to give higher profit except when the GE was quite low. In the long term, strategies that favored the AGG performed better. Over the whole time horizon, the optimal strategy favored heterozygous frequency when the GE was high and favored the AGG when the GE was lower. Using our model, we computed the economic return of simpler mating strategies. Comparisons showed that some simpler strategies gave economic returns close to the optimal strategy but were considerably different in terms of AGG.
Acknowledgments
This study was funded by Institut de l’Elevage, INRA and Apis-gène. The authors gratefully acknowledge the funding.
Supplementary material
To view supplementary material for this article, please visit https://doi.org/10.1017/S1751731117001835