1. INTRODUCTION
The FCC E-911 mandate (FCC 2000) is a significant driver in the development of high sensitivity GPS-enabled mobile telephones for mixed outdoor/indoor applications. GPS receivers designed for mobile phones require evaluations by manufacturers for compliance with the performance requirements of the E-911 mandate in various environments. Compliance with minimum operational performance standards (MOPS) could become compulsory in future. Traditional GPS receiver performance evaluation is conducted through field tests, which are costly, time consuming and introduce uncertainties due to uncontrolled test environments. The complexity of the GPS channel under various indoor environments and in urban canyons makes such in situ tests unreliable at best. It becomes impossible to compare performance between different firmware versions of the same model, let alone between different models and brands. An alternative is laboratory testing using a hardware simulator. In simulation mode, GPS signals are replicated under strictly controlled and repeatable conditions and evaluation of receiver performance can be quantified. Simulations can be repeated countless times for objective comparisons between receivers.
GPS hardware simulators capable of reproducing the radio frequency (RF) signals of GPS satellites are now available. However, the models used in such simulators may not adequately describe the effect of multipath nor power attenuation on GPS satellite signals as received in complex signal degraded environments such as indoors over relatively long periods of time, e.g. up to hours. The large number of procedures required to output signal strength, the number of channels, and multipath characteristics to produce a specific “environment” compounds the problem. For example, Boulton (Reference Boulton, Read, MacGougan, Klukas, Cannon and Lachapelle2002a) and Lachapelle et al (Reference Lachapelle, Cannon, Klukas, Singh, Watson, Boulton, Read and Jones2003a) used Spirent simulators to reproduce GPS signals in indoor environments. They reported that the simulator and procedures as tested did not produce GPS signals that adequately represented actual GPS signals received in indoor environments. Multipath and power attenuation can cause difficulty for signal acquisition and tracking, and introduces large errors in positioning. As such, representative replication of their effects is critical in the simulation process.
The novel option investigated herein to improve GPS signal simulation for indoor environments is to vary the parameters of the existing models in the hardware simulator. The impact of power attenuation and multipath on GPS signals received indoors is first characterized and these characteristics are used to set and adjust the parameters of the simulator.
First, a theoretical analysis of the effects of multipath on code errors and carrier to noise density (C/N0) errors in a GPS receiver is presented. This is followed by an analysis of code errors and C/N0 errors observed in a high sensitivity GPS (HSGPS) receiver processing simulated GPS signals. The simulated GPS signals were specifically designed for controlled multipath scenarios. The results of both the theoretical and simulation analyses are used to set the parameters of the simulator to replicate GPS signals in indoor environments that are stochastically similar to actual signals collected in those environments. Results for two indoor environments, namely a residential garage and a covered ice skating arena are presented. If simulated GPS signals can be made representative of actual field data in various signal degraded environments, laboratory testing of GPS-enabled devices will provide representative results in a more cost-effective and time efficient manner than field testing.
2. INDOOR GPS AND MULTIPATH ERRORS
The typically received GPS L1 C/A code signal power is specified to be at least −160 dBW for elevation angles between 5° and 90° (ICD 2000). However, signals received indoors are especially degraded by reflection and penetration loss and do not meet this minimum. The degree to which signals are degraded varies with building material (Klukas et al Reference Klukas, Julien, Dong, Cannon and Lachapelle2004) and the geometry of the environment. Signals arriving through propagation paths other than the direct path are called multipath. Unlike direct signals, a multipath signal always arrives after the direct signal and usually with less power. The longer time required to reach the receiver antenna relative to the direct signal causes a pseudorange error, which in turn leads to errors in the position estimate.
When multipath propagation occurs, the incoming signal may contain both line of sight (LOS) and one or more reflected signals. The resulting C/N0, code and carrier-phase measurements refer to the combined signal made up of the various received signals. Multipath not only degrades the accuracy of code and carrier-phase measurements, but also varies the strength of the composite signal. The in-phase and out-of-phase multipath signals produce constructive and destructive interference, called multipath fading. In the worst situations, the reduced overall signal strength can cause loss of lock in the tracking loops. The effect of multipath on the code and the C/N0 is a function of the delay, phase and amplitude ratio of multipath to the direct signal (MDR). The multipath phase is determined by the delay and the phase change due to reflection. In practice, the phase change due to reflection is very difficult to predict. Thus, here we only consider multipath phase due to delay. Although most multipath scenarios involve multiple reflected signals, much insight can be achieved from the analysis of a single multipath case (e.g. Braasch Reference Braasch, Parkinson and Spilker1996).
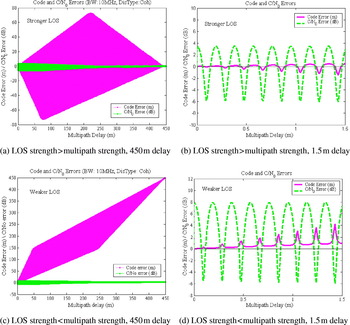
Ray (Reference Ray2000) presented a theoretical calculation of the code and C/N0 errors due to multipath. According to his method, the theoretical code and C/N0 errors due to a single, weaker than direct, multipath signal are shown in parts a and b of Figure 1. The magenta curve is the code error while the green curve is the C/N0 error. The early-late correlator spacing is one chip-width, the bandwidth is 10 MHz and the discriminator is a coherent Delay Lock Loop (DLL). A more detailed view of the code error and C/N0 error with multipath delay up to 1·5 m is shown in part b of the figure. The code error and C/N0 error are both undulating with a sinusoid-like trend about zero. They have an in-phase relation and undulate within the same cycle. The amplitude of code error increases as the multipath delay increases, while the amplitude of the C/N0 errors remains relatively constant. Although the code error undulates about zero, it does not have a mean value of zero (van Nee Reference van Nee1993, Braasch Reference Braasch, Parkinson and Spilker1996).
Code and C/N0 errors for strong and weak direct signals with multipath delay range up to 450 m (a, c) and 1·5 m (b, d).

In general, LOS signals are stronger than multipath signals due to reflection or diffraction loss. However, this is not always true. If the LOS signal of one satellite is seriously degraded, it is possible that the sum of the multipath signals is stronger than the LOS signals. Figure 1c shows the code and C/N0 errors due to a single, stronger than direct, multipath signal. More detailed errors for a small range of multipath delays are shown in Figure 1d. In contrast to the case of a weak multipath signal, the code error due to a strong multipath signal only has positive values. The code error increases significantly as the multipath delay increases. On the other hand, the C/N0 error has a similar pattern to the C/N0 error due to a weak multipath signal as shown in Figure 1a. The C/N0 error undulates about zero within the envelope and the amplitude of the error decreases as the multipath delay increases. In the present case, the code and C/N0 errors are 180° out-of-phase. Regardless of whether the multipath signal is stronger or weaker than the direct signal, all the errors undulate with the same L1 wavelength of 19 cm and the amplitudes gradually change. Therefore, samples from a single cycle can be used to calculate the error statistics.
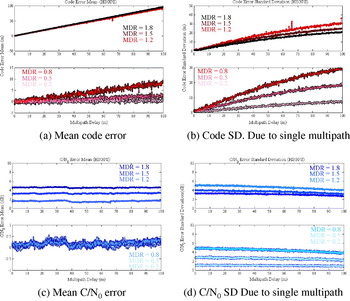
The various processing techniques employed by different receivers also affect multipath errors. Therefore, to reasonably characterize multipath as observed in measurements made by a particular type of receiver, the performance of that receiver in the presence of controlled multipath must be analyzed. To this end, the hardware simulator was used to simulate signals consisting of one direct signal and one multipath signal. A SiRF HSGPS receiver was used to receive the simulated signals and make the measurements to calculate the errors. In order to study multipath effects as a function of multipath signal power, six tests were conducted. The multipath MDRs were chosen as 0·2, 0·5, 0·8, 1·2, 1·5 and 1·8. The multipath delay was increased up to 100 m in steps of 0·01 m. As a result, each whole cycle is a continuous 19 samples of data. Every continuous cycle of data is used to compute the multipath error statistics. Figure 2 shows the statistics of multipath code and C/N0 errors as a function of simulated MDR. Significant differences exist between the statistics for MDR<1 and those for MDR>1.
Code and mean errors and standard deviation due to a single multipath for a HSGPS receiver.

The following observations regarding the code and C/N0 errors with respect to the multipath delay (0 to 100 m) and MDR (0 to 2) can be made from Figure 2:
a) Both the mean and standard deviation of the code error increase with the lengthening of the multipath delay
b) If the multipath signal is stronger than the direct signal, the code error mean increases significantly and approximately equals the multipath delay
c) The C/N0 error mean is close to zero when the direct signal is stronger
d) The code and C/N0 error standard deviations increase when the multipath strength approaches the direct signal strength
e) Increasing the multipath delay causes small changes (<6 dB) in C/N0 error mean and standard deviation
f) For the case when the multipath signal is stronger than the LOS signal, the C/N0 error mean increases as the multipath strength increases, given that the multipath delay is constant.
By observing code and C/N0 errors in field data, the statistical characteristics of multipath errors discussed above can be used to estimate the simulation multipath parameters. However, code and C/N0 errors are not directly measurable. Instead, fading and estimated pseudorange errors (EPE), which are measurable, are used as measures of C/N0 and code errors due to multipath.
3. FADING AND ESTIMATED PSEUDORANGE ERRORS (EPE)
The term ‘fading’ is a measure of the signal strength degradation. It includes the attenuation of the LOS signal due to propagation through a material and multipath interference (Lachapelle et al., Reference Lachapelle, Kuusniemi, Dao, MacGougan and Cannon2003b). Fading at a particular location can be measured by differencing the C/N0 from a rover receiver at that location with that from a reference receiver with an unobstructed view of the sky (e.g. MacGougan, Reference MacGougan2003):

where, F is the fading, and C/N 0reference and C/N 0rover are measurements made at the reference and rover stations, respectively. In general, signal fading is expected to be positive because the signal strength observed under open sky conditions should be no less than that for signals in degraded environments. However, this is not always true. For signals arriving at the reference station, multipath interference is possible, especially for low elevation satellites. If a satellite signal experiences destructive multipath interference at the reference receiver, but constructive multipath interference and little shadowing at the rover receiver, the C/N0 at the rover receiver may be larger than that observed at the reference receiver. As a result, negative fading would be observed.
A pseudorange measurement primarily contains the geometric satellite-to-user range and the clock offset. However, it is also affected by many other factors such as multipath, spatial propagation delay, noise, etc. The clock offset of a receiver is equal for all satellites at a given epoch. If the true position is known, the clock offset can be estimated. After the clock offset is eliminated, the pseudorange residual provides a measurement of unmodelled errors – mainly multipath, spatial propagation delay and noise. A single differenced correction from a nearby reference receiver can remove most spatially correlated atmospheric and other errors and thereby reduce their impact on the pseudorange residual. For indoor environments, the error induced by noise can however be significant in extreme circumstances and reach 25 m for a fading value of 25 dB (e.g. Lachapelle et al Reference Lachapelle, Cannon, Klukas, Singh, Watson, Boulton, Read and Jones2003a). In the sequel, this error source is assumed Gaussian for the purpose of obtaining qualitative results. After the true position constraint and the single differenced corrections are applied, the major non-Gaussian error remaining in the pseudorange residual is multipath. This residual is known as the estimated pseudorange error (EPE) and acts as an estimate of the code multipath error: E≈−τe where E is the EPE and τe is the code error due to multipath. The clock offset estimate is not entirely precise because it absorbs some unmodelled errors, such as multipath. Due to the fact that the error in the clock offset will be distributed to all pseudorange residuals, EPE is not entirely absolute but nevertheless sufficiently accurate for the present qualitative analysis.
Pseudorange error estimation was accomplished herein with the use of C3NavG2™, an epoch-by-epoch least-squares software package developed by the PLAN Group at the University of Calgary (Petovello et al., Reference Petovello, Cannon and Lachapelle2000). Epoch-by-epoch estimation is needed to avoid code multipath error smoothing effects.
Due to the complexity of the environments encountered in practical conditions, it is meaningless and impossible to completely replicate all signals in the time domain for a specific environment. Rather, an attempt is made to produce simulated measurements that have stochastic characteristics similar to those of field measurements. Probability density functions (PDF) are herein used to describe the statistical characteristics of the test measurements. Correlation coefficients (CC) are the normalized measures employed herein to indicate how well trends in two variables match. They are used to compare and identify statistical matching between field and simulation results. The probability density functions (PDF) of the following quantities are used: fading, EPE and its associated first and second order derivatives, satellite availability, horizontal position, and horizontal dilution of precision (HDOP).
4. SIMULATION METHODOLOGY
An HSGPS receiver collected field measurements in selected environments with known coordinates of the test points. A second HSGPS receiver of the same type simultaneously operated nearby under open sky conditions served as the reference station. Signal fading and multipath delays were estimated by analyzing the characteristics of fading and EPE. These estimated signal levels and multipath delays were then used to simulate GPS signals having statistically similar characteristics to those of the field data. Next, a trial and error method, beginning with parameters based on field data characteristics, was used to adjust the simulator parameters to better match the simulated data to the field data.
HS SiRF receivers were used to collect the indoor data used herein. Each test began with a warm-up period of twenty minutes operating under full signal strength LOS conditions to obtain all information needed to utilize the high sensitivity technique. The receivers were then moved into the selected indoor areas, namely a residential garage and indoor speed skating arena. Other environments were also tested and the results are reported in (Hu Reference Hu2006).
A Spirent GSS6560 simulator was used to produce the simulated GPS signals. It consists of a hardware RF signal generator and software named SimGEN. With SimGEN, the simulator can reproduce GPS signals for specific times and locations. The simulator has 24 channels and each channel can be individually assigned to reproduce one signal (LOS or multipath) at a controlled power level, Doppler, timing and message content corresponding to a satellite in-view. An antenna gain pattern may be used in SimGEN to adjust the signal power attenuation according to a particular antenna type (Boulton Reference Boulton2002b).
In default static conditions, simulated signals are LOS as received under open sky. In order to simulate indoor GPS signals, a land mobile multipath (LMM) model and/or user action function file are employed by the simulator to create multipath signals and adjust the LOS signal strength. The LMM model employs a signal category mask to define the signal type (LOS or multipath) and a variable delay multipath model to produce the multipath signal delay. The variable delay multipath model is related to the geometry of satellites and receiver antenna (Lachapelle et al Reference Lachapelle, Cannon, Klukas, Singh, Watson, Boulton, Read and Jones2003a). The initial value of the delay is randomly selected with the constraint that the initial delay should be smaller than the maximum value of the distance between the antenna and the reflector. The atmospheric and orbital errors were turned to zero. The same HSGPS receivers used for the field tests were interfaced to the simulator to eliminate possible differences between receivers.
5. RESIDENTIAL GARAGE RESULTS
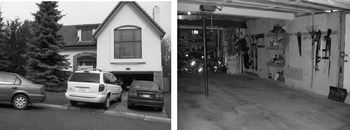
The first testing environment is a typical, attached, North American, residential car garage. The house and garage are shown in Figure 3. The garage has a wooden door, gypsum wallboards, a wall partially made of concrete, and is situated under the living room of the house which has a concrete-tiled roof. The dimensions of the garage are 9 m×5·6 m×2·5 m. The GPS coordinates of the test point inside the garage were surveyed independently with accuracy better than 1 m in WGS84. The wooden garage door was closed during the field test, which lasted four hours.
Exterior and interior of residential garage.

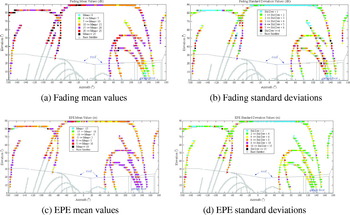
Figure 4 presents the results of the satellite pierce-point analysis. This analysis provides insight into the spatial characteristics of the test environment. It shows the signal's statistical fading profile having a strong correlation with the test environment. Signal fading and EPEs were grouped into bins of 3° azimuth by 3° elevation, with statistical data derived for every group. The grey background track lines indicate the positions of the satellites in-view during the test whereas the thin lines outline the inside of the garage. The mean values of each 3°×3° bin are colour coded. Almost all signals passing through the walls and roof and captured by the receiver were attenuated. Some signals coming through the wooden garage door were attenuated to a lesser extent than signals presumably passing through the walls and roof. Some of these signals were likely reflected signals still coming through the path of least resistance, namely the door in this case. All negative values of mean fading occurred for the garage door. Assuming that multipath signals were weaker than LOS signals, the mean C/N0 error due to multipath should be close to zero as stated in section 2 as observation (c). Then, the fading means could be taken as representing the magnitude of signal attenuation. An inspection of the fading standard deviations suggests that signals with fading values characterized by large standard deviations are possibly affected by stronger multipath signals than those with smaller standard deviations, as stated in section 2 as observation (d).
Fading and EPE mean and standard deviation values in garage test – 3°×3° bins.

Most of the EPE means are between −5 m and +5 m, while their standard deviations are generally below 6 m. Although fading from signals presumably coming through the door was significantly lower from that of other signals, the EPE means do not follow this pattern. This is because EPEs are a function of the multipath to LOS amplitude ratio, as opposed to signal power level. Assuming all multipath signals originate from indoor reflections, the multipath code errors would generally have the same magnitude, which would be largely dictated by the geometry and reflective surfaces of the garage.
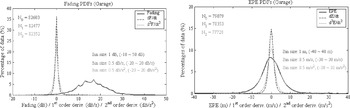
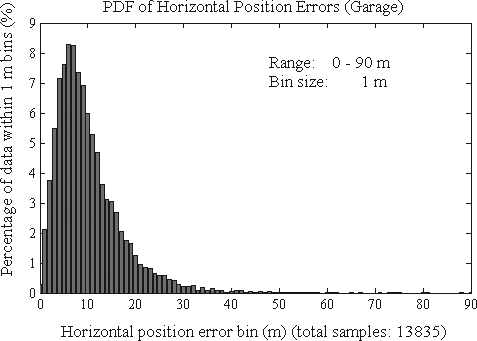
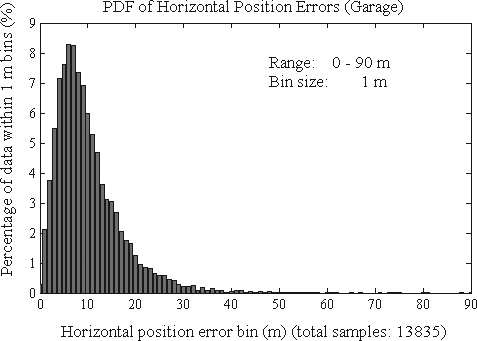
The overall fading and EPE distributions are shown in Figure 5. The N0, N1 and N2 are the numbers of samples for fading, and its first and second order derivative, respectively. The data range and bin sizes used to calculate the PDFs are shown as well. Over 60% of the fading was located in a range of 10 dB to 20 dB. The first and second order derivatives were centred and symmetrical about zero, implying that fading increases and decreases were almost equivalent. The sharp peaks indicate that variations in fading were in a narrow range of −5 dB to +5 dB. The EPE values and their derivatives also have zero means and symmetrical distributions. More than 90% of the EPEs are between −10 m and +10 m. Over 95% of the first order derivatives fluctuate within a range of±5 m/s. The PDF of the horizontal position errors is shown in Figure 6. More than 90% of the position errors are below 20 m. This error is a function not only of the EPEs but also of the Horizontal Dilution of Precision (HDOP). The HDOP during the experiment fluctuated around 1, which is excellent. This is a reflection of the geometry of the actual satellites observed during the experiment.
PDFs of fading and EPEs and associated 1st & 2nd order derivatives for garage test.

PDF of horizontal position errors for garage test.
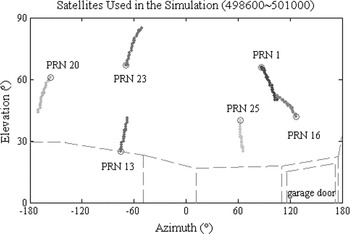
A 40-minute period was chosen for the simulation. The six satellites chosen are shown in Figure 7, with circles indicating the starting points of their trajectories. During the simulation, the attenuation of each satellite signal was held constant. All LOS signals were attenuated by 15 dB. The multipath mean power levels were set to approximately -10 dB with respect to the LOS strength. The maximum possible distance between the antenna and the reflector was set to 15 metres. These simulation parameters constitute the best parameter set in terms of agreement between simulated and field measurements, as determined through trial and error.
Satellites chosen for simulation – Garage test.

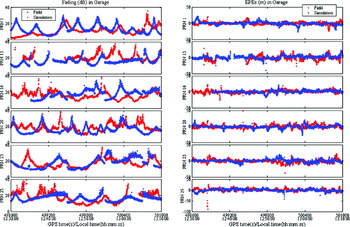
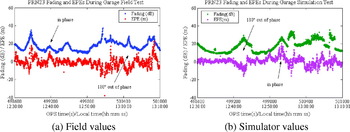
The fading and EPE field and simulation values are shown in Figure 8. The average field fading is of the order of 15 to 20 dB but includes large fluctuations. The amplitude of the simulated fading fluctuations is determined by the relative strength of the multipath signal with respect to the LOS signal, whereas the frequency of the fluctuation is determined by the multipath delay change rate. The simulated fading exhibits similar stochastic characteristics to the fading measured in the field. The same can be said for the measured and simulated EPEs. Figure 9 provides a more detailed look at the fading and EPEs of PRN 23. The measured and simulated fading and EPEs display some correlation. In-phase and 180° out-of-phase relationships between fading and the EPEs could be found in both the field test and simulation. The fading fluctuated more smoothly than the EPEs, resulting in the EPEs having a greater proportion of high frequency components compared to the fading values.
Field and simulator fading and EPE measurements – Garage test.

Field and simulated fading and EPE measurement analysis for PRN 23.

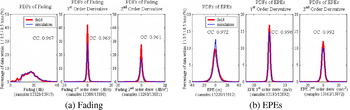
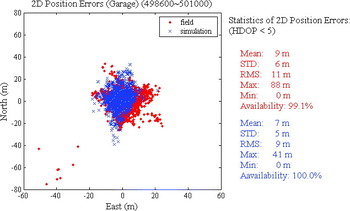
Figure 10 shows the PDFs of fading and EPEs and their first and second order derivatives for both the field and simulated measurements. Both field and simulated results display a high level of correlation, although the PDF of the field EPEs exhibits a wider spread than that of the simulated EPEs. This may be the result of the limited number of simulated multipath signals. In the simulation, satellite signals contained only three multipath components. In reality however, the number of reflected and hence multipath signals may be much greater. Only three simulator channels per satellite assigned to multipath may not be sufficient to accurately represent the actual conditions. Hu (Reference Hu2006) reports that an increase in the number of multipath signals results in a wider spread of the PDFs. The actual and simulated measurement horizontal position errors are shown in Figure 11. The position RMS errors agree within 2 m (11 m for actual versus 9 m for simulated measurements). An analysis of the HDOPs showed that a number of actual HDOP values are significantly higher that the corresponding simulated values due to signal dropouts. These higher HDOPS contribute to the higher position RMS error.
PDFs of fading and EPE measurements and associated 1st and 2nd order derivatives for the garage test.

Field and simulator horizontal position errors – Garage test.

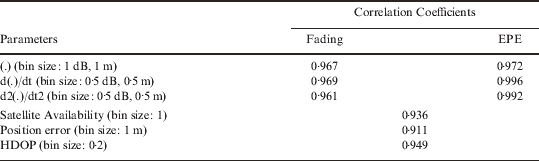
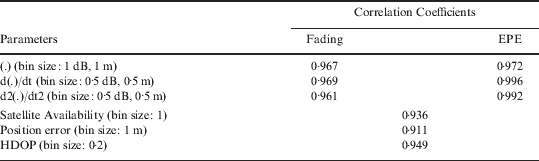
Table 1 gives the overall correlation coefficients for the field and simulation data. All correlation coefficients are above 0·9, indicating a relatively strong match between the field and simulated data and proving that such an environment can indeed be reproduced in a hardware simulator.
Garage field and simulation correlation coefficients.
6. COVERED ICE SKATING ARENA RESULTS
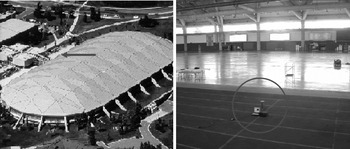
The Olympic Oval, a covered ice skating arena on the University of Calgary campus, was selected as a second test site, in view of its vastly different characteristics from the first site. The structure, shown in Figure 12, has dimensions of approximately 200 m×80 m×20 m. The arched roof is composed of three layers, namely metal cladding, insulation, and a waterproof membrane, all of which are covered by porcelain panels. The GPS antenna was located at ground level of the running track, as shown in Figure 12. Ten hours of data were collected.
Exterior and interior of Olympic Oval.

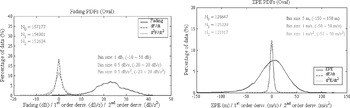
The PDFs of the fading, shown in Figure 13, are approximately symmetrical with a centre at 23 dB, which is higher than that observed in the garage. Some 62% of the fading is located in a range of 18 dB to 28 dB, which is significantly higher than that in the garage. A higher rate of fading change was also observed. Measurement dropouts were also more frequent. The corresponding EPE characteristics, also shown in Figure 13, are also more extreme than in the garage and are caused by larger multipath due to the larger dimensions of the structure. Indeed, 93% of the EPEs are in the range of −50 m to 50 m, whereas in the garage, 90% were within the range of −10 m to 10 m. The question now is whether such an environment can also be simulated with the same degree of fidelity as that of the garage.
PDFs of measured fading and EPEs and associated 1st and 2nd order derivatives – Oval test.

The same simulation procedures designed for the garage environment were utilized to simulate the arena environment. Six satellites were chosen over a 40-minute period. The attenuation levels of each satellite signal were different during the simulation. LOS signals were attenuated between 22 dB and 32 dB. The multipath power levels were set to −6 dB to 0 dB, relative to the LOS. The maximum possible distance between the antenna and the reflector was set to 220 m.
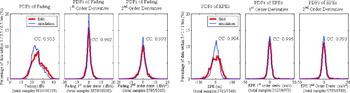
The agreement between field and simulated measurements are summarized in Figure 14, which shows the PDFs of fading and EPEs and their associated first and second order derivative. The level of correlation between field and simulated measurements remains high with correlation coefficients at 0·95 or higher, except for that between field and simulated EPEs, which is at 0·90. This lower value illustrates the difficulty in simulating such a difficult environment. However, a correlation coefficient of 0·90 is still considered excellent given the rapid multipath variations and high Gaussian measurement noise caused by high fading and affecting both field and simulated measurements. It is worthwhile to remember that the “simulated” measurements are actually obtained using an actual HSGPS receiver connected to a hardware signal generator.
PDFs of fading and associated 1st & 2nd order derivatives – Oval test.

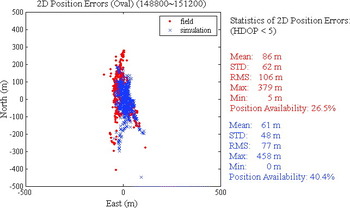
The field and simulated horizontal position errors are shown in Figure 15. Poor satellite availability also resulted in degraded position accuracy. An HDOP threshold of <5 was used and reduced position availability to 26% in the case of the actual measurements. Frequent measurement dropouts could not be easily reproduced in the simulation and this resulted in a higher position availability of 40%. The answer to the fundamental question as to whether it is possible to reproduce such a complex environment for the purpose of testing HSGPS against certain minimum operational performance standards and inter-comparing receiver performance is yes with a high level of fidelity, given the general agreement between the various characteristics tested.
Field and simulator horizontal position errors – Oval test.

7. CONCLUSIONS
Simulation of signals received under indoor environments is essential for performance evaluation of high sensitivity GPS enabled devices and highly desirable to meet pre-defined minimum operational performance standards. Once the simulator scripts are defined for a certain environment category, they are repeatable and transportable and can therefore be used by a host of users. Due to the complex propagation channel characteristics of indoor environments, replication of specific environments is laborious but can be achieved as demonstrated herein for two environments, one considered relatively benign and the other, more difficult. The agreement between field and simulated measurements can be considered satisfactory for a variety of applications. Other environments can also be reproduced with the same degree of fidelity, as demonstrated by Hu (Reference Hu2006). Other environments can obviously be reproduced using such an approach to obtain a series of “standard” environments that can be used by HSGPS equipment designers to test the performance of their prototype and by industry to develop performance standards for various classes of applications, such as E911/999.