





Introduction
The terahertz (THz) frequency range, typically defined between 300 GHz and 3 THz, occupies the spectral region between microwave and infrared radiation, corresponding to free-space wavelengths from approximately 1 mm down to 100  $\unicode{x03BC}$m [Reference Siegel1]. Owing to its non-ionizing photon energy, its ability to penetrate many non-conductive and optically opaque materials, and its strong interaction with polar molecules and water content, THz radiation has attracted significant interest across a broad range of scientific and technological domains. These properties have motivated extensive investigation of THz techniques for applications including radio astronomy [Reference Phillips and Keene2], security screening and inspection [Reference Duling and Zimdars3–Reference Kemp, Taday, Cole, Cluff, Fitzgerald and Tribe5], non-destructive testing and material inspection [Reference Zimdars and White6, Reference Kawase, Ogawa, Watanabe and Inoue7], pharmaceutical and biological sensing [Reference Kim, Song, Yaita, Hirata and Ajito8], and biomedical imaging and diagnostics [Reference Garbacz9–Reference Danciu, Alexa-Stratulat, Stefanescu, Dodi, Tamba, Mihai, Stanciu, Luca, Spiridon, Ungureanu, Ianole, Ciortescu, Mihai, Stefanescu, Chirilă, Ciobanu and Drug13].
To date, the vast majority of silicon-based THz imaging systems operate in the far field, where image formation relies on propagating electromagnetic waves collected by free-space optics or antenna apertures.
On the transmitter side, significant progress has been achieved in compact solid-state THz signal generation using silicon technologies. Approaches based on on-chip oscillators exploiting harmonic extraction have demonstrated efficient THz radiation generation in both SiGe BiCMOS and CMOS platforms [Reference Hillger, Grzyb, Malz, Heinemann and Pfeiffer14–Reference Shirazi, Nikpaik, Mirabbasi and Shekhar17]. Alternatively, frequency multiplication of a lower-frequency fundamental signal using integrated multiplier chains has enabled broadband THz sources with increasing output power and improved spectral purity [Reference Prabhu, Grzyb, Hillger, Bücher, Rücker and Pfeiffer18–Reference Khamaisi, Jameson and Socher21]. On the receiver side, far-field THz imaging systems typically employ either coherent detection based on heterodyne receiver architectures with external local oscillators [Reference Statnikov, Grzyb, Heinemann and Pfeiffer22–Reference Rodríguez-Vázquez, Grzyb, Sarmah, Heinemann and Pfeiffer24] or incoherent detection using direct power detectors that exploit device nonlinearities for THz-to-DC rectification [Reference Sengupta, Seo, Yang and Hajimiri25–Reference Andree, Grzyb, Jain, Heinemann and Pfeiffer27]. Together, these developments underline the maturity of far-field THz imaging architectures implemented in silicon-based technologies.
Despite these achievements, the spatial resolution of far-field THz imagers is fundamentally constrained by diffraction to spot sizes on the order of the free-space wavelength, which corresponds to millimeter- scale resolution at sub-THz and low-THz frequencies [Reference Lin, Fischer, Mickan and Abbott28, Reference Adam29]. While such resolution is sufficient for macroscopic inspection tasks, including security screening and large-area material analysis [Reference Timofeev, Luomahaara, Grönberg, Mäyrä, Sipola, Aikio, Metso, Vesterinen, Tappura, Ala-Laurinaho, Luukanen and Hassel30], it is inadequate for resolving microscopic structures. This limitation is particularly critical for biomedical applications, where access to sub-cellular features, cellular morphology, and tumor-related microstructures is required to fully exploit the strong sensitivity of THz waves to water content and dielectric contrast.
A physically viable approach to overcome the diffraction limit is near-field imaging, which exploits both propagating and evanescent electromagnetic field components in the immediate vicinity of a subwavelength object. Because evanescent fields do not propagate, they must be captured within a short distance from the sample, typically using a local probe placed in close proximity to the object. In this near-field regime, the achievable spatial resolution is no longer determined by the free-space wavelength, but rather by the characteristic dimensions of the probing structure and the degree of field confinement.
Scanning near-field optical microscopy (NSOM) represents a prominent class of near-field techniques and can be broadly divided into aperture-based approaches [Reference Synge31–Reference Bethe33] and apertureless (scattering-type) implementations [Reference Wickramasinghe, Martin, Zenhausern, Nieto-Vesperinas and García34–Reference van der Valk and Planken36]. NSOM-based techniques have demonstrated spatial resolutions in the nanometer range, with record resolutions down to 20–40 nm achieved using atomic-force microscopy probes [Reference Adam29, Reference Chen, Kersting and Cho35]. However, classical NSOM systems typically rely on remotely placed illumination or detection paths, which results in weak signal levels that are further obscured by strong far-field background contributions. Consequently, long integration times are required to achieve reasonable sensitivity, and the bulky, mechanically complex nature of these setups renders them unsuitable for scalable integration.
To address these limitations, substantial effort has been devoted to the monolithic integration of the key near-field sensing components – including the THz illumination source, the near-field sensing element, and the power detection path – on a single silicon die [Reference Grzyb, Heinemann and Pfeiffer37–Reference Hillger, Jain, Grzyb, Förster, Heinemann, MacGrogan, Mounaix, Zimmer and Pfeiffer40, Reference Ameri, Chien and Niknejad42]. In contrast to classical NSOM implementations, this co-integration improves sensitivity by eliminating external bulky components and enables the use of high-volume, low-cost semiconductor technologies to realize compact and scalable multi-pixel architectures with reduced reliance on mechanical scanning.
The first fully integrated silicon-based THz near-field super-resolution sensors operating without external optics were reported in [Reference Grzyb, Heinemann and Pfeiffer37–Reference Grzyb, Heinemann and Pfeiffer39], demonstrating diffraction-limit-breaking imaging with lateral resolutions on the order of a single human cell (10–15  $\unicode{x03BC}$m). These works further enabled the development of compact multi-pixel mixed-signal architectures [Reference Hillger, Jain, Grzyb, Förster, Heinemann, MacGrogan, Mounaix, Zimmer and Pfeiffer40, Reference Ameri, Chien and Niknejad42], which achieve a high level of on-chip integration while reducing the need for external electronics, thereby moving THz near-field imaging closer to application-ready solutions.
Despite these advances, silicon-integrated near-field arrays continue to face fundamental scalability limitations. Shared illumination schemes and laterally arranged sensing components typically permit only one-dimensional multipixel scaling and lead to very low pixel densities, for example as low as 12 pixels/mm $^2$ in [Reference Hillger, Jain, Grzyb, Förster, Heinemann, MacGrogan, Mounaix, Zimmer and Pfeiffer40], rendering two-dimensional integration area-inefficient and economically unfavorable. Consequently, many reported architectures scale effectively only along a single dimension, leaving dense, camera-like two-dimensional THz near-field imaging as an open architectural challenge.
In our previous work presented at the 20th European Microwave Integrated Circuits Conference (EuMIC) [Reference Sadkaoui, Hillger, Grzyb, Du, Andree, Rücker and Pfeiffer43], we introduced a two-dimensional near-field imager with 1024 pixels based on vertically stacked integration of the imaging components, in contrast to conventional lateral integration schemes.
This approach significantly reduces the pixel footprint by eliminating the shared illumination architecture and enabling each pixel to operate independently as an independent near-field sensor. This article extends the prior work by providing a comprehensive discussion of the design and implementation challenges associated with vertical stacking of the imaging components and the resulting performance trade-offs. It further demonstrates how this concept enables high-density scaling at the array level and presents a detailed experimental characterization based on dedicated standalone breakout structures, which allow systematic evaluation of the individual building blocks.
Incoherent sensing mechanism and system requirements
Each near-field sensor pixel integrates a free-running RF oscillator (OSC) operating around 334 GHz for local illumination, a split-ring resonator (SRR) acting as the near-field sensing element with a nominal resonance frequency of approximately 327 GHz for evanescent-field interaction, and an incoherent power detector (DET) implemented using a SiGe HBT for RF-to-DC conversion.
The sensing mechanism is inherently incoherent and relies on detecting perturbations of the SRR resonance induced by the material under test (MUT). The SRR can be modeled as a frequency-selective transmission element whose effective capacitance – and thus resonance frequency – is modified by the local dielectric environment. This shifts the SRR transmission characteristic lower relative to the fixed oscillator frequency and modulates the RF power delivered to the detector as illustrated in Figure 1 [Reference Du, Andree, Grzyb, Rücker and Pfeiffer49].
Incoherent sensing principle: resonance shift of the SRR modulates the transmitted power at the fixed oscillator frequency  $f_o$, which is converted into a DC voltage variation
 $\Delta V_{\mathrm{DC}}$ by the detector. Right: vertically integrated OSC–SRR–DET chain.

The oscillator frequency  $f_o$ is intentionally chosen to lie on the right-hand slope of the SRR transmission characteristic, such that
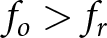 $f_o \gt f_r$. When a MUT is brought into proximity with the SRR, the increase in effective permittivity shifts the resonance frequency from
 $f_r$ to a lower value
 $f_r^{\prime}$, thereby modulating the transmitted RF power at the fixed frequency
 $f_o$. The resulting amplitude modulation is converted into a DC voltage by the detector, directly translating local electromagnetic perturbations into an electrical readout without the need for frequency sweeping or coherent phase measurements. This behavior can be interpreted through a compact system-level relation. The RF power delivered to the detector depends on the oscillator output power
 $P_{\mathrm{osc}}$, the transmission coefficient of the SRR sensing element
 $\alpha$, and the voltage responsivity of the detector
 $R_v$. The change in detector voltage induced by the presence of a MUT can therefore be expressed as
 \begin{equation}
\Delta V_{\mathrm{DC}} = P_{\mathrm{osc}} R_v \left(\alpha_{\mathrm{MUT}} - \alpha_{\mathrm{air}}\right),
\end{equation}
where  $\alpha_{\mathrm{MUT}}$ and
 $\alpha_{\mathrm{air}}$ denote the SRR transmission under the perturbed and reference conditions, respectively. In the implemented array architecture, this analog voltage variation is subsequently converted into digital counts through the column-based readout circuitry, thereby linking dielectric perturbations in the near field of the SRR to the measured pixel output.
This sensing principle lends itself naturally to a compact pixel architecture, as it requires only local illumination, sensing, and detection without global synchronization or shared RF distribution. Exploiting this architectural freedom motivates a departure from conventional laterally separated RF layouts toward vertically stacked integration of the imaging components by leveraging the available back-end-of-line (BEOL) stack. The latter comprises seven aluminum layers implemented in a 130-nm SiGe BiCMOS process from IHP, featuring 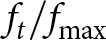 $f_t/f_{\mathrm{max}}$ of
 $350/450~\mathrm{GHz}$ [Reference Rücker, Heinemann and Fox50]. The BEOL provides a total vertical thickness of approximately
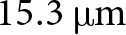 $15.3~\unicode{x03BC}\mathrm{m}$, which enables effective vertical separation of sensing, illumination, and detection.
This vertical integration can be exploited to embed the oscillator in the lower metal layers beneath the SRR and detector while keeping a sensing interface close to the chip surface (Figure 2). As a result, direct parasitic loading of the SRR is reduced and the robustness of the resonant response is improved. In addition, the illumination and detection paths are implemented deeper in the stack and electromagnetically isolated from the MUT by inserting a grounded metal plane between the SRR and the underlying circuitry. This improves isolation and stabilizes RF coupling into the SRR. These benefits come at the cost of increased implementation complexity. Specifically, RF circuitry implemented in the thin intermediate metal layers (M1–M5) suffers from higher ohmic losses, which limit efficiency and available RF power and, in the worst case, may prevent oscillation.
Cross-sectional SEM image of the BEOL stack of the 130-nm SiGe BiCMOS technology. The BEOL comprises five intermediate metal layers (M1–M5) and two thick top-metal layers (TM1, TM2). For each metal layer, the corresponding thickness and sheet resistance are indicated.

Figure 2 Long description
The diagram features a cross-sectional scanning electron microscope image of a back-end-of-line stack from a 130-nanometer silicon-germanium BiCMOS technology. The image is flanked by labels indicating the properties of various metal layers. On the left, the layers are labeled from bottom to top as M1, M3, M5 and TM2. M1 is 420 nanometers thick with a sheet resistance of 110 milliohms per square. M3 and M5 are each 490 nanometers thick with a sheet resistance of 88 milliohms per square. TM2 is 3 micrometers thick with a sheet resistance of 11 milliohms per square. On the right, the layers are labeled from bottom to top as M2, M4 and TM1. M2 and M4 are each 490 nanometers thick with a sheet resistance of 88 milliohms per square. TM1 is 2 micrometers thick with a sheet resistance of 18 milliohms per square. The central SEM image shows the vertical integration of these metal layers, with a scale bar indicating 100 nanometers. The labels provide information on the metal layer, thickness and sheet resistance in milliohms per square.
The increased RF losses associated with this vertical integration therefore translate into a system-level constraint on the available illumination power at the detector input. This raises a key design question about the minimum RF illumination power required to maintain reliable sensing performance that can still be supported by the measurement instruments in the lab. To address this, the detector responsivity  $R_i$ was characterized as a function of the incident RF input power
 $P_{in}$, with the objective of identifying the lowest illumination level that still ensures sufficient sensitivity under realistic operating conditions. The detector is implemented using an HBT-based power detector operating in a common-emitter configuration. The RF input power
 $P_{in}$ is capacitively coupled to the transistor base, while the rectified DC signal is extracted at the collector. The detector is biased in the forward-active region and operated in current mode with a
 $0\,\Omega$ load resistance, and the current responsivity is evaluated over a wide range of RF input power levels. The simulated responsivity as a function of
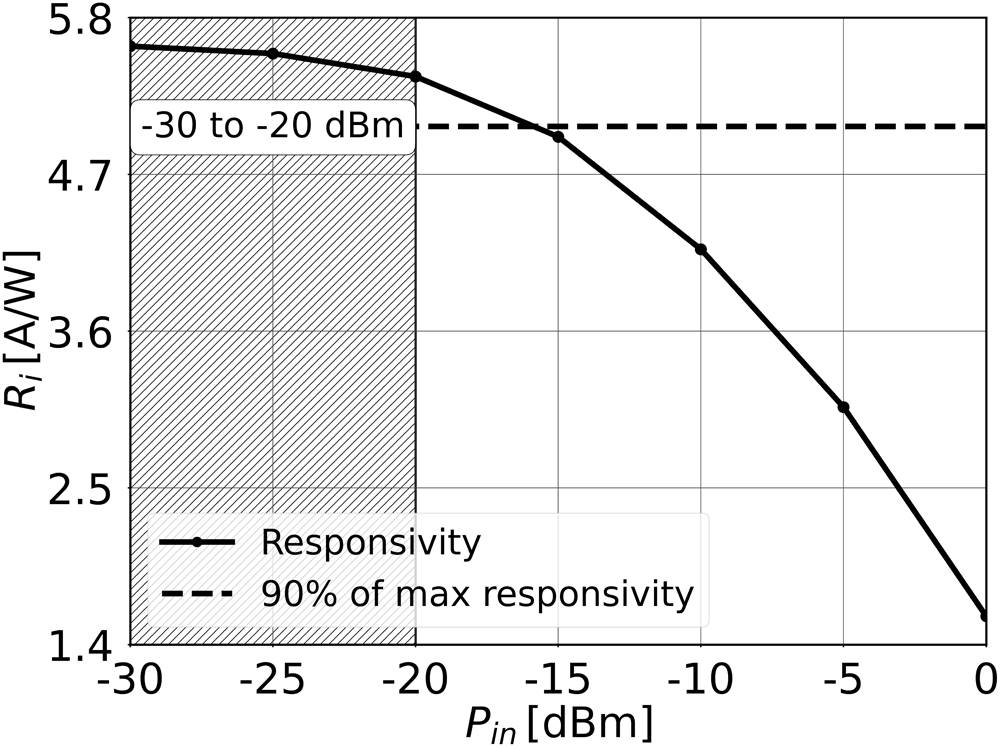
 $P_{in}$ at 334 GHz is shown in Figure 3. At low input power levels, the detector maintains an almost constant responsivity close to its maximum value. In particular, an input power range between approximately
 $-30$ and
 $-20$ dBm preserves more than 90 % of the peak responsivity, as highlighted by the shaded region. For higher input powers, the responsivity gradually decreases due to the device slowly entering the saturation region.
Simulated detector current responsivity  $R_i$ vs RF input power
 $P_{in}$ at 334 GHz. The shaded region indicates the acceptable illumination power range delivered by the OSC–SRR chain, within which the responsivity remains above 90 % of its maximum value. This operating window allows a reduction of the OSC output power without compromising detector sensitivity, thereby facilitating a compact and scalable on-chip implementation.

These results indicate that the detector remains highly sensitive even under reduced illumination. Consequently, excessively high RF power levels are neither required nor beneficial for near-field sensing. This directly relaxes the output power requirements of the on-chip oscillator and mitigates the performance penalties imposed by BEOL losses, thereby supporting a compact and scalable implementation.
Evanescent-field sensing: SRR
Design description
Figure 4 illustrates the implemented cross-bridged double SRR realized within the aforementioned BEOL stack. The structure represents a modified version of the designs reported in [Reference Grzyb, Heinemann and Pfeiffer39, Reference Hillger, Jain, Grzyb, Förster, Heinemann, MacGrogan, Mounaix, Zimmer and Pfeiffer40]. The sensing element is based on a buried host transmission line loaded by two mirrored, subwavelength SRRs whose buried split gaps are oriented parallel to the excitation line. This topology enables a compact footprint while providing strong near-field confinement at the chip surface, which is essential for high-resolution evanescent-field sensing.
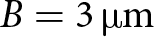
Three-dimensional view of the implemented SRR spanning the upper two thick metal layers of the seven-layer BEOL stack, together with the top view showing the RF input from the oscillator (OSC) and the output towards the detector (DET), and simulated electric-field distribution at 327 GHz with no object present on the SRR. The geometrical dimensions are  $A = 4.5\,\unicode{x03BC}\mathrm{m}$,
 $B = 3\,\unicode{x03BC}\mathrm{m}$,
 $C = 32\,\unicode{x03BC}\mathrm{m}$,
 $D = 1.64\,\unicode{x03BC}\mathrm{m}$, and
 $E = 7.95\,\unicode{x03BC}\mathrm{m}$.

Figure 4 Long description
The left side of the image shows a three-dimensional view of a split-ring resonator (SRR) structure. Key components are labeled, including the GND plane at the top, magnetic coupling on the right and the sensing area in the center. The excitation line runs horizontally, intersecting the buried split-gap. The axes X, Y and Z are indicated for orientation. The right side displays a top view of the SRR with a color-coded electric field distribution. The RF input (RFin) is at the bottom and the RF output (RFout) is at the top. Points A, B, C, D and E are marked along the structure. A color scale on the right indicates the electric field strength in decibels, ranging from a minimum of approximately 10.69 to a maximum of 2.604 times 10 superscript 7.
The host line is implemented as a buried microstrip that transfers RF power between the on-chip oscillator and the close-proximity detector. It can be divided into three functional regions. The central section is magnetically coupled to both SRRs through a patterned ground-plane aperture. This region governs the resonant interaction and can be modeled by an effective mutual inductance  $M_i = 21.3\,\mathrm{pH}$. The left and right sections are shielded by a continuous ground plane underneath and are therefore largely decoupled from the resonator, serving primarily as low-loss power-delivery paths. The SRR exhibits a three-dimensional topology in which most of the resonant structure is buried within the BEOL stack, including a small portion which is exposed in the top metal layer and defines the sensing region. This region consists of two closely spaced, electrically short metal strips forming an effective split-gap capacitor. Its lateral dimensions (
 $3\,\unicode{x03BC}\mathrm{m} \times 32\,\unicode{x03BC}\mathrm{m}$) are substantially smaller than the free-space wavelength at the operating frequency. Consequently, the electric near-field is strongly confined to the surface region, whereas the remaining parts of the resonator are electromagnetically shielded from the MUT. The sensing principle exploits the stopband behavior of the SRR, which acts as a resonant transmission gate between the illumination source and the detector.
The transmitted power is governed by several parameters, including the dielectric properties (described by the real and imaginary parts of the relative permittivity  $\varepsilon_r^{\prime}$ and
 $\varepsilon_r^{\prime\prime}$), the spatial separation
 $d$ between the sample and the sensing surface, and the sample geometry, in particular its thickness
 $t$. The insertion of the SRR between the oscillator and the power detector necessitates the investigation of two key impedance-related effects: (i) the loading of the SRR output by the detector input impedance
 $Z_{\mathrm{in,DET}}$, and (ii) the variation of the SRR input impedance
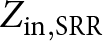 $Z_{\mathrm{in,SRR}}$ induced by the dielectric properties of the MUT, as observed by the OSC.
The input impedance of the HBT-based power detector around the SRR resonance frequency is predominantly capacitive and is governed by the device parasitic base–emitter capacitance  $C_{be}$ at the expected attenuated input power levels [Reference Andree, Grzyb, Jain, Heinemann and Pfeiffer47, Reference Andree, Grzyb, Rücker and Pfeiffer48]. For such capacitive loading, the slope of the detector-loaded SRR transmission response is expected to change; however, the frequency position of the transmission minimum remains largely unchanged. This indicates that the maximum sensor power response is only weakly sensitive to the detector impedance [Reference Grzyb, Heinemann and Pfeiffer39].
To quantify this effect, the detector input impedance  $Z_{\mathrm{in,DET}}$ was simulated using the HICUM device model with the transistor biased in the forward-active region (
 $V_B = 770~\mathrm{mV}$,
 $V_C = 1.2~\mathrm{V}$) and an expected input power level of
 $-25~\mathrm{dBm}$. At the resonance frequency of approximately
 $327~\mathrm{GHz}$, the resulting impedance is
 $Z_{\mathrm{in,DET}} = 41 - j88~\Omega$. Figure 5 illustrates the variation of the transmission minimum for different complex load impedances, expressed as the deviation relative to a
 $50~\Omega$ reference termination. Around the simulated detector impedance region, the depth of the transmission minimum varies by approximately
 $-3$ to
 $-6~\mathrm{dB}$, confirming that the detector loading affects the notch depth but does not significantly perturb the resonance position.
Load-pull analysis of the SRR response showing the variation of the transmission minimum notch depth 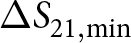 $\Delta S_{21,\min}$ as a function of the complex load impedance
 $Z_{L,SRR}=\Re\{Z_{L,SRR}\}+j\Im\{Z_{L,SRR}\}$. The color map represents the relative shift in notch depth with respect to the baseline condition.

Figure 5 Long description
Heatmap with a filled contour field and contour lines. The horizontal axis label is Re(ZL,SRR) (ohm). The horizontal axis tick labels shown are 10, 20, 30, 40 and 50. The vertical axis label is Im(ZL,SRR) (ohm). The vertical axis tick labels shown are 0, minus 20, minus 40, minus 60, minus 80 and minus 100. A vertical color bar at the right is labeled delta S21 (decibel). The color bar tick labels shown are 3, 0, minus 3, minus 6, minus 9, minus 12, minus 15 and minus 18. Contour lines span the heatmap area, with denser spacing near the left side and wider spacing toward the right side. No numeric values are printed inside the heatmap cells.
Measurement results
The SRR was characterized as a linear two-port network using a VNA-based measurement setup in the WR-2.2 waveguide band, as shown in Figure 6.
Two-port VNA-based measurement setup for SRR characterization in the WR-2.2 frequency band. A metallic needle with a  $\sim$7
 $\unicode{x03BC}$m tip width is positioned above the sensing region to emulate a perfect electric conductor (PEC) and to probe the maximum resonance-frequency shift.

Figure 6 Long description
Two-port VNA-based measurement setup for characterizing a split-ring resonator, labeled SRR, in the WR-2.2 frequency band. At the top, the SRR is shown with a metallic needle positioned above it, emulating a perfect electric conductor. The SRR has dimensions marked as 140 micrometers in height and 250 micrometers in width. Below the SRR, the setup includes two WR-2.2 waveguide connections on either side, each linked to a VDI WM570 module. These modules are labeled with frequency ranges of 325 to 500 gigahertz for both intermediate frequency (IF) and local oscillator (LO). The modules are connected to ground-signal-ground (GSG) probes, which interface with the device under test (DUT) in the center. The DUT is positioned between the two GSG probes. On the left, a vector network analyzer (VNA), specifically the Agilent E8361A model, is connected to the setup, facilitating the measurement process.
Measurements were performed over 325–500 GHz using VNA frequency extenders operated in a TX/RX configuration. The DUT was accessed via on-chip RF probe interfaces, enabling direct two-port S-parameter measurements. A full SOLT calibration was applied at the probe tips to reference the data to the DUT planes. The extracted S-parameters were used to quantify the SRR stopband behavior, resonance frequency, and modulation depth.
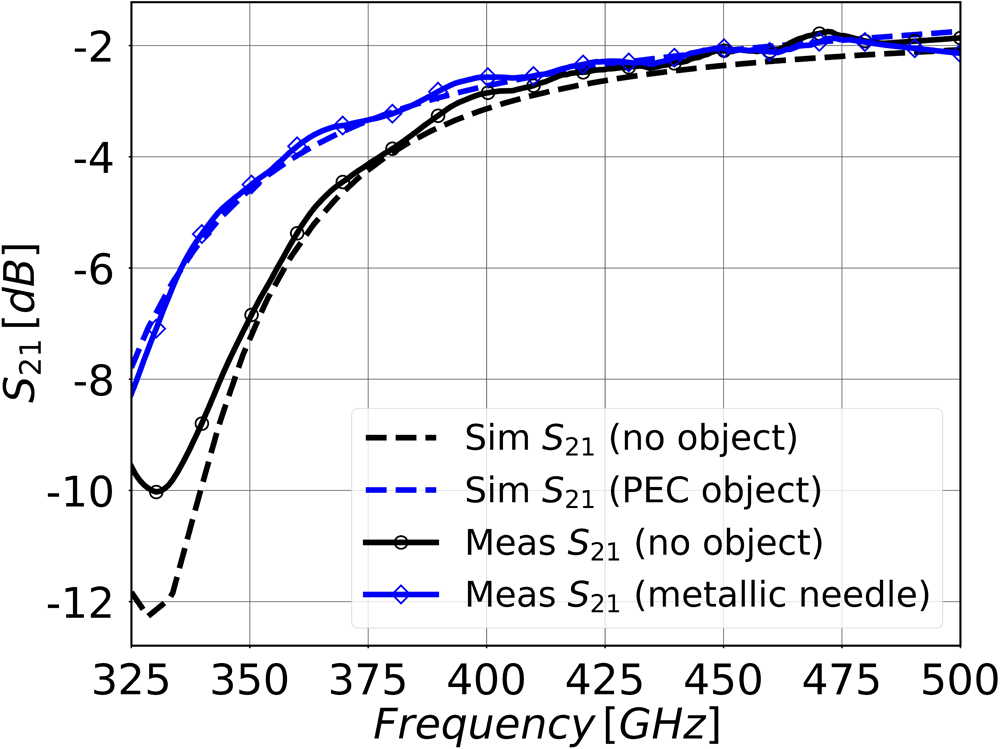
Figure 7 compares the measured and simulated power transmittance of the SRR-loaded transmission path for two conditions: without object and with a metallic needle positioned in the immediate near-field of the resonator. The measured responses exhibit a characteristic frequency-dependent attenuation with a pronounced resonance-induced minimum, confirming the expected stopband behavior of the SRR structure. In the absence of an object, the measured power transmission curve follows a smooth and monotonic increase with frequency beyond the resonance minimum. When the metallic needle is introduced, the resonance feature undergoes a shift towards lower frequencies. The maximum frequency displacement between the two measured curves is approximately  $18$–
 $20\,\mathrm{GHz}$, which indicates a strong perturbation of the effective reactive loading of the resonator. This behavior is consistent with a reduction of the effective capacitance caused by the proximity of a conductive object, in agreement with the near-field interaction mechanism. The maximum modulation depth, defined as the difference in power transmittance between both conditions at a fixed frequency, reaches approximately
 $3.5\,\mathrm{dB}$. The measured trends show good qualitative agreement with electromagnetic simulations, both regarding the direction of the frequency shift and the relative magnitude of the perturbation. Remaining discrepancies can be attributed to practical non-idealities such as probe-to-chip coupling effects, finite conductivity and geometry of the metallic needle, surface roughness, and additional parasitic loading mechanisms not fully captured in the idealized simulation model. Overall, the results experimentally validate the proposed near-field sensing principle and confirm that subwavelength metallic objects in close proximity to the SRR can be reliably detected through frequency-shift-based modulation of the transmission response.
Corresponding simulated and measured power transmittance of the SRR with and without the metallic needle, with an estimated resonance shift of up to  $\sim\!20\,\mathrm{GHz}$.

THz illumination source: OSC
Circuit description
Several oscillator topologies were investigated as potential candidates for the pixel-level illumination source, including distributed oscillators [Reference Saeidi, Venkatesh, Chappidi, Sharma, Zhu and Sengupta45], push–push and triple-push architectures [Reference Zhao, Grzyb and Pfeiffer16], and Colpitts-based implementations [Reference Hillger, Grzyb, Malz, Heinemann and Pfeiffer14, Reference Voinigescu, Tomkins, Dacquay, Chevalier, Hasch, Chantre and Sautreuil44]. While these approaches can offer advantages in output power or spectral purity, they are generally less suited to the constraints imposed by dense two-dimensional integration and vertically stacked pixel architectures. In particular, they tend to incur larger area and routing overhead, increased biasing complexity, or stronger sensitivity to load variations at sub-THz frequencies. In contrast, cross-coupled oscillators typically provide a highly compact implementation and strong negative-resistance generation for a given device transconductance, which makes them inherently more robust against the elevated losses associated with RF circuitry implemented in the lower BEOL metal layers. Although cross-coupled oscillators offer only moderate output power and a limited tuning range compared to the aforementioned topologies [Reference Voinigescu, Tomkins, Dacquay, Chevalier, Hasch, Chantre and Sautreuil44], these characteristics are well aligned with the requirements of the proposed sensing architecture. The detector DET exhibits a wide responsivity plateau and compresses at higher input power (Figure 3); consequently, system performance benefits from delivering an illumination level within this range rather than maximizing oscillator output power. Likewise, wideband tunability is not required for the fixed-frequency, resonator-based evanescent-field transduction principle (Figure 1). Overall, the cross-coupled topology provides a favorable trade-off between robustness, power efficiency, and integration density for large-scale pixel arrays.
The oscillator schematic and corresponding layout implementation are shown in Figure 8. The oscillator core consists of a cross-coupled transistor pair,  $T_{1}$ and
 $T_{2}$, each implemented with an emitter area of
 $A_{e} = 3 \times 0.12 \times 0.9~\unicode{x03BC}\text{m}^2$. The resonant tank is formed by the on-chip inductance
 $L_{\mathrm{tank}} = 14~\text{pH}$ and capacitance
 $C_{\mathrm{tank}} =
28~\text{fF}$, together with the intrinsic base–collector capacitances of
 $T_{1}$ and
 $T_{2}$. The tank inductance is implemented as a buried stripline in the lowest metal layer (M1) and shaped to match the footprint of the overlying sensing resonator, thereby avoiding additional area consumption. The core is laid out fully symmetrically to minimize parasitic mismatch, which is critical for stable operation and mode purity at sub-THz frequencies. The DC supply is delivered through an RF choke,
 $L_{\mathrm{out}} = 110~\text{pH}$. The oscillator output power is coupled to the SRR feed line via a coupling capacitor
 $C_{\mathrm{out}} = 25~\text{fF}$ and the oscillation frequency is tuned by adjusting the supply voltage
 $VCC_{osc}$.
Schematic and layout implementation of OSC. The tank capacitances  $C_{\text{tank}}$ are implemented using MIM capacitors, while the output coupling capacitor
 $C_{\text{out}}$ is realized parasitically through metal-layer overlap. The oscillator output is coupled single-endedly to the SRR.

Figure 8 Long description
Oscillator with a cross-coupled transistor pair labeled T subscript 1 and T subscript 2. The resonant tank is formed by inductors labeled L subscript tank and capacitors labeled C subscript tank. Resistors labeled R are connected in series with the transistors. The DC supply voltage VCC subscript osc is connected through an RF choke labeled L subscript out and the output is coupled via a capacitor labeled C subscript out to the SRR. The layout implementation on the right shows the tank inductance L subscript tank implemented as a buried stripline in the lowest metal layer M1, with the capacitance C subscript tank and resistors R. The base voltage V subscript base, osc, int is indicated. The layout is fully symmetrical to minimize parasitic mismatch, with metal layers M1 and M2 shown.
All tank capacitors  $C_{\mathrm{tank}}$ are implemented using MIM structures, while
 $C_{\mathrm{out}}$ is realized parasitically through controlled metal-layer overlap. The internal base bias voltage,
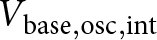 $V_{\mathrm{base,osc,int}}$, is generated using a diode-connected transistor biased in the forward-active region. This self-biased approach reduces area and parasitic capacitance and improves robustness against PVT variations compared to resistive-divider biasing, which is advantageous for large-scale oscillator arrays.
Measurement results
A breakout chip was fabricated to experimentally characterize the oscillator in terms of output power and oscillation frequency. The oscillator output is extracted single-endedly and terminated with a 50  $\Omega$ pad, allowing sequential power and frequency measurements using the same RF interface.
The measurement setup is shown in Figure 9. For output power characterization, the oscillator output is routed through a J-band WR-3 to WR-10 taper and a J-band waveguide bend to an Erickson PM5 power meter. For frequency measurements, the output signal is downconverted using an OML WR-3 harmonic mixer, operated slightly beyond its nominal frequency range to cover the oscillation frequency, and the resulting IF signal is analyzed with a spectrum analyzer. All frequency-dependent losses introduced by probes, waveguide bends, tapers, and extension modules were calibrated and de-embedded.
Measurement setup for on-chip oscillator (OSC) characterization, enabling output power measurement using an Erickson PM5 power meter and frequency analysis via a VDI WM570 downconversion module.

Figure 9 Long description
Measurement setup for on-chip oscillator characterization is illustrated. On the left, a power meter labeled Erickson PM5 is connected to a WR-3 to WR-10 taper, which is linked to a J-band waveguide bend. Below this, an OML module is shown with frequency range 220 to 325 GHz, connected to a signal generator labeled Agilent E8257D and a spectrum analyzer labeled Keysight N9010B. The signal generator is connected to the OML module, which outputs an IF signal to the spectrum analyzer. On the right, the oscillator labeled OSC is depicted with dimensions 385 micrometers by 260 micrometers. The oscillator is connected to a device under test labeled DUT, which interfaces with a power supply. The DUT is connected to ground-signal-ground labeled GSG and ground-power-signal labeled GPS. The setup enables output power measurement and frequency analysis, with all components clearly labeled and connected as described.
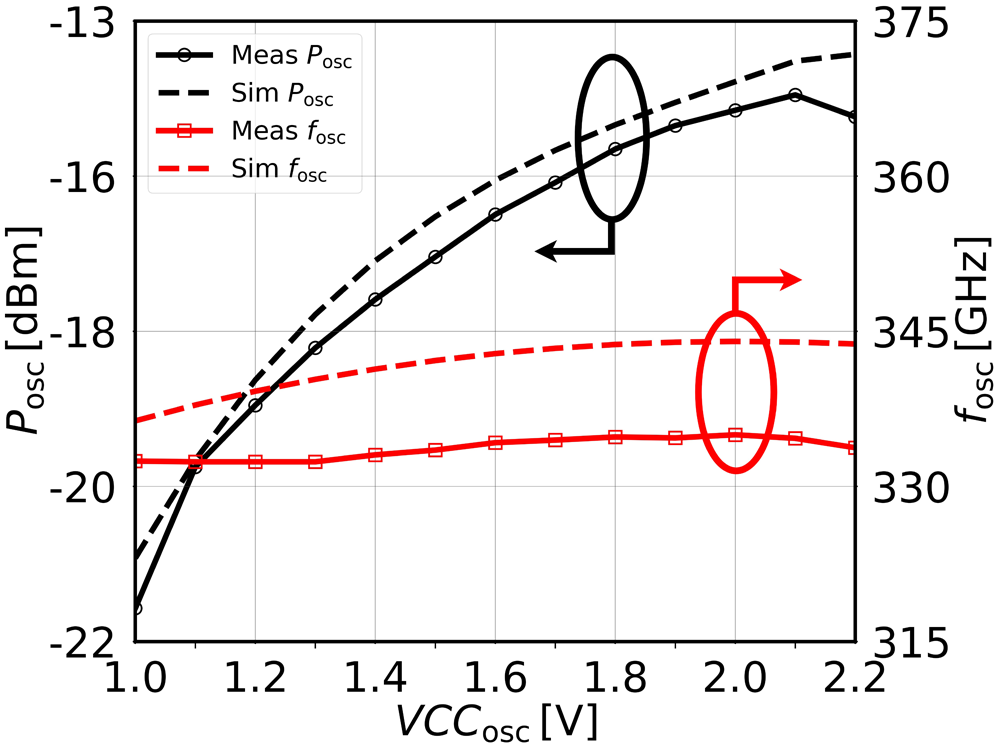
Figure 10 depicts the measured and simulated output power  $P_{\mathrm{osc}}$ and oscillation frequency
 $f_{\mathrm{osc}}$ as a function of the oscillator supply voltage
 $VCC_{\mathrm{osc}}$. Measurements were performed for an internal base bias of
 $V_{\mathrm{base,osc,int}} = 860~\mathrm{mV}$, which yielded the maximum measured output power. The supply voltage was swept from 1.0 to 2.2 V. A peak measured output power of approximately
 $-14~\mathrm{dBm}$ is obtained at
 $VCC_{\mathrm{osc}} = 2.1~\mathrm{V}$, corresponding to an oscillation frequency of about 334 GHz and a peak DC-to-RF efficiency of approximately 0.03%.
Simulated and measured characterization results of OSC. Black curves indicate the output power  $P_{\mathrm{osc}}$, while red curves represent the oscillation frequency
 $f_{\mathrm{osc}}$.

Figure 10 Long description
Two overlaid line plots share the same horizontal axis. The horizontal axis label is VCCosc in V, ranging from 1.0 to 2.2 with tick marks at 1.0, 1.2, 1.4, 1.6, 1.8, 2.0 and 2.2. The left vertical axis label is Posc in decibel milliwatt, ranging from minus 22 to minus 13 with tick marks at minus 22, minus 20, minus 18, minus 16 and minus 13. A legend lists Meas Posc and Sim Posc. The Meas Posc curve starts near minus 22 at 1.0 V and rises steeply to around minus 16 by about 1.2 V, then increases more gradually to around minus 14 to minus 13.5 by about 1.8 to 2.2 V. The Sim Posc curve follows a similar shape and lies close to the measured curve, reaching around minus 14 to minus 13.5 near 2.2 V. A black oval annotation highlights a region near about 1.7 to 1.9 V and about minus 15 to minus 14. The right vertical axis label is fosc in GHz, ranging from 315 to 375 with tick marks at 315, 330, 345, 360 and 375. A legend lists Meas fosc and Sim fosc. The Meas fosc curve begins near 330 at 1.0 V and increases slightly to around 334 to 336 by 2.2 V. The Sim fosc curve is close to the measured curve and also increases slightly across the same voltage range. A red oval annotation highlights a region near about 2.0 V and around 335 to 340. Two short arrows appear near the highlighted regions, one near the black-highlighted area and one near the red-highlighted area.
The measured frequency tuning range with respect to  $VCC_{\mathrm{osc}}$ extends from approximately 332 to 335 GHz, while oscillation frequencies down to about 307 GHz are observed at higher supply voltages. For
 $VCC_{\mathrm{osc}} \gt 2.2~\mathrm{V}$, the measured output power decreases, indicating the onset of device stress and incipient breakdown effects. Process-induced device variations may lead to small pixel-to-pixel deviations in the oscillation frequency. Based on Monte Carlo simulation results, the expected worst-case spread is on the order of
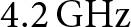 $4.2\,\mathrm{GHz}$ around the nominal oscillation frequency. Temperature variations may slightly shift the oscillator frequency and detector operating point; however, these effects mainly result in a global drift of the sensor output rather than random pixel instability.
The simulated and measured output power exhibit very good agreement, with a maximum deviation of approximately 0.5 dB within the nominal operating region. At higher supply voltages, the deviation increases, which is attributed to IR drops caused by the relatively high sheet resistance of the lowest metal layer (M1) used for the oscillator implementation. In contrast, the measured oscillation frequency is consistently lower than the simulated prediction. This offset is attributed mainly to unmodeled parasitic effects, which increase the effective tank capacitance, leading to a downward shift of the oscillation frequency compared to simulation.
Despite significant implementation challenges and performance degradation associated with miniaturization and lower-BEOL implementation, the measurement results confirm the feasibility of scaling the oscillator to match the SRR footprint while still providing sufficient output power for near-field operation. As shown in the following section, the generated RF power can be further attenuated by the SRR without compromising detector sensitivity.
Output power attenuation: OSC+SRR
A critical aspect of the proposed system is the correct alignment of the oscillator frequency with the stop-band SRR, as this determines the effective attenuation applied to the illumination signal. An improper frequency mapping may lead to excessive attenuation, thereby limiting the detectable signal, or insufficient attenuation, which can drive the detector into saturation and significantly degrade its responsivity. Beyond this first-order matching requirement, second-order effects such as frequency pulling of the oscillator under varying load conditions must also be considered. These effects originate from changes in the input impedance of the SRR induced by different dielectric properties of the MUT.
Circuit description
The oscillator output power  $P_{\mathrm{osc}}$ is capacitively coupled to the SRR host line through a
 $25\,\mathrm{fF}$ capacitor, without an intermediate buffer. Although such direct coupling can, in principle, introduce mutual interaction between the oscillator tank and the load, its impact was quantified through a load–pull analysis of the complex load impedance
 $Z_{L,\mathrm{osc}}$ at the oscillator output. Figure 11 shows the simulated frequency shift
 $\Delta f = f_{\mathrm{osc}} - f_{0}$ as a function of
 $Z_{L,\mathrm{osc}}$, evaluated at the operating point of peak output power (
 $V_{\mathrm{CC,osc}} = 2.1\,\mathrm{V}$,
 $V_{\mathrm{base,osc,int}} = 860\,\mathrm{mV}$). The baseline oscillation frequency for a matched termination is
 $f_{0} \approx 334\,\mathrm{GHz}$. The sweep covers
 $\Re\{Z_L\}=0\ldots 60~\Omega$ and
 $\Im\{Z_L\}=-100\ldots 25~\Omega$, thereby emulating the predominantly capacitive behavior observed at the SRR input and the expected variation of resonator and detector loading for different materials under test. Specifically, the impedance range spans from air (
 $Z_{\mathrm{in,SRR}} \approx 26 - j66~\Omega$) to a perfect electric conductor (PEC,
 $Z_{\mathrm{in,SRR}} \approx 11 - j35~\Omega$) at 334 GHz with the SRR terminated by the detector, corresponding to the maximum achievable loading contrast.
Simulated oscillation frequency shift  $\Delta f = f_{\mathrm{osc}} - 334\,\mathrm{GHz}$ as a function of the complex load impedance
 $Z_{L,osc}$.

Figure 11 Long description
Contour heatmap with a vertical scale bar at the right labeled delta f (gigahertz). Scale bar tick labels, top to bottom: 3.7, 3.0, 2.2, 1.5, 0.7, 0.0, minus 0.7, minus 1.5, minus 2.2, minus 3.0. Horizontal axis label: Re{ZL,osc} (ohm). Horizontal axis tick labels: 20, 40, 60. Vertical axis label: jZL,osc (ohm). Vertical axis tick labels: 25, 0, minus 25, minus 50, minus 75, minus 100. The plotted field is shown as filled contours with multiple contour boundary lines. The highest scale-bar values occur near the upper-left corner of the plot area. Lower scale-bar values occupy much of the lower-left region and extend across the lower portion of the plot. Contour lines curve outward from the upper-left region and become more widely spaced toward the right side of the plot.
The results exhibit the characteristic signature of load-induced frequency pulling: the oscillation frequency is predominantly sensitive to changes in the reactive part  $\Im\{Z_{L,osc}\}$, since reactive loading perturbs the phase condition of the oscillation loop and effectively shifts the tank resonance seen by the active core [Reference Razavi46]. In contrast, variations of
 $\Re\{Z_{L,osc}\}$ mainly modify the effective damping (loaded
 $Q$) and thus the oscillation amplitude; their influence on frequency is secondary and occurs indirectly through nonlinear AM–PM conversion and finite output conductance of the active devices. Across the full impedance range, the maximum simulated shift is
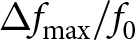
 $\Delta f_{\max}=4.26\,\mathrm{GHz}$ at
 $Z_{L,osc} \approx 1 + j10~\Omega$, corresponding to
 $1.27\%$ of the nominal frequency (
 $\Delta f_{\max}/f_0$ with
 $f_0=334\,\mathrm{GHz}$). Overall, the comparatively weak dependence of
 $f_{\mathrm{osc}}$ on
 $Z_{L,osc}$ indicates sufficient isolation of the resonant core from load variations, consistent with the low output sensitivity expected from the single-ended architecture with a virtual AC ground at the output node. This is beneficial for robust operation in the presence of SRR- and object-induced impedance changes and supports a largely decoupled optimization of oscillator performance and detector-loaded sensing network.
Measurement results
Mapping the oscillation frequency onto the resonance characteristic of the SRR requires a dedicated breakout in which the oscillator is directly terminated by the resonator (OSC+SRR), as shown in Figure 12. The measurement setup is identical to that used for the standalone oscillator characterization. The method is based on evaluating the attenuated output power  $P_{\mathrm{osc,srr}}$ transmitted through the SRR.
Measurement setup for characterization of the on-chip oscillator loaded by the SRR (OSC+SRR). A metal probe with an approximately  $7\,\unicode{x03BC}\mathrm{m}$ tip width is used to perturb the resonator. The output power is measured with an Erickson PM5 power meter, and the oscillation frequency is analyzed using a VDI WM570 downconversion module.

Figure 12 Long description
Measurement setup for characterizing an on-chip oscillator loaded by a split-ring resonator (SRR). On the left, a power meter labeled Erickson PM5 is connected to a WR-3 to 10 waveguide. Below it, an OML module is shown with labels IF 220 to 325 GHz and LO. A signal generator, identified as Agilent E8257D, is connected to the setup, followed by a spectrum analyzer labeled Keysight N9010B. The central part of the diagram features a detailed view of the SRR, with dimensions marked as 280 micrometers by 385 micrometers. A metal probe is depicted perturbing the resonator. Below the SRR, a device under test (DUT) is connected to ground-signal-ground (GSG) and ground-power-signal (GPS) terminals. A power supply is shown on the right, connected to the GPS. The entire setup is labeled OSC plus SRR in red at the top, indicating the integration of the oscillator with the SRR. The J-Band waveguide bend is also noted in the diagram, connecting various components.
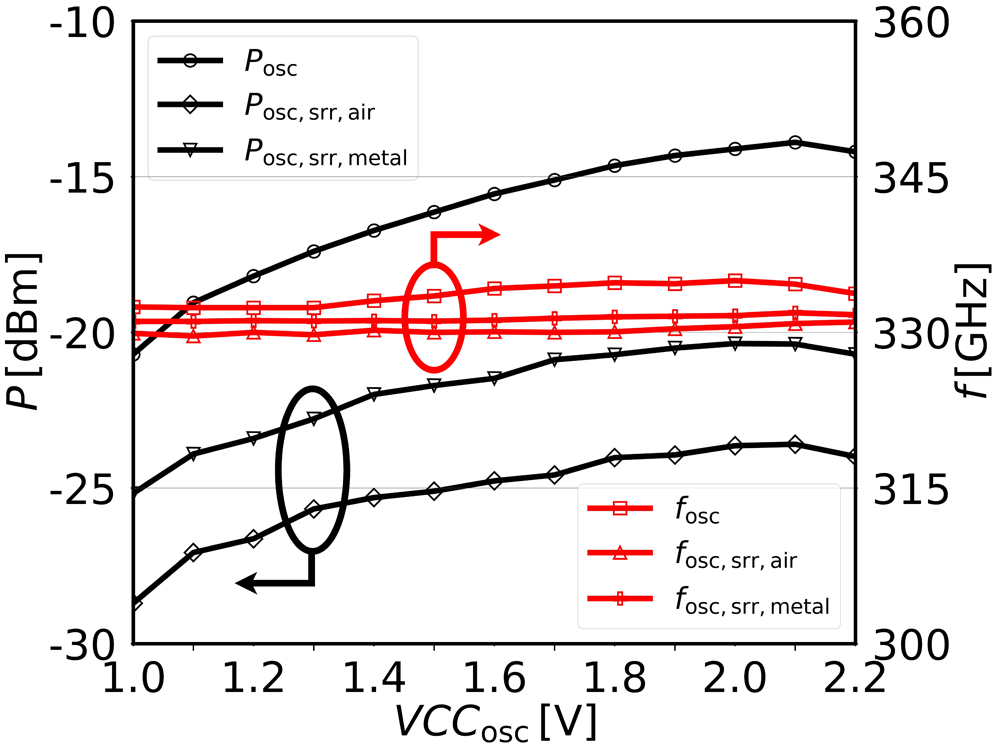
In a first step, the attenuation introduced by the resonator is estimated from the difference between the transmitted power with the SRR in air, 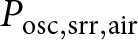 $P_{\mathrm{osc,srr,air}}$, and the reference oscillator output power
 $P_{\mathrm{osc}}$. This allows the oscillation frequency
 $f_{\mathrm{osc}}$ to be approximately mapped onto the SRR transmission characteristic. However, this approach alone remains ambiguous, since the attenuation is symmetric on both sides of the SRR stop-band and therefore does not uniquely determine whether the operating point lies on the left or right slope of the resonance. To resolve this ambiguity, an additional perturbation measurement is performed using a metallic needle with a
 $\sim7\,\unicode{x03BC}\mathrm{m}$ tip width. The metal needle emulates a strong capacitive loading condition and produces the maximum expected frequency shift of the resonator (Figure 1). This perturbation also leads to a characteristic change in transmitted power: if
 $P_{\mathrm{osc,srr,metal}} \gt P_{\mathrm{osc,srr,air}}$, the oscillator operates on the right-hand slope of the SRR resonance, whereas
 $P_{\mathrm{osc,srr,metal}} \lt P_{\mathrm{osc,srr,air}}$ indicates operation on the left-hand slope. This procedure enables an unambiguous identification of the oscillator operating point relative to the SRR resonance.
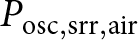
The power and frequency measurements in Figure 13 allow several conclusions regarding the sensing assumptions introduced earlier. The presence of a metallic needle above the sensing area leads to an increase in the measured output power. This observation confirms that the operating frequency  $f_{\mathrm{osc}}$ is located on the right-hand slope of the SRR resonance. Second, the measured attenuation introduced by the SRR is in good agreement with the independently characterized transmission response shown in Figure 7. At the peak operating point (
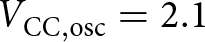 $V_{\mathrm{CC,osc}} = 2.1$ V), the standalone oscillator output power
 $P_{\mathrm{osc}}$ is reduced from approximately
 $-14$ to
 $-23$ dBm, corresponding to an attenuation of 9 dB when coupled to the SRR in air, yielding
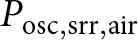 $P_{\mathrm{osc,srr,air}}$. The attenuation decreases to approximately 6 dB in the presence of a metallic perturbation, resulting in
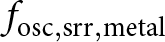
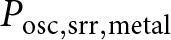 $P_{\mathrm{osc,srr,metal}}$. This quantitative agreement supports the consistency between the circuit-level measurements and the passive SRR characterization. Finally, only a minor frequency deviation is observed between the different loading conditions. The measured frequency shifts remain within the limits predicted by Figure 11, confirming that the sensing mechanism primarily modulates the transmitted power while preserving a stable oscillation frequency.
Measured output power and oscillation frequency of the oscillator under three loading conditions: standalone OSC, OSC coupled to the SRR in air, and OSC coupled to the SRR in the presence of a metallic perturbation. Black curves (left axis) show the output power  $P_{\mathrm{osc}}$,
 $P_{\mathrm{osc,srr,air}}$, and
 $P_{\mathrm{osc,srr,metal}}$, while red curves (right axis) show the corresponding oscillation frequencies
 $f_{\mathrm{osc}}$,
 $f_{\mathrm{osc,srr,air}}$, and
 $f_{\mathrm{osc,srr,metal}}$ as a function of the supply voltage
 $VCC_{\mathrm{osc}}$.

Figure 13 Long description
Plot with two y-axes and one x-axis, showing six line series and two circled callouts. X-axis label: VCC,osc (V). Range: 1.0 to 2.2, with ticks at 1.0, 1.2, 1.4, 1.6, 1.8, 2.0, 2.2. Left y-axis label: P (dBm). Range: minus 30 to minus 10, with ticks at minus 30, minus 25, minus 20, minus 15, minus 10. Right y-axis label: fosc (GHz). Range: 300 to 360, with ticks at 300, 315, 330, 345, 360. Legend entries for power (left axis): Posc, Posc, srr, air, Posc, srr, metal. Three power curves use circular markers. Legend entries for frequency (right axis): fosc, fosc, srr, air, fosc, srr, metal. Three frequency curves use plus markers. Power curves (Posc, Posc, srr, air, Posc, srr, metal): - Upper power curve increases from about minus 20 dBm at 1.0 V to about minus 14 dBm at 2.2 V. - Middle power curve increases from about minus 25 dBm at 1.0 V to about minus 20 dBm at 2.2 V. - Lower power curve increases from about minus 30 dBm at 1.0 V to about minus 24 dBm at 2.2 V. Frequency curves (fosc, fosc, srr, air, fosc, srr, metal): - One frequency curve stays near 330 GHz across the full voltage range, with a slight upward slope. - A second frequency curve stays slightly below that, near about 328 to 329 GHz. - A third frequency curve stays slightly above that, near about 331 to 332 GHz. Two circled callouts appear: one around a point on the lower power curve near VCC,osc about 1.3 V and P about minus 26 dBm and one around a point on a frequency curve near VCC,osc about 1.6 V and fosc near about 333 GHz.
Single pixel near-field sensor: OSC+SRR+DET
3-D implementation
The compact single-pixel architecture is illustrated in Figure 14. The illumination source is implemented in the lowest metal layer (M1), where its single-ended output capacitively excites the host transmission line of the SRR. To support the relatively high bias currents of OSC while maintaining a compact footprint,  $10~\unicode{x03BC}\mathrm{m}$ wide shared DC supply rails are routed through the thick top-metal layers (TM1 and TM2), which significantly reduces IR drop. However, the lossy nature of the thin M1 layer limits the available output power, which is further attenuated by the stop-band characteristics of the SRR. To prevent electromagnetic coupling and frequency pulling induced by the MUT, the OSC is vertically isolated from the sensing region by an interposed grounded metal plane implemented in M5.
3-D model of a single near-field sensor pixel, illustrating the vertical integration of OSC, SRR, and DET.

Figure 14 Long description
A 3-D model of a single near-field sensor pixel is depicted with two views: top and bottom. The top view highlights the power detector labeled as DET, shared DC supply and SRR sensing area. An interposed grounded plane is shown, along with the host line. The bottom view reveals the buried OSC. The model includes a color-coded legend indicating different metal layers: TM2 in orange, TM1 in yellow, M5 in green, M4 in red, M3 in gray, M2 in blue and M1 in light blue. The top view is marked with a width of 50 micrometers, while the bottom view is marked with a height of 100 micrometers.
Above this ground plane, the lower part of the SRR – comprising the host line and magnetically coupled LC tanks – is realized, while the sensing strips are formed in the top metal layer (TM2). These strips define a  $3~\unicode{x03BC}\text{m} \times 32~\unicode{x03BC}\text{m}$ active sensing area directly exposed to the MUT.
Circuit description
The detection path is realized using a broadband SiGe HBT power detector  $T_4$ operated in common-emitter (CE) configuration. The device employs the minimum available emitter geometry with an effective area of
 $A_e = 1 \times 0.12 \times 0.9~\unicode{x03BC}\mathrm{m}^2$, which minimizes both footprint and parasitic capacitances. The rectified DC output is extracted at the collector node.
The detection mechanism relies on the intrinsic nonlinearity of the base–emitter junction, enabling square-law rectification of the incident RF signal without requiring additional active circuitry. This direct-detection approach results in an extremely compact implementation and is therefore particularly well suited for dense array integration. The detector is biased using an adjacent current mirror, which is externally tunable via the  $VCC_{det}$ node, allowing flexible adjustment of the operating point during characterization. As illustrated in Figure 15, the compact layout enables the detector to be placed in close proximity to the SRR output. This minimizes routing parasitics and allows the RF coupling capacitor
 $C_{in}$ to be efficiently realized using the local MIM capacitor structure.
Schematic (left) and layout (right) of the integrated DET. The RF signal from OSC+SRR is capacitively coupled via  $C_{in}$ to the HBT base. The detector is biased through a local current mirror controlled by
 $VCC_{det}$, and the rectified DC output is taken at the collector.

Figure 15 Long description
A) Left sub-image shows a detector schematic inside a dashed outline. At the top-left is the node label VCCdet. A vertical resistor labeled R connects downward from VCCdet to a node that connects to the left side of a capacitor labeled Cin. The left side of Cin is connected to a left-pointing arrow labeled from OSC plus SRR. The right side of Cin connects to a node that also connects to the top of transistor T4. The bottom of T4 connects to a ground symbol. The node at the top of T4 is also connected to the right through a vertical line to an open-circle node labeled Collector Output. Along the bottom of the dashed outline, a horizontal line includes two resistors labeled R in series. The left end of this bottom line connects to the lower terminal of transistor T3. The upper terminal of T3 connects upward to the node between the vertical resistor R and the capacitor Cin. B) Right sub-image shows an integrated layout view. The label VCCdet appears near the upper-right area. Several resistor shapes are labeled R. Two metal-layer labels, M1 and M2, appear near the lower-left area. A connection line from the VCCdet label routes into the resistor region, with multiple interconnect traces extending across the layout.
Measurement results
Figure 16 shows the breakout chip used for characterization of a single imaging pixel. The collector was externally loaded with a  $1.8\,\mathrm{k}\Omega$ resistor
 $R_{ext}$ and biased at
 $1.2\,\mathrm{V}$, resulting in operation of the detector in the forward-active region, with a base voltage of
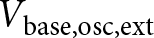
 $820\,\mathrm{mV}$, which was found to maximize the device’s responsivity. The load resistance was selected empirically, as it provided the minimum measured noise when using an AC-coupled low-noise amplifier (HVA-10M-60-F, FEMTO). All detector measurements were performed in voltage readout mode. For biasing of both the oscillator (
 $V_{\text{base,osc,ext}}$ and
 $VCC_{\text{osc}}$) and the detector (
 $VCC_{\text{det}}$ and collector output), a low-noise, low-output-impedance (
 $50\,\Omega$) power supply was used in order to minimize noise coupling through the detector bias network.
Measurement setup for on-wafer characterization of the complete imaging pixel comprising OSC, SRR, and DET. The open collector node is accessed to perform electrical measurements and to evaluate detector performance in terms of responsivity and NEP.

Figure 16 Long description
Measurement setup for characterizing an imaging pixel is shown. On the left, a low noise power supply is connected to an AC coupled amplifier, which is linked to a resistor labeled R subscript ext. The amplifier is connected to a spectrum analyzer, specifically a Keysight N9010B, through a device under test labeled DUT. The setup includes a GPSSS connection. On the right, a detailed view of the imaging pixel chip is shown, labeled OSC plus SRR plus Detector. The chip has dimensions of 170 micrometers by 500 micrometers, with intricate circuit patterns and components visible. The setup is designed for evaluating the performance of the imaging pixel, focusing on the detector′s responsivity and noise characteristics.
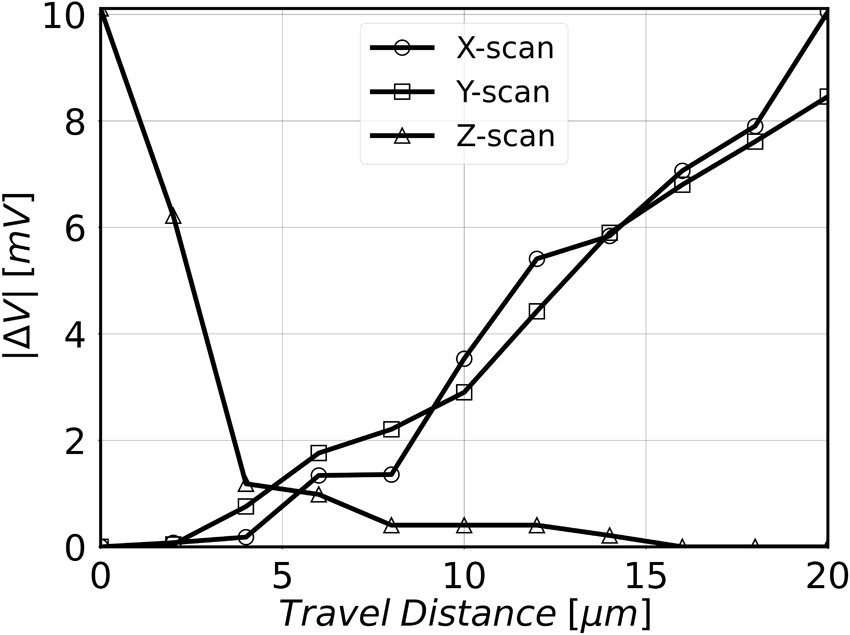
The lateral resolution of a single pixel is defined as the spatial distance over which the sensor response transitions from 10% to 90% of its maximum value [Reference Hillger, Jain, Grzyb, Förster, Heinemann, MacGrogan, Mounaix, Zimmer and Pfeiffer40]. To experimentally characterize this metric, a metallic needle with a tip diameter of approximately 7  $\unicode{x03BC}$m was positioned above the sensing area and displaced in steps of 1
 $\unicode{x03BC}$m using a three-dimensional piezo translation stage providing a travel range of 20
 $\unicode{x03BC}$m along each axis (Figure 17). When the metallic needle was placed directly above the SRR, a peak voltage response of approximately 10 mV was observed. The vertical (Z-axis) characterization reveals an effective sensing range of approximately 4
 $\unicode{x03BC}$m, within which the voltage response decreases nearly linearly with increasing distance, corresponding to a sensitivity of about 2 mV/
 $\unicode{x03BC}$m. The effective sensing distance is determined by the exponential decay of the evanescent near field generated by the SRR. As a result, the interaction between the resonator and the MUT is confined to only a few micrometers above the chip surface. This strongly confined sensing region enables surface-sensitive dielectric characterization and supports high-resolution imaging of micrometer-scale structures. Lateral scans along the X- and Y-directions yield measured resolutions of 13 and 15
 $\unicode{x03BC}$m, respectively, based on the 10–90% criterion. These values correspond to a normalized resolution of approximately
 $\lambda/75$ at the operating frequency.
Measured voltage response versus X-, Y-, and Z-axis displacement, obtained using a 3-D piezo translation stage to scan a metallic needle (tip diameter  $\approx 7~\unicode{x03BC}$m) over a range of 20
 $\unicode{x03BC}$m.

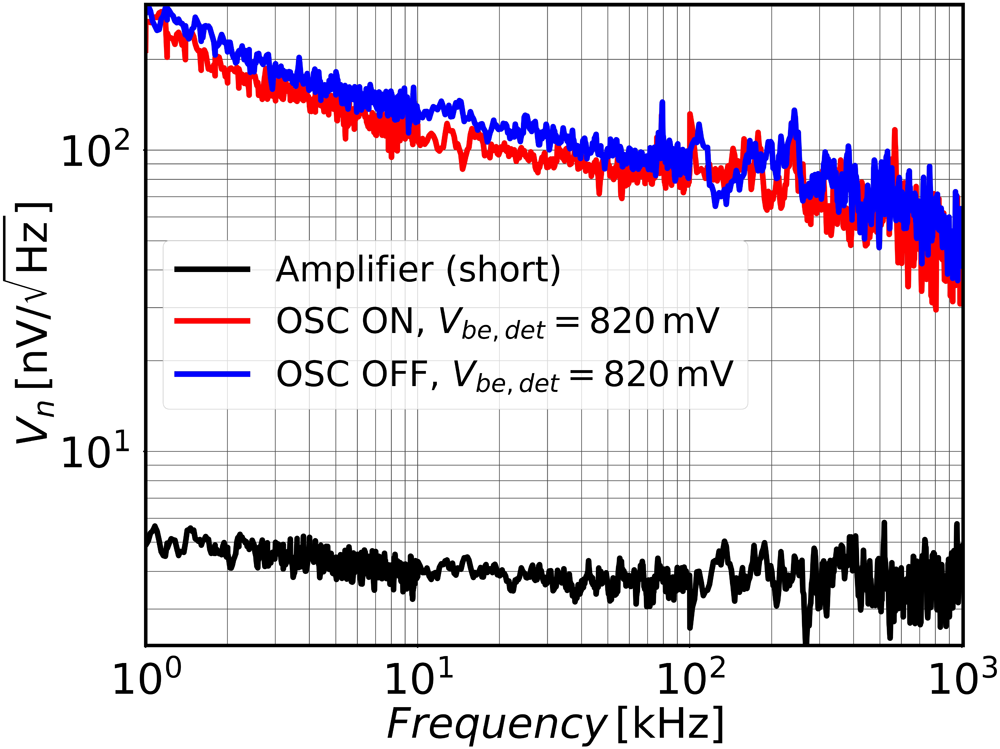
To characterize the noise behavior, the Femto amplifier with a gain of 40 dB was used. The amplifier exhibits a measured input-referred noise floor of 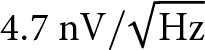 $4.7~\mathrm{nV}/\sqrt{\mathrm{Hz}}$ when its input is shorted. The output voltage noise of the detector was measured under two operating conditions: with the oscillator switched off and with the oscillator active. This comparison allows the identification of potential second-order effects, such as phase-noise-to-amplitude-noise (PM–AM) conversion in the oscillator or down-conversion of RF noise in the power detector, which could degrade the achievable signal-to-noise ratio. The measured results, shown in Figure 18, indicate that the output-referred noise remains essentially unchanged between the two configurations and exhibits a spot noise of approximately
 $V_n = 80~\mathrm{nV}/\sqrt{\mathrm{Hz}}$ around 100 kHz. This observation confirms that no significant broadband noise is down-converted by the detector. The roll-off observed at higher frequencies is attributed to the limited bandwidth of the measurement chain at the detector output. The analog dynamic range
 $DR_{\mathrm{analog}}$ is evaluated following the methodology in [Reference Hillger, Jain, Grzyb, Förster, Heinemann, MacGrogan, Mounaix, Zimmer and Pfeiffer40] as the ratio between the maximum DC output voltage (measured with the metallic tip positioned directly above the resonator) and the spot noise at 100 kHz, resulting in an estimated dynamic range of approximately 102 dB. Furthermore, based on the power measurements in Figure 13 and detector co-simulation results, the voltage responsivity is estimated to be
 $R_v \approx 4.2~\mathrm{kV/W}$, yielding a corresponding NEP of approximately
 $19~\mathrm{pW}/\sqrt{\mathrm{Hz}}$ at 100 kHz.
Measured voltage noise at the detector collector node for 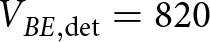 $V_{BE,\mathrm{det}}=820$ mV and a collector bias of 1.2 V with an external load resistor
 $R_{\mathrm{ext}}$. The noise spectrum was characterized from 1 kHz to 1 MHz. The plot also includes the noise floor of the measurement amplifier.

Near-field imager: multipixel architecture
Circuit description
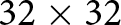
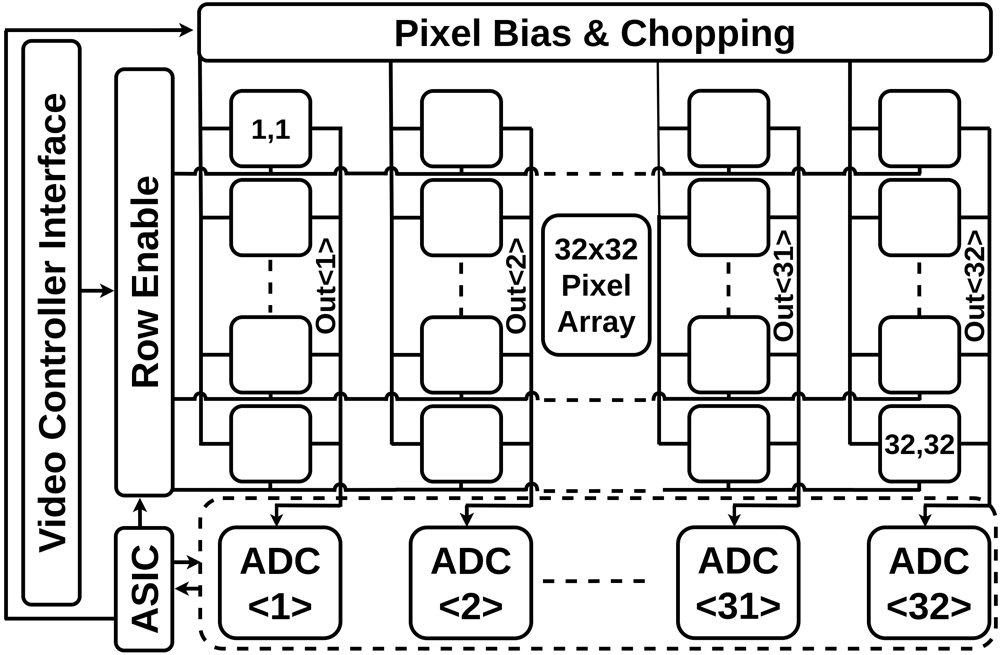
A simplified block diagram of the monolithic sensor array is shown in Figure 19. The array consists of 1024 pixels arranged in a 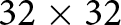 $32 \times 32$ configuration. The lateral pixel pitch is
 $100~\unicode{x03BC}$m in the horizontal direction and
 $50~\unicode{x03BC}$m in the vertical direction, defined as the center-to-center spacing between sensing strips of neighboring pixels. The rectified DC output of each pixel is processed on chip and routed through a column-based readout architecture.
Block diagram of the monolithic near-field sensor array comprising 1024 pixels arranged in a 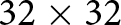 $32 \times 32$ architecture. The diagram highlights the mixed-signal implementation integrating analog pixel front-ends with digital readout and control circuitry.

Figure 19 Long description
The block diagram illustrates a pixel array system integrated with a video controller interface and analog-to-digital converters, labeled as ADC. At the top, the section labeled ′Pixel Bias and Chopping′ contains a grid of interconnected blocks representing the pixel array. The central block is labeled ′32 by 32 Pixel Array,′ indicating the configuration of the pixels. Surrounding this central block are smaller blocks labeled with coordinates such as ′1,1′ and ′32,32,′ representing specific pixel positions within the array. To the left, the ′Video Controller Interface′ is connected to the pixel array, with a label ′Row Enable′ indicating control over the pixel rows. Below the pixel array, four ADC blocks are labeled ′ADC number 1,′ ′ADC number 2,′ ′ADC number 31,′ and ′ADC number 32,′ showing the conversion of analog signals from the pixel array into digital form. The connections between the pixel array and the ADCs are depicted with dashed lines, indicating the flow of data. The ′ASIC′ block is positioned at the bottom left, connected to the video controller interface, suggesting integration with the system′s processing unit.
Each column incorporates a dedicated mixed-signal readout chain featuring an analog-to-digital conversion stage that translates the detector output voltage into a corresponding frequency signal of approximately 20 MHz. This signal is digitally counted to generate a 14-bit signed value per pixel. The digitized data are transmitted to an embedded application-specific integrated circuit (ASIC), which handles pixel addressing, clock generation, and register configuration via a serial peripheral interface (SPI). To mitigate low-frequency noise and reduce power consumption, the design implements programmable electrical chopping of the illumination sources using 1.2-V CMOS-controlled pull-down logic. During each chopping period, alternating columns are activated, while digital row selection enables or disables the corresponding detectors. This scheme results in a rolling-shutter mode of operation with multiplexed row and column access. The sensor supports frame rates of up to 40 frames/s, enabling real-time near-field imaging. Due to fabrication tolerances of the oscillator, resonator, and detector circuits, the raw array output exhibits pixel-to-pixel variation prior to calibration. To enable quantitative imaging, a pixel-wise two-point calibration procedure is applied to compensate fixed-pattern offsets and equalize the sensitivity of the individual pixels. In practice, slow temperature-dependent drifts of the sensing chain are compensated through the calibration procedure used during permittivity extraction.
The fabricated system-on-chip (SoC), shown in Figure 20, occupies an area of  $3.9 \times 2.4~\text{mm}^2$. The chip is packaged on a standard FR4 printed circuit board (PCB) and interfaced with an external display for real-time visualization of the measurement results.
Chip micrograph of the fabricated near-field sensor system-on-chip (SoC), showing the implemented circuitry and the pad frame for external bonding.

Figure 20 Long description
The micrograph displays a near-field sensor system-on-chip with a rectangular layout measuring 3.9 millimeters by 2.4 millimeters. At the center, a highlighted area measures 100 micrometers by 50 micrometers, surrounded by a grid-like pattern. The top of the chip features a series of small, evenly spaced squares forming a pad frame for external bonding. Below this, three distinct sections are labeled: ′Shared Load′ in green, ′Digital ASIC′ in red and ′Readout′ in blue. These sections are connected by lines indicating their roles in the circuitry. The ′Shared Load′ section is positioned on the left, the ′Digital ASIC′ in the center and the ′Readout′ on the right. The chip is designed for integration on a printed circuit board, facilitating real-time visualization of measurement results.
Measurement results
The surface temperature of the near-field imager under nominal operating conditions is shown in Figure 21(a). With all 1024 pixels enabled, the maximum measured temperature at the chip location is approximately 35.4  $^\circ$C, which remains moderate for a highly integrated circuit of this scale and power density. With all pixels active, the SoC consumes a total power of 280 mW, corresponding to 273
 $\unicode{x03BC}$W per pixel. This power level does not require external cooling, which simplifies system packaging and facilitates integration into compact and handheld form factors. A key contributor to the moderate surface temperature is the applied chopping scheme of the pixel oscillators, in which each oscillator is active only during half of the integration period, thereby reducing the average power dissipation. Owing to the limited temperature increase, the system becomes suitable for conducting preliminary biological experiments in which liquids or tissue samples can be placed directly on the chip surface without inducing excessive thermal stress. This enables direct-contact measurements under realistic experimental conditions and represents an important practical advantage for future biomedical investigations using the proposed near-field imager.
(a) Surface temperature of the near-field imager with all 1024 pixels operating simultaneously, captured using a thermal camera. (b) Real-time monitoring of isopropanol evaporation: the solution was applied to the chip surface and its evaporation was tracked over 9 s.

Figure 21 Long description
Two scientific heatmap plots are shown side by side, labeled a and b. Plot a is a 2D spatial thermal heatmap of a near-field imager chip surface captured using a thermal camera, with all 1024 pixels active simultaneously. There are no standard x or y axes. A vertical color scale is present, labeled in degrees Celsius, ranging from 21.5 at the lower end to 37.1 at the upper end. The hottest region is located at the center of the chip, marked by a crosshair, with a peak temperature reading of 35.4 degrees Celsius. The surrounding area shows progressively lower temperatures toward the edges, reaching approximately 21.5 degrees Celsius at the periphery. The text Spot, 35.4, degrees Celsius and FOV are visible as overlay labels on the thermal image. Plot b is a 2D spatial time-lapse heatmap consisting of nine individual tiles, each representing a single time point. The tiles are labeled t equals 0 seconds, t equals 1 second, t equals 2 seconds, t equals 3 seconds, t equals 4 seconds, t equals 5 seconds, t equals 6 seconds, t equals 7 seconds and t equals 8 seconds. There are no standard x or y axes. A vertical color scale is present, labeled Normalized Pixel Value, ranging from 0.0 at the lower end to 1.0 at the upper end. At t equals 0 seconds, a large high-intensity region is visible across a substantial portion of the tile, indicating strong normalized pixel response corresponding to the applied solution. Across successive frames from t equals 1 second through t equals 8 seconds, the high-intensity region visibly reduces in spatial extent and intensity. By t equals 8 seconds, the high-intensity area is markedly diminished compared to the initial frame, reflecting progressive reduction in coverage over the 8-second duration.
The dynamic imaging capability of the proposed near-field imager is demonstrated in Figure 21(b) using isopropanol as a representative MUT. The image contrast originates from spatial variations in the effective dielectric permittivity at the sensor surface, which directly modulate the local pixel response. Isopropanol was applied directly onto the chip surface, resulting in a temporally varying dielectric environment due to evaporation.
At  $t = 0$ s, the sensor surface is dry and the recorded pixel values exhibit a uniformly low baseline response. After application of isopropanol, full surface coverage is achieved at approximately
 $t = 1$ s, leading to a pronounced increase in pixel values across the array. As evaporation progresses, spatially nonuniform drying occurs, producing a gradual reduction in pixel response that is clearly observable in the subsequent frames (
 $t = 2$–
 $7$ s). Regions that have already dried revert toward their initial baseline values, while remaining wet areas continue to exhibit elevated response. By
 $t = 8$ s, the isopropanol has fully evaporated and the pixel values return to their original distribution observed at
 $t = 0$ s.
These measurements demonstrate the capability of the system to monitor temporally evolving permittivity distributions in real time. The ability to track dynamic changes directly on the chip surface highlights the suitability of the proposed architecture for applications involving time-resolved material characterization and, more broadly, for sensing scenarios in which transient dielectric phenomena are of interest.
Conclusion
This paper presents a 32 $\times$32 pixel near-field imaging sensor implemented in a 130-nm SiGe BiCMOS technology and investigates the feasibility of vertically integrating all imaging components within a single pixel to enable true monolithic two-dimensional array integration. By stacking the illumination source, sensing element, and detector within the BEOL, the proposed architecture achieves an unprecedented pixel density of 200 pixels/mm
 $^2$ for silicon-integrated THz near-field sensors, as summarized in Table 1. This architectural approach is shown to be a key enabler for scalable high-density integration, overcoming the footprint limitations that have constrained prior 1-D and 2-D implementations. The resulting system supports high-resolution permittivity-based imaging with a lateral resolution of 13
 $\unicode{x03BC}$m and real-time operation at frame rates of up to 40 fps, demonstrating the suitability of the proposed vertically integrated architecture for practical monolithic THz near-field imagers.
Comparison of state-of-the-art terahertz super-resolution imaging devices

Table 1 Long description
Comparison of terahertz super resolution imaging devices by process technology, minimum resolution in micrometers, operating frequency range in gigahertz, sensor type, per pixel direct current power, pixel count, and maximum pixel density. The 130 nm SiGe fully integrated 32 by 32 array operates at 307 to 335 GHz, reports 13 micrometer minimum resolution, 0.273 milliwatts per pixel, and the highest pixel density at 200 pixels per square millimeter. Earlier 130 nm SiGe single pixel detector or detector source entries span 40 to 562 GHz, list minimum resolutions of 7 to 10 micrometers when provided, and have low pixel density from 0.2 to 7 pixels per square millimeter. Fully integrated CMOS examples include a 65 nm CMOS 16 by 12 array at 120 GHz with pixel density 119, and a 28 nm CMOS 10 by 20 array at 199 to 219 GHz with per pixel power 0.395 milliwatts and pixel density 48. A 130 nm SiGe fully integrated 2 by 64 array at 534 to 562 GHz reports 10 micrometer minimum resolution, 0.61 milliwatts per pixel, and pixel density 12. Pixel density generally increases with larger arrays and fully integrated designs, while minimum resolution values are not reported for some entries, limiting direct resolution comparisons across all devices.
a Highest reported pixel density per  $\mathrm{mm^2}$ on silicon in the THz range.
Funding statement
This work was supported by the German Research Foundation (DFG) within the framework of the Reinhart Koselleck project, by the ESSENCE program under Grant SPP 1857, and by the Ministry of Culture and Science of the State of North Rhine-Westphalia through the project terahertz.NRW under Grant NW21-068B.
Competing interests
None declared.

Hamadi Sadkaoui was born in Bizerta, Tunisia. He received his B.Sc. and M.Sc. degrees in Electrical Engineering from the University of Wuppertal, Germany, in 2019 and 2022, respectively. Since 2022, he has been pursuing his Ph.D. with the Institute for High-Frequency and Communication Technology (IHCT) at the University of Wuppertal. His major research interests include the design and characterization of silicon-based millimeter-wave and terahertz systems for imaging and sensing. He is a recipient of the EuMIC Best Paper Prize 2025, awarded in Utrecht, Netherlands.

Philipp Hillger received the M.Sc. degree in electrical engineering (micro- and nanoelectronics) from Ruhr-University Bochum, Bochum, Germany, in 2014, and the Ph.D. degree from the University of Wuppertal, Wuppertal, Germany, in 2020. Since 2014, he has been a Staff Member of the Institute for High-Frequency and Communication Technology (IHCT), Wuppertal. His current research interests include silicon-based millimeter-wave and terahertz integrated electronics for imaging, sensing, and communications. Dr. Hillger received the 2021 Doctoral Award of the VDE (Association for Electrical, Electronic and Information Technologies) North Rhine-Westphalia and was a co-recipient of the 2018 Jan Van Vessem Award at the IEEE International Solid-State Circuit Conference.

Janusz Grzyb received the M.Sc. degree (cum laude) in electronic engineering from the Integrated Circuits Laboratory, Gdansk University of Technology, Gdansk, Poland, in 1998, and the Ph.D. degree from the Swiss Federal Institute of Technology, Zurich, Switzerland, in 2004. From 2004 to 2006, he was with the Communication System Design and High-Speed/Optical Packaging Groups, IBM T. J. Watson Research Center, Yorktown Heights, NY, USA. From 2006 to 2009, he was with the Research and Development Group, Huber&Suhner, Pfaffikon ZH, Switzerland. From 2009 to 2024, he was with the Institute for High-Frequency and Communication Technology, University of Wuppertal, Wuppertal, Germany. His research interests include all aspects of silicon-integrated THz electronics.

Xinpeng Du received the B.Sc. degree in microelectronics science and engineering from Xidian University, Xi’an, China, in 2018, and the Dipl.-Ing. in electrical engineering in the branch of microelectronics from Technical University of Dresden (TUD), Dresden, Germany, in 2023. He is currently pursuing the Ph.D. degree with the Institute for High-Frequency and Communication Technology, University of Wuppertal, Wuppertal, Germany. His main research interest is terahertz integrated circuit and system design in silicon technologies. He is a co-recipient of the 2025 European Microwave Integrated Circuits Conference (EuMIC) Best Paper Prize.

Marcel Andree received the M.Sc. degree and Ph.D. degree (passed with honors) in electrical engineering from the University of Wuppertal, Wuppertal, Germany, in 2017 and 2023, respectively, where he focused on the development and optimization of integrated mixed-signal circuits and silicon-integrated circuits for THz imaging applications. Since 2017, he has been a Research Staff Member with the Institute for High-Frequency and Communication Technology (IHCT), Wuppertal. Currently, he is a Postdoctoral Researcher and Group Leader for integrated circuit design at the University of Wuppertal. His research interests include terahertz integrated circuit and system design in silicon technologies. He is a co-recipient of the 2025 European Microwave Integrated Circuits Conference (EuMIC) Best Paper Prize.

Holger Ruecker received the Diploma and Doctorate degrees in physics from the Humboldt University of Berlin, Berlin, Germany, in 1986 and 1988, respectively. From 1989 to 1991, he was a Staff Member with the Humboldt University of Berlin. From 1991 to 1992, he was with the Max Planck Institute for Solid State Research, Stuttgart, Germany. In 1992, he joined IHP, Frankfurt (Oder), Germany, where he is engaged in research on the physics and fabrication of semiconductor devices. He has also led the development of IHP’s 130-nm SiGe BiCMOS technologies SG13S, SG13G2, and SG13G3. His research interests include SiGe bipolar devices, the development of CMOS and BiCMOS technologies, and their application in radio-frequency integrated circuits.

Ullrich R. Pfeiffer received the diploma degree and Ph.D. degree in physics from the University of Heidelberg, Heidelberg, Germany, in 1996 and 1999, respectively. In 1997, he worked as a Research Fellow with the Rutherford Appleton Laboratory, Oxfordshire, England. From 1999 to 2001, he worked as a Postdoctoral Researcher with the University of Heidelberg and with the European Organization for Nuclear Research (CERN), Geneva, Switzerland. From 2001 to 2006, he was with the IBM T.J. Watson Research Center, Yorktown Heights, NY, USA. Since 2008, he has been holding the High-Frequency and Communication Technology chair at the University of Wuppertal, Wuppertal, Germany. His current research interests include silicon RFICs for mmWave/THz communications, radar, and imaging systems.


















 Open access

