Introduction
A major development in educational research has been the widespread implementation of the international studies of pupil achievement, PISA (Programme for International Student Assessment, www.oecd.org/pisa), TIMSS (Trends in International Mathematics and Science Study, http://timss.bc.edu/) and PIRLS (Progress in International Reading Literacy Study, http://timss.bc.edu/). Each has the aim of producing cross-nationally comparable information on children's abilities at a particular age in at least one of three areas (reading, maths and science) and is widely cited by academics and policymakers. Another goal of these studies is to monitor how countries are performing relative to one another (in terms of educational achievement of school pupils) over time. An example is a recent report published by the Organisation for Economic Co-operation and Development (OECD, 2010a), which used information from the four waves of PISA to investigate how test scores have changed across countries since 2000. In this paper, I provide a similar case study for one country, England, where the issue of change in performance in the international achievement tests has had a large impact upon public policy debate.
It is important to explain my motivation for focusing on England and why this has become such an important (and politically sensitive) issue. Firstly, change in test performance over time is a particularly topical subject in this country. Since 1988, fifteen- and sixteen-year old children in England have sat important national exams (the General Certificate of Secondary Education – or GCSEs). The percentage of children passing these exams has increased steadily year upon year. This has led to much debate as to whether there has been a genuine improvement in children's scholastic ability, or if these examinations have just become easier. A potential benefit of PISA, PIRLS and TIMSS is that they are conducted by external organisations without political interference or competitive pressure, and are thus unlikely to suffer from problems of such ‘grade inflation’.
Secondly, children who took part in the first PISA wave (2000) were born in 1984, and would thus have received most of their compulsory schooling during the years when the Conservative Party was in power (who held office between 1979 and 1997). The majority of the most recent (PISA 2009) cohort were, on the other hand, born in 1994, and so spent all their time in school under Labour (who governed between 1997 and 2010). Whether rightly or wrongly, many commentators have thus regarded change in England's PISA ranking since 2000 as an evaluation of the Labour government's educational policy success.
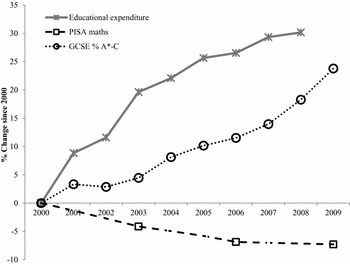
When the PISA 2009 results were released in December 2010, it was England's dramatic decline in performance that grabbed the domestic headlines. Figure 1 highlights why this happened. The solid grey line refers to change in real educational expenditure in England since 2000 with dashed lines referring to mean PISA maths test scores (author's calculations) over the same period. A dotted line is also included to illustrate the change in the proportion of children who obtained five or more A*–C grades in their GCSE exams including maths and English (the five A*–C threshold is often treated as the minimum target that children should attempt to meet). Figures refer to the percentage change since 2000. As one can see, spending on education rose by around 30 per cent over this period in real terms, and was accompanied by a large increase in the proportion of young people achieving five A*–C grades. Yet the PISA data contradict this pattern, suggesting that England's secondary school pupils’ average maths performance has been in relative decline.
Change in real educational expenditure and mean PISA maths test scores in England between 2000 and 2009
Notes: The solid line refers to the trend in educational expenditure since 2000, the dashed line represents the trend in children's PISA scores and the dotted line the proportion of children achieving at least five A*–C in their national (GCSE) exams. Data on educational expenditure are drawn from Department for Children, Schools and Families (2009) Table 8.5, page 177, third row down (labelled ‘current’). These figures refer to current expenditure on under 5, primary and secondary education and excludes administration costs. PISA test scores are the author's calculations based upon the PISA international database. GCSE scores are taken from http://www.education.gov.uk/rsgateway/DB/SFR/s001056/sfr02–2012.pdf, Table 1a

This has since become a widely cited ‘fact’ that has been used for both political benefit and to justify the need for policy change. The Daily Telegraph (a leading English newspaper) ran a commentary stating that (Young, Reference Young2010):
This is conclusive proof that Labour's claim to have improved Britain's schools during its period in office is utter nonsense. Spending on education increased by £30 billion under the last government, yet between 2000–09 British schoolchildren plummeted in the international league tables.
A sentiment echoed by the Secretary of State for Education (Michael Gove MP) in a recent parliamentary debate (Gove, Reference Gove2011):
I am surprised that the right hon. Gentleman has the brass neck to quote the PISA figures when they show that on his watch the standard of education which was offered to young people in this country declined relative to our international competitors. Literacy, down; numeracy, down; science, down: fail, fail, fail.
The Prime Minister (David Cameron MP) and his deputy (Nick Clegg MP) have also pointed to this fall in the international rankings as one of the main reasons why England's schooling system is in desperate need of change. For instance, they opened the 2010 Schools White Paper by stating (Department for Education, 2010):
The truth is, at the moment we are standing still while others race past. In the most recent OECD PISA survey in 2006 we fell from 4th in the world in the 2000 survey to 14th in science, 7th to 17th in literacy, and 8th to 24th in mathematics.
It would thus seem that the change in PISA test scores has had a major impact upon policymakers in England who are extremely concerned that educational achievement has fallen so much over such a short period of time.
But is it really true that the achievement of secondary school children has declined rapidly in England relative to other countries? As noted by Brown et al. (Reference Brown, Micklewright, Schnepf and Waldmann2007), PISA is just one study which has its merits, but also its defects. Do other international studies of secondary school children (such as TIMSS) paint a similarly depressing picture of England's lack of progress? And, if not, can the difference in results be explained?
This paper considers the robustness of the finding that secondary school children in England are rapidly losing ground relative to those in other countries. The analysis demonstrates that results from PISA and TIMSS do indeed conflict, with the latter suggesting that test scores in England have actually improved over roughly the same period. Yet the fact that these two surveys disagree with regard to change over time does not seem to be an experience that is shared (at least not to the same extent) by other countries. It is then shown how this may be due to difficulties with the PISA and TIMSS data for England, with a focus on issues such as alterations to the target population, survey procedures and problems with non-response. This leads to the following conclusions:
• Both PISA and TIMSS are problematic for studying change in average test performance in England over time.
• Statements such as those made by the policymakers cited above are based upon flawed interpretations of the underlying data.
• England's movement in the international achievement league tables neither supports nor refutes policymakers’ calls for change.
Although of obvious interest to domestic readers, this study has implications reaching well beyond British shores. Now that four PISA sweeps have been conducted, researchers and government officials from many countries are trying to identify the drivers of educational improvement and decline. It is thus noteworthy that one of the first papers to emerge on this topic using PISA (Hanushek et al., Reference Hanushek, Link and Woessmann2011) highlights England as an example where a reduction in school autonomy is related to falling pupil achievement. Clearly, limitations with the PISA data that I discuss here could jeopardise this result (and similar). This is further compounded by the fact that the data problems identified for England seem far from unique; I shall describe in the conclusion how similar issues seem to have arisen in at least one other OECD country (Ireland).
The paper proceeds as follows: the next section describes the PISA and TIMSS datasets, while the subsequent section provides estimates of change in test scores for England over the last decade. This is followed in by an explanation of the statistical limitations on which such estimates are based. Conclusions are then presented in the final section.
Data
Data are drawn from PISA and TIMSS. Both collect information on children's cognitive skills across countries and over time. The former is conducted by the OECD and examines fifteen-year olds in three subject areas (reading, maths and science). The latter is run by the International Association for the Evaluation of Educational Achievement (IEA), with children from two different school ‘grades’ (grades 4 and 8) being tested in science and maths. This paper focuses on the TIMSS data for the 8th grade (thirteen/fourteen year olds in ‘year 9’ of the English school system; see OECD, 2011; Olson et al., Reference Olson, Martin and Mullis2008, for further information).
Both studies have reasonably similar sample designs. Schools are initially stratified by region, gender intake, average GCSE performance and maintained/independent status. They are then selected to take part in the study (as the primary sampling unit) via a method of systematic random sampling, with probability proportional to size. Pupils within these schools are chosen to participate. In TIMSS, one or two classes are randomly selected, with all pupils within this class being tested. PISA randomly draws thirty-five pupils from within each of the sampled schools. Both studies are thus designed to be representative of the English population of schools and pupils (this holds true for each wave). To limit non-response, both PISA and TIMSS use ‘replacement schools’; if a school declines to take part, a replacement that is similar in terms of observable characteristics is asked to take its place (there is some controversy over this in the survey methodology literature − see Sturgis et al., Reference Sturgis, Smith and Hughes2006). Survey weights are also produced in both PISA and TIMSS which attempt to correct for non-response, while also scaling the sample up to the size of the national population. These weights are applied throughout the analysis.
Although the two studies overlap in terms of broad subject areas, there are conceptual differences in the skills they attempt to measure. Whereas TIMSS focuses on children's ability to meet an internationally agreed curriculum, PISA examines functional ability – how well young people can use skills in ‘real life’ situations. The format of the test items also varies, including the extent to which they rely on multiple choice questions. Yet despite these differences, the two surveys summarise children's achievement in similar ways. Specifically, five ‘plausible values’ are created for each child in each subject area. The intuition is that children's true ability cannot be observed, and must be estimated from their answers on the test. This is done via an item-response model, although the studies do differ in their specific application of this technique (PISA uses a one parameter model while TIMSS uses a three parameter model). Brown et al. (Reference Brown, Micklewright, Schnepf and Waldmann2007) provide further discussion. This results in a measure of children's achievement that (in both studies) has a mean of 500 and standard deviation of 100. However, even though the two surveys appear (at face value) to share the same scale, figures are not directly comparable (e.g. a mean score of 500 in PISA is not the same as a mean score of 500 in TIMSS). This is because the two surveys contain a different pool of countries upon which these achievement scores are based. They also calibrate the achievement scores using different definitions of the population and a different array of items. Hence one is not able to directly compare results in these two surveys (and change over time) by simply using the raw PISA and TIMSS test scales. A method for overcoming this problem is described at the end of this section.
Before doing so, I turn to some of the more specific details regarding the two surveys. The PISA study has been conducted four times (2000, 2003, 2006 and 2009), with all OECD countries taking part in every survey wave. The total number of countries in PISA has, however, risen from just over forty in 2000 to sixty-five in 2009. Thus one of the reasons why England has ‘plummeted’ down the international rankings is because more countries are now included (i.e. it is easier to come tenth in a league of forty than it is in a league of sixty-five).Footnote 1 Although children were assessed in three areas in each PISA wave, only one of these was the main focus every time the survey was conducted (the so-called ‘major domain’). In 2000 and 2009, this was reading; in 2003, maths; and 2006, science. So, for instance, the inaugural study in 2000 contained around 140 items measuring children's reading skills (major domain) compared to only around thirty-five in each of science and maths (minor domains).
The TIMSS 8th grade study has been conducted four times (1995, 1999, 2003 and 2007), with mathematics and science skills examined using approximately the same number of questions (there is, in other words, no issue of ‘minor’ and ‘major’ domains). In contrast with PISA, not all of the OECD countries take part. In fact, one of the difficulties with the TIMSS data for my purposes is that a number of countries have chosen to take part in only specific survey years (e.g. data may be available in 2007, but not in, say, 1999), limiting the pool that have the relevant information available. Focus is therefore restricted to ten countries that have taken part in each of the three TIMSS (1999, 2003 and 2007) and four PISA (2000, 2003, 2006 and 2009) studies conducted since 1999. This includes four from the rich Western world (Australia, England, Italy, US), a number of Asian ‘tiger’ economies in whom policymakers have shown particular interest (Hong Kong, Japan, South Korea) and three with lower levels of development (Hungary, Indonesia, Russia). Additional results will occasionally be presented where I will loosen this strict inclusion criteria and add six further countries into the analysis, including two from Scandinavia (Norway and Sweden), three from Europe (Czech Republic, Netherlands, Scotland) and one more rich industrialised nation from the southern hemisphere (New Zealand). The general conclusions remain largely unchanged.
Next I turn to the issue of comparability of test measures over time. Although this is a central aim of PISA, some technical details do not make this as straightforward as it first seems. In particular, the scales were only fully developed the first time a subject became a ‘major domain’. The survey organisers therefore advise that only reading scores are actually fully comparable across all four waves, with maths becoming fully comparable from 2003 and science from 2006 (OECD, 2010a: 26). As can be seen from the quotes presented in the previous section, however, it is clear that this is not always how the data are being used. At least in the case of England, policymakers almost always discuss change relative to performance in 2000 for all the PISA subjects.
Unfortunately, reading is not examined as part of the TIMSS study. One can therefore only compare PISA and TIMSS using either science or maths. This paper focuses on the latter as the PISA data for this subject are technically comparable over a longer period of time. All results are, however, robust to this choice, with conclusions largely unchanged if a different PISA or TIMSS subject area or base year is used instead.
Finally, I return to the fact that PISA and TIMSS are based on a different selection of countries, meaning their test scores are not directly comparable. To overcome this problem, all data are transformed (within each survey and each wave) into international z-scores. That is, each country's mean test score (for each wave of the survey) is adjusted by subtracting the mean score achieved amongst all children in the ten countries for that particular year and dividing by the standard deviation. This is a standard method for obtaining comparable units of measurement for variables that are on different scales and was the approach taken by Brown et al. (Reference Brown, Micklewright, Schnepf and Waldmann2007) in their comparison of the PISA and TIMSS datasets. One implication of this is that estimates refer to English pupils’ test performance relative to that of children in the other nine countries. Terms like ‘relative decline’ shall therefore be used as international z-scores are comparative measures.
The change in England's maths test performance
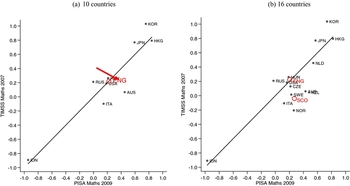
The focus of this section is the change in England's maths test performance over the past decade. Yet it is important to first of all consider the cross-sectional picture from TIMSS 2007 and PISA 2009. Do these studies agree on how England's mean test performance currently compares? Estimates are presented in terms of international z-scores and can be found in Figure 2 (panel A is for the ten country comparison, panel B for the sixteen country comparison). The x-axis refers to PISA 2009 and the y-axis to TIMSS 2007.
A comparison of mean maths test scores in TIMSS 2007 and PISA 2009
Notes: Figures are presented in terms of international z-scores, with the data having been standardised within the sub-set of the ten countries considered. PISA 2009 maths test scores sit on the x-axis, while TIMSS 2007 scores run along the y-axis. The solid 45 degree line represents where mean test scores in PISA are the same as those for TIMSS.

There seems to be broad agreement between the two surveys. Both identify Japan, Hong Kong, Korea and (to a certain extent) the Netherlands as high maths test performers while Indonesia is at the other end of the scale. The other countries (including England) are bunched somewhere in-between, with exact positions within this sub-group slightly less clear. The correlation between estimates is nevertheless high (r = 0.93 including Indonesia and 0.83 without in panel A), with England sitting almost exactly on the 45 degree line. In analysis not presented (for brevity) similar results held for selected points of the test distribution (e.g. the 25th and 75th percentile). It therefore seems that the latest PISA and TIMSS survey waves provide a reasonably consistent picture of where England currently stands within this group of countries.
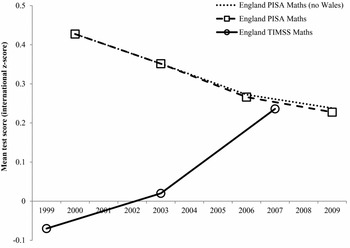
What the two studies disagree on, however, is how the average performance of English pupils has changed over time. This is clearly illustrated in Figure 3, where the average test score for England (in terms of international z-scores) is plotted for each survey wave since 1999 (TIMSS – solid black line) or 2000 (PISA – dashed black line). Within this fixed pool of ten countries, PISA test scores have declined over this period (from a z-score of over 0.40 in 2000 to one of around 0.20 in 2009). Yet, in the TIMSS data, the exact opposite holds true (the average z-score has increased from below 0 in 1999 to just over 0.20 in 2007).
Change in PISA and TIMSS (8th grade) maths test scores over time
Notes: The black dashed line refers to PISA maths test scores for England between 2000 and 2009. The dotted line refers to when one excludes children in Welsh schools from PISA. The solid line, on the other hand, refers to TIMSS maths scores between 1999 and 2007. Figures presented on the y-axis refer to the average test performance and are presented in terms of international z-scores.

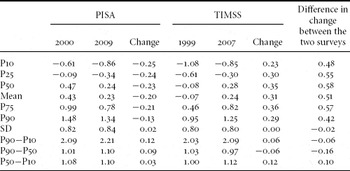
Further detail is provided in Table 1 where the distribution of test scores is presented for England from the 1999 and 2007 TIMSS and 2000 and 2009 PISA survey waves. This reveals whether the inconsistency between PISA and TIMSS is specific to one part of the test distribution (e.g. whether the inconsistency lies more in the bottom than in the top, or vice-versa). Recall that all figures refer to international z-scores.
Distribution of test scores for England in the PISA 2000 and 2009 and TIMSS 1999 and 2007 survey waves (international z-scores)

Notes: Figures are reported in terms of international z-scores.
At each of the 10th, 25th, 75th and 90th percentiles, the two surveys tell a conflicting story about England's maths performance over time – PISA suggests it is going down and TIMSS that is going up. It is, however, interesting to also consider the measures of spread in the bottom half of the table. The two surveys seem to agree that there has been little overall change in educational inequality between 2000 and 2009 as measured by either the standard deviation or difference between the 90th and 10th percentile (though they are consistent in suggesting a minor increase). Looking at the P90–P50 comparison, however, PISA suggests there has been some increase within the top half of the test distribution, while in TIMSS there is evidence of a decline. Both studies, on the other hand, agree that the gap between the 10th and 50th percentile has increased – although there is some conflict in the extent to which this has occurred. Consequently, there is some suggestion that PISA and TIMSS also disagree about how inequality in educational achievement may have changed over this period.
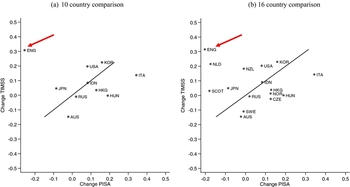
It is hence clear that these two major international studies conflict on how secondary school children's maths test scores have changed over time. What is perhaps even more intriguing, however, is that this inconsistency is not an experience shared by other countries. Evidence is presented in Figure 4, where the change in mean PISA maths test scores between 2000 and 2009 is plotted on the x-axis, with the change for mean TIMSS scores between 1999 and 2007 on the y-axis. The 45 degree line illustrates where results from the two studies ‘agree’ (i.e. where the estimated change in PISA is equal to that in TIMSS). Again, panel A refers to the ten country comparison and panel B the sixteen country comparison.
Change in PISA mean maths scores 2000–2009 compared to mean TIMSS maths scores 1999–2007
Notes: Figures on the x-axis refer to the change in mean PISA test scores between 2000 and 2009. TIMSS data from New Zealand and Netherlands refer to 1995−2003 comparison, while for Norway, Scotland and Sweden they refers to the 1995−2007 comparison. Those on the y-axis, on the other hand, refer to the change in TIMSS scores between 1999 and 2007. All figures presented are in terms of international z-scores. The solid black line represents where the change in PISA test scores over the period is the same as the change in TIMSS test scores.

One can see that most countries are scattered reasonably tightly around this line, with the change observed in TIMSS similar to that in PISA, typically differing by 0.10 of an international standard deviation or less. For Italy, it is slightly bigger at 0.2 of a standard deviation, though the two studies do agree on the direction of change (if not the exact magnitude). The Netherlands stands out in panel B, though this country suffered from chronic non-response in the TIMSS base year (77 per cent of first selected schools did not take part). England is, however, the most obvious outlier. The difference between the change observed in the PISA and TIMSS surveys is around half an international standard deviation – approximately five times greater than that seen in most other countries. This could just be a matter of sampling variation. To investigate this possibility, a two-sample t-test (assuming independent samples) has been conducted. The null hypothesis (that the change in mean test scores is the same across the two studies) cannot be rejected in eight of the ten countries considered in panel A. In Italy and England, I can reject this null at the 1 per cent level, although the t-statistic is almost half the size in the former (t = 3.0) than it is in the latter (t = 5.8). Sampling variation could, of course, still explain some of the difference between the two surveys. Yet it is also clear that other factors (e.g. possible non-sampling error) may be at play.
The comparability of the international achievement data for England over time
This section discusses three issues with regard to the comparability of the international achievement data for England across the survey waves: the target population, survey procedures and non-response. This list may not be exhaustive, but rather draws upon my research into the data and experience in their use.
Target population
There seems to have been at least two changes to the target population between the PISA 2000 and 2009 survey waves. The first is that in the 2000 wave the sample included just children from England and Northern Ireland. But, from 2003 onwards, it also included young people from Wales. This could be problematic as figures from the latest PISA study illustrate that Welsh pupils have significantly lower levels of achievement (Bradshaw et al., Reference Bradshaw, Ager, Burge and Wheater2010b, show that Welsh pupils scored an average of 472 on the PISA 2009 maths test compared to 492 for those from England). The fact that Welsh schools did not take part in the PISA 2000 study hence means that the average PISA maths test score for ‘England’ in that year is likely to be higher than in the other survey waves (as, essentially, a low achieving group has not taken part in the 2000 study). This, in turn, means that there is also potential overestimation of change over time. How much impact does this have on the substantive finding that PISA test scores for England have declined? This is shown via the dotted line in Figure 3, where the PISA trend since 2000 has been re-estimated having excluded Welsh schools from the 2003, 2006 and 2009 analysis (and thus restricting focus to England only). Clearly the impact is minimal, with the pronounced decline in test scores remaining.
The second change is that the PISA data for England have been altered from an age-based sample in 2000 and 2003 to what is (for all intents and purposes) a grade-based sample in 2006 and 2009. In other words, students in the older PISA cohorts were all born in the same calendar year (1984 in the case of PISA 2000 and 1987 in the case of PISA 2003), with roughly two-thirds of children in ‘year 11’ and one third in ‘year 10’. On the other hand, almost all the children who sat the PISA test in 2006/2009 all belonged to the same academic year (i.e. almost all the PISA 2009 participants were year 11 students born between September 1993 and August 1994). Moreover, my exploration of the data suggests that this is something that did not occur in other countries (i.e. it is a specific change made to the PISA study in England) and has not been explicitly documented in either the national or international report. Despite thorough investigation, I have found little evidence of similar problems with the TIMSS 8th grade data (which focused on year 9 pupils within England only in each of the 1999, 2003 and 2007 survey waves).
What impact does this have on my results? To provide some indicative evidence on this issue, mean test scores for England are re-calculated having restricted the sample to year 11 pupils who are born between January and August in all four survey waves. This leads to a slight increase in scores for the two earliest rounds of the survey (the mean international z-score for England increases from 0.43 to 0.47 in 2000 and from 0.35 to 0.39 in 2003) and a slight decrease in the later rounds (the mean z-score for England drops from 0.27 to 0.26 in 2006 and from 0.23 to 0.22 in 2009). In other words, the decline in England's PISA test scores over time may have been underestimated because of this issue. However, caution is required when interpreting this result as other changes have been made to the conduct of the PISA study over the same period. These are detailed in the following sub-section.
Survey procedures
Whereas the first two PISA waves for England were conducted by the UK national statistics agency (the Office for National Statistics), the 2006 and 2009 studies were contracted-out to an external provider (the National Foundation for Educational Research). This seems to have been accompanied by some changes to the survey procedures. Perhaps the most important is that the month when children sat the PISA test moved from between March and May (in PISA 2000/2003) to roughly five months earlier (November/December) in PISA 2006/2009. England had special dispensation to make this change (i.e. this is not something that occurred in other countries), and, although this was for good reason (the PISA 2000 and 2003 studies clashed with preparation for national exams and so was a significant burden on schools), it may have had unintended consequences. The TIMSS tests also seem to have been moved slightly earlier in the school year (from June/July in 2003 to May/June in 2007), though this is obviously a fairly minor adjustment compared to PISA.Footnote 2
How might this influence the trend in England's PISA test scores? Firstly, it is important to understand that between November/December and March–May of year 11 is likely to be a period when children add substantially to their knowledge of the PISA subjects as it is when pupils are working towards important national exams. Consequently, one should expect the year 11 pupils in the PISA 2000/2003 cohort to out-perform their peers taking the test in 2006/2009 due to the extra five months they have had at school. To provide an analogy, imagine that one group of children took a mock GCSE maths exam in November, and another group the following April; clearly one would expect the former to obtain lower marks (on average) than the latter. This would in turn suggest an overestimation of the decline in PISA maths scores over time. Putting a figure on the size of this potential bias is not easy, although it has been widely cited that one additional school year is equivalent to roughly 40 PISA test points (0.4 of an international standard deviation). See OECD (2010b: 110) for further details. This would imply that year 11 children who sat the PISA test in 2000 might be expected to outperform the 2009 cohort by roughly 15 PISA test points (0.15 of an international standard deviation) due to their additional five months at school.
Non-response
It has been widely recognised that non-response is a problem for England in the international achievement datasets, although discussion of this issue has mainly focused upon PISA (OECD, 2010a; Micklewright et al., Reference Micklewright, Schnepf and Skinner2010; Micklewright and Schnepf, Reference Micklewright and Schnepf2006). In fact, this was the reason given by the OECD for excluding England from a recent report on changes in PISA test scores over time. Specifically, they state that:
The PISA 2000 and 2003 samples for the United Kingdom did not reach response-rate standards, so data from the United Kingdom are not comparable to other countries. (OECD, 2010a: 26)
Interestingly, however, they add a footnote saying that (with regard to the 2000 data):
the PISA consortium concluded that response bias was likely negligible.
(OECD, 2010a: 30, note 3)
Based on this conclusion (that response bias was negligible), England was included in the PISA 2000 report. This would seem to suggest that missing data in PISA should not substantially bias any comparison of England's performance in 2000 with that in 2009.
Yet other studies suggest that this may not be such a trivial issue. Micklewright et al. (2012) used English children's administrative records (including information on their national exam scores) to investigate non-response bias in PISA 2000 and 2003. Specifically, the authors create a set of response weights based upon this rich auxiliary information, allowing the authors to make a better correction for non-response bias than is possible with the weights supplied in the international database. They concluded that the average maths test score for England in the 2000 wave was upwardly biased by somewhere between 4 and 15 points (page 931, Table 8), with their preferred estimates towards the top of this scale. For the PISA 2003 wave, they report an upward bias of between 7 and 8 test points (Micklewright et al., 2012: 931, Table 8). Assuming that this problem was confined to the PISA 2000 and 2003 studies (i.e. non-response had a negligible impact on the average test score for England in 2006 and 2009), then this by itself could explain a large part of the decline seen in England's PISA test scores over the past decade.
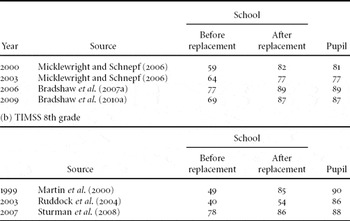
This is, however, of only limited use to address the issue at hand. To better understand change over time, one ideally needs to know (a) how the bias for England has changed between each of the four PISA survey waves and (b) if there is similar bias in TIMSS. Unfortunately, there has been little work addressing these issues. It is possible, however, to investigate how the response rate has changed over time. Improving (or higher) response rates does not, of course, mean that there will necessarily be less bias, but nevertheless provides some guidance on this issue. Details are provided in Table 2 below.
School and pupil response rates in the PISA and TIMSS datasets

Notes: Figures refer to percentage of schools/children who agree to take part in the study. After replacement refers to total percentage of schools who agree to take part after first and second replacements have been included.
There is some evidence of improving response rates in PISA over time. This has, however, been reasonably modest, with the percentage of schools taking part (before replacement schools are considered) increasing by 10 percentage points between 2000 and 2009 (from 59 per cent to 69 per cent) with pupil response going up by around 6 percentage points (from 81 per cent to 87 per cent). If this has reduced the upward bias in mean test scores found in the earlier PISA waves (by Micklewright et al.), then this may explain some of the decline in England's performance over this period. But as one is unable to also investigate the pattern of response in 2006 and 2009, there remains some ambiguity over the extent to which this can explain the trends presented in Figures 2 and 3.
The problem of missing information has received rather less attention in TIMSS. Panel (b) of Table 2 suggests, however, that less than half of the first choice schools in 1999 (49 per cent) and 2003 (40 per cent) agreed to take part. This changed, however, in 2007 when participation reached near 80 per cent.Footnote 3 This has important implications for the interpretation of the TIMSS trend for England in Figure 3 – the doubling of the school response rate coincides with the marked improvement in average test scores (i.e. the big increase from 2003 to 2007). However, without more information on the nature of this non-response (and how it has changed over time) it is again difficult to decipher whether England's rise up the international rankings in TIMSS is an artefact of the data or represents genuine change.
The cumulative impact on the trend in average PISA maths test scores
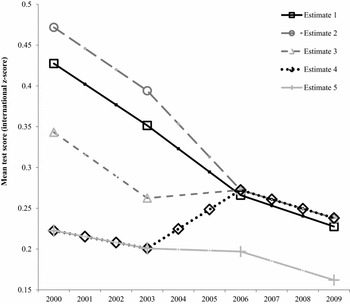
A number of difficulties have been identified with the PISA data for England. But what is the cumulative impact of these on the PISA trend shown in Figure 3? Five estimates, based upon different assumptions about the comparability of the data across survey waves, are now produced. These can be summarised as follows:
Estimate 1 – No adjustment is made to the raw PISA test scores. In other words, one ignores the issues discussed and assumes that data from the four waves are comparable (solid black line).
Estimate 2 – Only English year 11 pupils born between January and August are included (i.e. Welsh and year 10 pupils are dropped) so that the target population is consistent between the different waves. No adjustment is made for the change of survey month or difficulties with non-response (dashed grey line with circle markers).
Estimate 3 – As estimate 2, but with test scores lowered by 15 points for the 2000 and 2003 sample members to account for the fact that these children would have had five months more tuition when they took the PISA test (dashed grey line triangular marker).
Estimate 4 – As estimate 3, but with mean test scores lowered by a further 15 points in 2000 and 7 points in 2003 to account for the non-response bias found in the Micklewright et al. study (black dotted line with diamond markers). As the Micklewright et al. weights are not publicly available, the mean PISA maths test score for England in 2000 and 2003 is lowered by the relevant amount. It is assumed there is no non-response bias in mean 2006 and 2009 England PISA test scores.
Estimate 5 – As estimate 4, but assuming that PISA 2006 and 2009 test scores are upwardly bias to the same extent as those in 2003 (7 points) due to non-response (solid grey line, “+” as markers).
Results can be found in Figure 5.
Alternative estimates of the trend in mean PISA maths test scores for England
Notes: These estimates are based on four different sets of assumptions that are discussed in section 4.4. Estimate 1 is the trend for England based on the raw PISA data. Estimate 2 is where the data are restricted to just year 11 pupils born between January and August in England. Estimate 3 is the same as estimate 2, but when an adjustment has been made for the change of test month. Estimate 4 is the same as estimate 3, but with an additional adjustment for non-response bias in the 2000 and 2003 PISA waves. In estimate 5, I assume that the upward bias found in PISA 2003 test scores (due to non-response) occurs again in the 2006 and 2009 survey waves.

The trend varies substantially depending upon the assumptions made. For instance, there is a decline of 0.25 of an international standard deviation in ‘estimate 2’, but a small rise of 0.05 in ‘estimate 4’. Although all estimates suggest a fall between 2006 and 2009, this is small in magnitude (less than 0.05 of a standard deviation) and is typically statistically insignificant at conventional thresholds. This clearly brings into question whether the performance of secondary school pupils performance in England has really been in relative decline. It would be wrong, however, to claim that any one of the five estimates is ‘correct’, or that the TIMSS data should be used instead. Rather the key point is that there are problems with identifying change over time using the PISA data for England, and that conclusions (and public policy) must not be based on this resource alone. Indeed, given that other evidence (from TIMSS and national exam results) contradicts PISA, it is difficult to treat the apparent decline in secondary school pupils’ performance as a statistically robust result.
Conclusions
The international studies of pupil achievement provide an important insight into how secondary school children's achievement varies across countries and is changing over time. Policymakers in England have paid much attention to the PISA data with regard to this issue, but are results from this single study ‘robust’? This paper has shown how the PISA and TIMSS data for England are problematic, and that they do not provide a clear and consistent message about how secondary school children's performance has changed in this country (relative to others). There are specific problems with missing data, survey procedures and the target population, which limit the inferences one can draw. The recommendations made to policymakers are therefore as follows:
• One cannot firmly conclude that English secondary school children's performance has improved or declined relative to that of its international competitors over the past decade.
• The decline seen by England in the PISA international rankings is not, in my opinion, statistically robust enough to base public policy upon.
• The decline in PISA test scores does not suggest that the Labour government's investment in education was a waste of money, just as the ascendency in the TIMSS rankings does not prove it was well spent. Other factors (e.g. the changing role of families in supporting their children's development) could also be at play. Similarly, there could have been countervailing pressures meaning that, in the absence of this investment, any decline in children's test performance could have been even worse.
• Thus, even if the PISA and TIMSS data were of high enough quality to accurately estimate changes over time, such statements seem to fall into the trap of confusing correlation with causation.
It is also important to make clear the implications of this study for international readers. A growing number of academics are beginning to question aspects of the PISA and TIMSS methodology, including scaling procedures (Goldstein, Reference Goldstein2004; Kreiner, Reference Kreiner2011), cultural bias (Nardi, Reference Nardi2008), student motivation (Goldstein and Thomas, Reference Goldstein and Thomas2008), sampling (Egelund, Reference Egelund2008; Wagemaker, Reference Wagemaker2008) and the choice of test items (William, Reference William2008). These have, however, typically focused upon comparisons made within a single survey wave. In contrast, this is the first paper to consider the methodological difficulties with using such data to measure change in comparative performance over time. One could, of course, argue that the problems I have identified are specific to England, and simply do not occur in the other participating countries. Yet there are reasons to be sceptical of this view. For instance, there has also been a substantial decline in Ireland's PISA test performance between 2000 and 2009 (from 527 in 2000 to 496 in 2009), but the Irish national report (Perkins et al., Reference Perkins, Morgan, Cosgrove and Shiel2010: 10) states the following:
Is it possible that factors associated with the administration of PISA in 2009 and/or linking data from one administration to another have resulted in an inadequate assessment of the knowledge and skills of students, in which case the declines would be artefacts of the assessment, rather than real declines in achievement? The available evidence provides some support for [this] position.
The authors go on to identify patterns of response, test fatigue, item scaling and survey procedures as credible explanations for Ireland's apparent decline. Yet this did not stop the OECD from including Ireland in the recent report on changes in PISA test performance over time. This highlights how the issues raised in this paper should be of upmost concern to the wider international community.
There are also some clear practical messages for policymakers and international survey organisers to take from this paper. The first is that better documentation of the issues discussed is needed, both in the national and international reports. Secondly, it may be possible to get a better understanding of England's comparative performance over time by linking the international achievement datasets to children's administrative records. England is somewhat unusual in having national measures of performance collected at ages 7, 11, 14 and 16 and this could potentially be exploited to investigate at least some of the issues raised (e.g. by examining and correcting for possible non-response bias in each of the survey waves). Thirdly, researchers using such data to investigate trends over time should make readers aware of the issues discussed in this paper and check the robustness of their results. This might include an investigation of whether consistent results are obtained from different datasets (e.g. that their results hold in both PISA and TIMSS) or with other research. Finally, although response rates for PISA and TIMSS have improved in many countries (including England), there is often still a struggle to meet international standards. Not enough information is provided to users on how this may influence their results. In future waves, data linkage and bias analysis (with results fully documented in the national and international reports) should be undertaken as a matter of course. Moreover, the production of additional material to help correct for any of the problems discovered (e.g. response weights) should be made publicly available.
Acknowledgements
I would like to thank Anna Vignoles, David Budge and John Micklewright for their helpful comments on earlier versions of this work, along with those of the Journal of Social Policy editors and two anonymous referees. Feedback has also been gratefully received from Jenny Bradshaw (NFER), Emily Knowles, Helen Evans and Lorna Bertrand (Department of Education). The views in this paper do not represent those of the Institute of Education or the Journal of Social Policy, and are the author's alone.