Introduction
Delirium is a cognitive disorder characterized by acute onset, fluctuating course, and disturbances in consciousness, orientation, memory, thought, perception, and behavior (American Psychiatric Association. and American Psychiatric Association. Task Force on DSM-IV, 2000). It occurs in hyperactive, hypoactive, or mixed forms in up to 42% of older hospital inpatients (Siddiqi et al., Reference Siddiqi, House and Holmes2006) and 70% of long-term care (LTC) residents. In acute, post-acute, and LTC settings, delirium is associated with many poor outcomes (Marcantonio et al., Reference Marcantonio, Simon, Bergmann, Jones, Murphy and Morris2003; Kiely et al., Reference Kiely, Jones, Bergmann, Murphy, Orav and Marcantonio2006; Pitkala et al., Reference Pitkala, Laurila, Strandberg and Tilvis2006; Witlox et al., Reference Witlox, Eurelings, de Jonghe, Kalisvaart, Eikelenboom and van Gool2010; McCusker et al., Reference McCusker2011b). Advanced age, dementia, and medical illness are the most consistent risk factors (Beresin, Reference Beresin1988; Inouye et al., Reference Inouye, Viscoli, Horwitz, Hurst and Tinetti1993; Inouye and Charpentier, Reference Inouye and Charpentier1996; Elie et al., Reference Elie, Cole, Primeau and Bellavance1998; McCusker et al., Reference McCusker, Cole, Abrahamowicz, Han, Podoba and Ramman-Haddad2001).
It is important to study the course of delirium longitudinally. A considerable research effort has been devoted to study the course of delirium in acute care (AC) (Rockwood, Reference Rockwood1993; Levkoff et al., Reference Levkoff1994; O'Keeffe and Lavan, Reference O'Keeffe and Lavan1997; Rudberg et al., Reference Rudberg, Pompei, Foreman, Ross and Cassel1997; Treloar and Macdonald, Reference Treloar and Macdonald1997; McCusker et al., Reference McCusker, Cole, Dendukuri, Han and Belzile2003; Adamis et al., Reference Adamis, Treloar, Martin and Macdonald2006; Sylvestre et al., Reference Sylvestre, McCusker, Cole, Regeasse, Belzile and Abrahamowicz2006; Cole et al., Reference Cole, McCusker, Ciampi and Dyachenko2007; Inouye et al., Reference Inouye, Zhang, Jones, Kiely, Yang and Marcantonio2007; Cole et al., Reference Cole, Ciampi, Belzile and Zhong2009). One study is particularly complete (Sylvestre et al., Reference Sylvestre, McCusker, Cole, Regeasse, Belzile and Abrahamowicz2006). In contrast, only two studies have examined the course of delirium in LTC settings.(Cole et al., Reference Cole2012; von Gunten et al., Reference von Gunten, Mosimann and Antonietti2013).
The first of these two studies (Cole et al., Reference Cole2012) is based on a study including residents of seven LTC facilities in Montreal and Quebec City, henceforth referred to as nursing home (NH) study and examined the course of 61 confusion assessment method (CAM)-defined episodes of incident delirium occurring in 41 patients: it focused on the number of episodes per patient, and reports episode durations, level of delirium measured by the Delirium Index (DI), and recovery rates at 4 and 24 weeks. The LTC results differ from those found in AC settings in two respects: 1) CAM-defined incident episodes last longer in LTC than in AC settings: 11.3 days versus 1–8 days (Rockwood, Reference Rockwood1993; O'Keeffe and Lavan, Reference O'Keeffe and Lavan1997; Rudberg et al., Reference Rudberg, Pompei, Foreman, Ross and Cassel1997; Adamis et al., Reference Adamis, Treloar, Martin and Macdonald2006; Inouye et al., Reference Inouye, Zhang, Jones, Kiely, Yang and Marcantonio2007); 2) presence of hyperactivity and inattention predicted recovery in AC (Treloar and Macdonald, Reference Treloar and Macdonald1997; Cole et al., Reference Cole, McCusker, Ciampi and Dyachenko2007) but not in LTC settings. On the other hand, recovery rates at 4 weeks (77.1%) and 24 weeks (80.3%) were similar to those found in AC settings: 67.2% in 4 weeks and 79% in 24 weeks, (Cole et al., Reference Cole, Ciampi, Belzile and Zhong2009).
The second study (von Gunten et al., Reference von Gunten, Mosimann and Antonietti2013) was based on a Swiss administrative database. It has the strength of being a very large cohort study; however, participants were present in the study for varying and mostly short lengths of time due to heavy mortality and censoring. The outcome evolving over a 20-year period is not measured by a validated instrument but by an ad hoc ordered variable with three levels: subsyndromal delirium, subsyndromal delirium with additional features, and full delirium. The focus is on describing the transition among these levels over a long time period.
The purpose of this work is to contribute to the understanding of the course of delirium in LTC settings, focusing on longitudinal patterns of severity of delirium as measured by the DI (McCusker et al., Reference McCusker, Cole, Dendukuri and Belzile2004). In contrast to previous studies in LTC settings, our innovation is to work with relatively complete longitudinal measures of a validated index, the DI, collected over a 24 week period. Our aim is to propose a classification of DI time trajectories; our methods are similar to those used in a previous study in an AC context (Sylvestre et al., Reference Sylvestre, McCusker, Cole, Regeasse, Belzile and Abrahamowicz2006).
Our work is based on data from the same NH study mentioned above (Cole et al., Reference Cole2012). Our point of view, however, is quite different from that earlier work: instead of restricting the scope of our study to participants satisfying a strict definition of incident delirium, we consider participants with probable prevalent and incident delirium. It is also very different from the Swiss study since it is based on a short time period (24 weeks) so that most patients are observed over the whole study duration.
Methods
Study design
The data used in the present work originated from the multi-site, prospective observational cohort study (McCusker et al., Reference McCusker2011a). The study was conducted in seven long-term care facilities (LTCFs), located in Montreal and Quebec City, Quebec, Canada; it included participants at risk of developing delirium. We excluded subjects: (a) without prevalent or incident probable delirium during the observation period; (b) with less than four assessments, including the time when delirium was initially detected. Delirium was diagnosed using CAM (Inouye et al., Reference Inouye, van Dyck, Alessi, Balkin, Siegal and Horwitz1990) criteria for probable delirium: either acute onset or fluctuation, inattention and either disorganized thinking or altered level of consciousness (Dosa et al., Reference Dosa, Intrator, McNicoll, Cang and Teno2007; Voyer et al., Reference Voyer, Richard, Doucet and Carmichael2009; McCusker et al., Reference McCusker2011a). Participants satisfying the criterion at the time of enrolment were classified as having prevalent delirium; participants without delirium at the time of enrolment who met the criteria for probable delirium at any assessment during the 24 weeks after enrolment were classified as having incident delirium. The week at which the subject was found to have delirium for the first time was defined as the initial time of an observation (time 0).
Measures
The main variable used in this study is the DI (McCusker et al., Reference McCusker, Cole, Dendukuri and Belzile2004), which ranges from 0 to 21, with higher scores indicating more severe delirium. The DI assessment, based on observations by a trained research assistant, was repeated weekly for 6 months after enrollment. At enrolment, a number of baseline characteristics were also available: Demographic characteristics (such as age and gender); Barthel Index (BI) (Mahoney and Barthel, Reference Mahoney and Barthel1965); Mini-Mental State Examination (MMSE) (Folstein et al., Reference Folstein, Folstein and McHugh1975); Charlson Comorbidity Index (CCI) (Charlson et al., Reference Charlson, Pompei, Ales and MacKenzie1987); Cornell Scale for Depression in Dementia (CSDD) (Alexopoulos et al., Reference Alexopoulos, Abrams, Young and Shamoian1988a; Reference Alexopoulos, Abrams, Young and Shamoian1988b); dementia diagnosis by a physician was extracted from patient charts (McCusker et al., Reference McCusker2011a).
Statistical analysis
The main results of this work were obtained using the method described in Leffondré et al. (Reference Leffondré2004) with a few modifications. Briefly, the following four steps constitute our approach: (a) from each subject's DI time curve, the first 24 measures, of the 27 defined in Leffondré et al. (Reference Leffondré2004), were extracted by direct computations. Participants for which these measures could not be calculated were eliminated from analysis; (b) Principal Component Analysis (PCA) was performed based on the correlation matrix of measures in (a) to reduce the 24-dimensional space to a lower dimensional subspace. The number of “meaningful components” was chosen by a combined approach, including i) the Kaiser criterion (retain only components with eigenvalue greater than 1) (Kaiser, Reference Kaiser1960); ii) inspection of the scree plot (retain the components with largest eigenvalues until an elbow appears in the plot) (Cattell, Reference Cattell1966); iii) cumulative proportion of variance accounted for (retain the components with largest eigenvalues until a preselected percentage of the variance is explained, e.g. 75%) (Hatcher, Reference Hatcher1994) and iv) interpretability criterion (retain components that are interpretable, where interpretability is based on the varimax-rotated factor loadings) (Hatcher, Reference Hatcher1994); (c) the individuals were represented in the space spanned by the "meaningful" principal components (PCs) identified in (b), which were interpreted by the measures with loadings in excess of 0.63 (Tabachnick and Fidell, Reference Tabachnick and Fidell2013). (d) K-means clustering (Hastie et al., Reference Hastie, Tibshirani and Friedman2009) was applied to the individuals represented in the space of reduced dimension identified in (c). Choice of the number of clusters was based on the following quantities: Cubic Clustering Criterion pseudo-F statistic, approximate expected overall R2 (Khattree and Naik, Reference Khattree and Naik2000), Silhouette Coefficient (Kaufman and Rousseeuw, Reference Kaufman and Rousseeuw2005).
In addition to the general method described above, we used various significance tests where appropriate, such as ANOVA, Pearson CHI-2 test, two sample t-test. All the analyses were conducted with SAS 9.3 and R 3.2.1.
Results
Study sample
The original study (McCusker et al., Reference McCusker2011a) included 280 residents of seven LTCFs. 32 (11.4%) were found to have prevalent delirium; 82 (29.3%) were found to have incident delirium; the remaining 166 (59.3%) had neither prevalent nor incident delirium. Of the 114 residents having either prevalent or incident delirium, 10 were removed from the study because they had less than four assessments. Thus, the sample of analysis included 104 residents, 28 (26.9%) with prevalent delirium and 76 (73.1%) with incident delirium. The average observation period was 18.3 weeks.
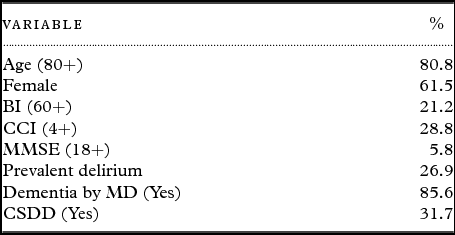
The baseline characteristics of residents are shown in Table 1. Most were elderly seniors, females, with moderate to severe dementia, and disabled; one-third had clinically significant depressive symptoms.
Baseline characteristics of sample of analysis (n = 104)

Clustering analysis
Applying PCA to the data, three interpretable PCs were extracted and named: variation, trend, and mean. Variation (over time) assessed the degree of fluctuation of the DI trajectories; trend assessed the overall tendency of the DI trajectories, through the slope of a linear model in time: positive, negative, and null slopes denote, respectively, worsening, improving, and steady courses of delirium; mean (over time) assessed their average level.
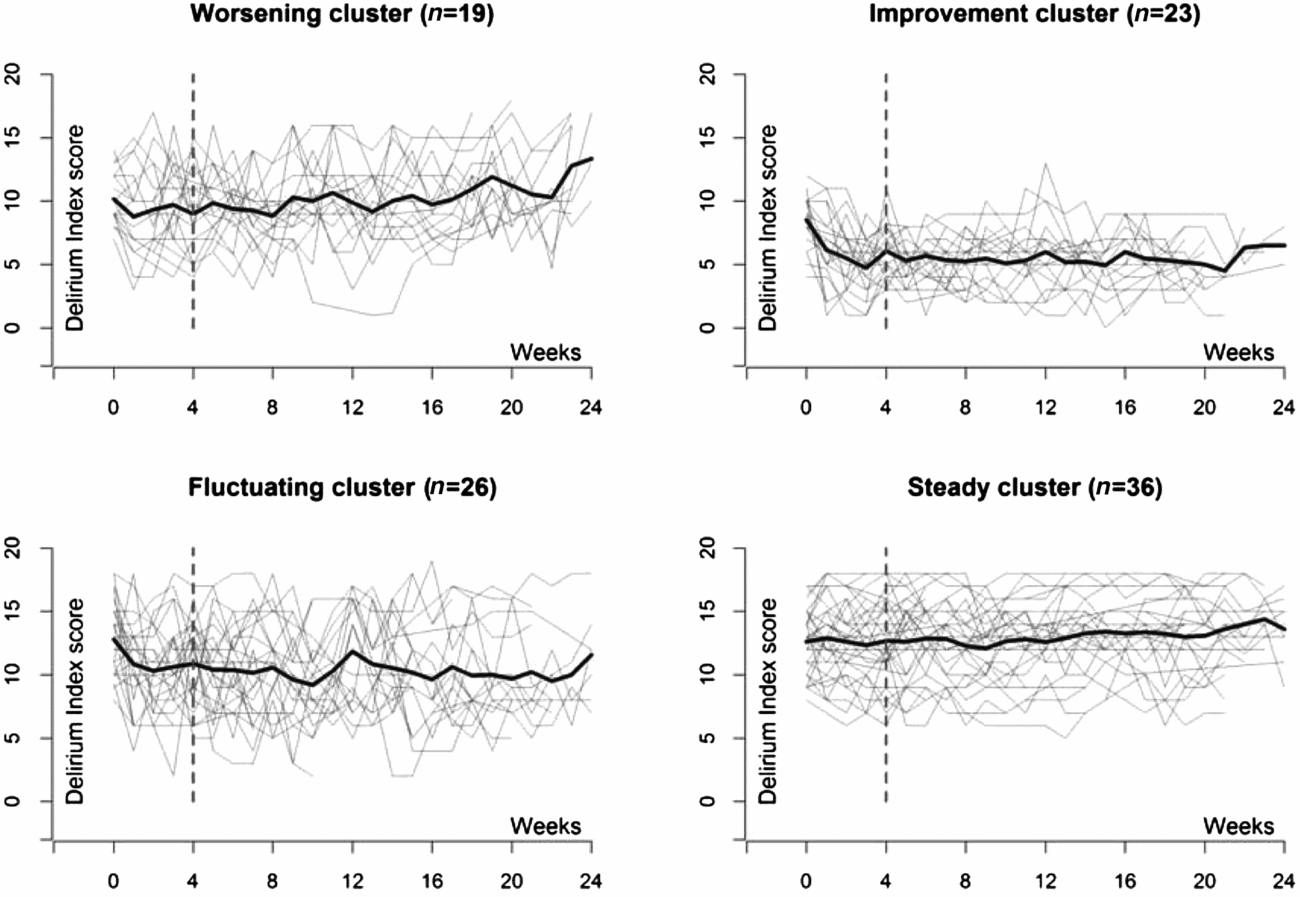
The k-means algorithm applied to the three PC scores identified a four-cluster solution, i.e. four basic patterns of time evolution that we named: Improvement, Worsening, Fluctuating, and Steady. Proportions of the original sample belonging to these four patterns were 22%, 18%, 25%, and 35%, respectively. DI trajectories by clusters with their cluster mean curves were shown in Figure 1. Visual inspection of Figure 1 suggests that, with the exception of the Worsening pattern, the average trajectory stabilizes at the 4th week or earlier.
DI trajectories of nursing home residents by clusters with their cluster mean curves.

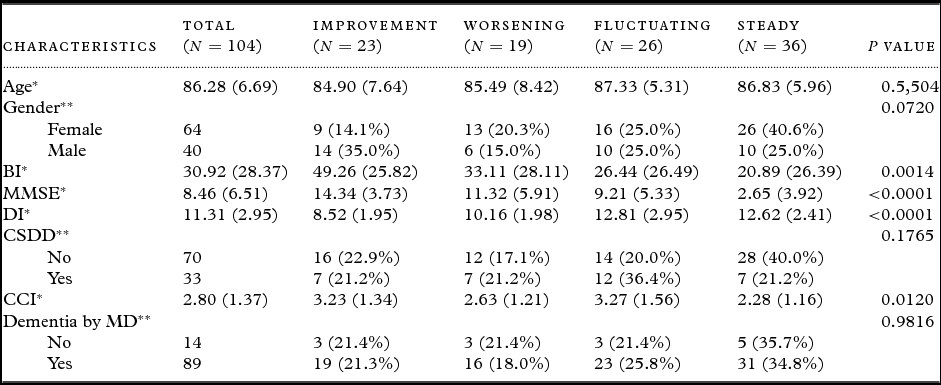
Clinical validity of the clusters was assessed by studying the variations of baseline characteristics across clusters. Table 2 shows the associations between baseline characteristics and clusters for the study sample. This association was not found to be significant for age, gender, CSDD, and dementia. Cognitive impairment, as measured by the MMSE, and performance in activities of daily living, as measured by the BI, were found to differ significantly across clusters. Residents in both the Improvement and Worsening clusters were found to be less cognitively impaired and to perform better in activities of daily living than average, whereas those in the Steady cluster were found to be more cognitively impaired and to perform worse in activities of daily living than average. On the other hand, residents in the Fluctuating clusters were found to be less cognitively impaired than average, but more impaired in the performance of the activities of daily living than average. Moreover, comorbidity, as measured by the CCI, was also found to differ significantly across clusters, with the lowest value of the CCI found in the Steady cluster. Finally, the DI score was found to vary significantly across clusters: residents in both Improvement and Worsening clusters present milder delirium than average, whereas those in both Fluctuating and Steady clusters present higher delirium severity than average. Another way to summarizes these findings is to say, using “low” and “high” as short for “lower and higher than average” that low delirium severity, high cognitive impairment, and low performance in the activities of daily living at baseline predict a likely Steady course; that high delirium severity, high impairment in performing the activities of daily living and low cognitive impairment at baseline predict a likely Fluctuating course; and that low cognitive impairment and high performance in the activities of daily living and less severe delirium predict Improvement or Worsening course.
Associations between baseline characteristics and clusters of LTC residents

Note: * Mean (SD) by clusters is listed and one-way ANOVA is applied to obtain p-value. ** Number (Proportion) by clusters is listed and the Pearson Chi-Squared test is applied to obtain the p-value. Missing cases are ignored since they account for less than 5% of all cases.
Discussion
Four basic patterns of DI score time evolution were discovered in a cohort of older LTC residents that we named Improvement, Worsening, Fluctuating, and Steady. Some of the baseline characteristics of residents vary across clusters: this provides some face validity for the labels that we have chosen. The Improvement cluster appears to include residents with better baseline cognitive and physical function, less severe delirium but more co-morbidity. The Steady cluster appears to include residents with greater impairment of both cognitive and physical function and more severe delirium. On the other hand, the interpretation of the variation of CCI across clusters is not easy to explain, and it may well be due to chance fluctuation, since the p-values we are presenting in Table 3 are nominal (no correction for multiple comparisons was attempted, in view of the purely descriptive aim of the table).
Proportions of basic types of DI score patterns in AC and LTC-based studies

The previous study of delirium trajectories in AC (Sylvestre et al., Reference Sylvestre, McCusker, Cole, Regeasse, Belzile and Abrahamowicz2006) found the same four basic patterns; there are, however, two differences. In the latter study, the Improvement pattern was split into two patterns (Fast and Slow) and the proportions of participants belonging to the four patterns are different in the two studies, as it can be seen from Table 3: compared to LTC residents, more AC participants were assigned to the Improvement pattern and fewer participants to the Worsening and Fluctuating patterns.
Further insight in the difference between the AC patients and the LTC residents is obtained by comparing the value of the PC scores named variation, trend, and mean. They vary indeed across clusters as expected (data not shown). In particular, it is interesting to look at the few features that are most correlated with the PC named variation. We found that the AC patients as compared to the LCT residents have (a) a larger coefficient of variation (AC: 39.07±29.52, LTC: 22.31±13.34, p<0.001); (b) a higher probability of abrupt change, assessed as the mean of the absolute first differences between two consecutive scores of the trajectories (AC: 2.34±1.52, LTC: 1.86±0.85, p < 0.001); (c) a higher probability of having peaks and valleys, assessed as the mean of the absolute second differences between two consecutive scores of the trajectories (AC: 3.83±3.08, LTC: 3.20±1.51, p = 0.013).
It should be noted that a systematic review of several studies on persistent delirium (Cole et al., Reference Cole, Ciampi, Belzile and Zhong2009) may be relevant for comparison with the present work. The combined proportion across several studies of persistent delirium was found to be 17.4% at discharge, 32.8% at 1 month, 25.6% at 3 months, and 21% at 6 months. Although these results are not directly comparable with those presented here, it is interesting to notice that if we view the patients in the worsening pattern as having persistent delirium, then the frequency of patients the worsening pattern (18%), is close to that of the patients with 6 month persistent delirium (21%). It is also reasonable to assume that a subgroup of the patients in the steady pattern (35%) can be viewed as having persistent delirium.
The study has five strengths: 1) it is based on a relatively large population drawn from multiple centers, hence more representative than single center studies; 2) it uses a validate measure of delirium severity, the DI; 3) the follow-up is relatively long (6 months); 4) the follow-up includes multiple time points (the median number of weekly assessment per resident was 23 with the interquartile range 19–24 (McCusker et al., Reference McCusker2011a); and 5) the follow up is fairly complete (overall 10% died during follow-up and 5% withdrew from the study before 24 weeks (McCusker et al., Reference McCusker2011a)).
The study has three potential limitations. First, consent rates for the original study were low; thus, the results may not be representative of residents in participating facilities. Second, the measure of delirium severity was based on a single weekly observation of each resident. Finally, we have focused only on the univariate DI and have not analyzed the information contained in the subscales of the DI (multivariate DI): this would require a complex statistical methodology based on latent classes. We are currently developing a latent class approach to study the multivariate DI, but this is well beyond the scope of the present work.
The findings of this study may have implications for clinical practice in LTC settings. First, the findings suggest that the prognosis of delirium in LTC residents is worse than the prognosis in AC settings: LTC residents appear to be less likely to improve and more likely to worsen over time, possibly reflecting greater vulnerability, more chronic physical illnesses, more medication toxicity, or less effective and timely interventions in LTC settings. Development of novel interventions to prevent or detect and manage delirium in LTC settings may be appropriate. On this point, poor baseline cognitive and physical function and greater severity of delirium may help to identify residents at greatest risk of poor outcomes.
Conclusion
The trajectories of delirium in LTC settings appear to be similar to the trajectories in AC settings but the proportions following each trajectory differ. Poor baseline cognitive and physical function and greater severity of delirium appear to predict worse trajectories over 24 weeks.
Conflict of interest
None.
Description of authors’ roles
Antonio Ciampi proposed the methodology and wrote the paper in collaboration with Alina Dyachenko. Chun Bai and Eric Belzile contributed substantially to the implementation of the methodology and performed the calculations. Martin Cole and Jane McCusker contributed their clinical and methodological expertise at each step of the development, providing constructive criticism, and making the data available.
Acknowledgment
This paper was funded by CIHR grant TO1-120302.