Implications
Variation in the N use efficiency (NUE) in ruminants across diets, but also across individuals, can be predicted from the difference in the natural abundance of 15N between the animal proteins and diet (Δ15Nanimal-diet). The ability of this isotopic biomarker to rank individuals from a homogenous group (same animal species, physiological status and fed the same diet at the same time) could open the door to its application in genetic selection programs and precision livestock feeding.
Introduction
Improving the conversion of feed resources into animal products should be a goal in animal production systems aiming to solve future food security issues. Identifying feeding strategies, but also individual animals, leading to a greater efficiency of nutrient utilization is therefore of crucial importance. Nitrogen use efficiency (nitrogen gain or milk N yield/N intake) is an important component of ruminant feed efficiency (Wheadon et al., Reference Wheadon, McGee, Edwards and Dewhurst2014; Cantalapiedra-Hijar et al., Reference Cantalapiedra-Hijar, Fouillet, Huneau, Fanchone, Doreau, Nozière and Ortigues-Marty2015) and logically determines the extent of N excretion to the environment. However, determination of NUE remains costly, laborious and difficult to accomplish under practical conditions. Accurate predictors of NUE are needed for precision management (feeding to individual potential), as well as for genetic selection. Previous studies have concluded that milk N urea concentration in bulk tank milk (Kauffman and St-Pierre, Reference Kauffman and St-Pierre2001) or an average blood urea-N concentration (Kohn et al., Reference Kohn, Dinneen and Russek-Cohen2005) may be useful indicators of on-farm NUE. However, they appear less suitable for monitoring protein nutrition and N utilization of individual animals (Hof et al., Reference Hof, Vervoorn, Lenaers and Tamminga1997; Huhtanen et al., Reference Huhtanen, Cabezas-Garcia, Krizsan and Shingfield2015), nor as a phenotyping tool to be applied in genetic selection for improved NUE (Vallimont et al., Reference Vallimont, Dechow, Daubert, Dekleva, Blum, Barlieb, Liu, Varga, Heinrichs and Baumrucker2010). An alternative and new biomarker for NUE in ruminants is based on the N isotopic fractionation between the animal and its diet (Δ15Nanimal-diet, for details see Cantalapiedra-Hijar et al., Reference Cantalapiedra-Hijar, Ortigues-Marty, Sepchat, Agabriel, Huneau and Fouillet2016). Variation in Δ15Nanimal-diet has a high potential to discriminate individuals fed the same diet but showing different N partitioning, as suggested by studies carried out in different animal species (Gaye-Siessegger et al., Reference Gaye‐Siessegger, Focken, Abe and Becker2004; Sears et al., Reference Sears, Hatch and O’Brien2009; Warinner and Tuross, Reference Warinner and Tuross2010) and humans (Fuller et al., Reference Fuller, Fuller, Sage, Harris, O’Connell and Hedges2004). Several recent studies have evaluated this new biomarker of NUE in ruminants with promising results in most, although not all, cases (Cheng et al., Reference Cheng, Nicol, Dewhurst and Edwards2013; Cabrita et al., Reference Cabrita, Fonseca and Dewhurst2014; Cantalapiedra-Hijar et al., Reference Cantalapiedra-Hijar, Fouillet, Huneau, Fanchone, Doreau, Nozière and Ortigues-Marty2015). The generalization of the relationship between NUE and Δ15Nanimal-diet across different experimental conditions in ruminants has not yet been explored, nor has the potential of this new isotopic biomarker to predict between-animal variation in NUE.
Because ruminant N losses occur at both the rumen and animal metabolism levels (Dijkstra et al., Reference Dijkstra, Reynolds, Kebreab, Bannink, Ellis, France and Van Vuuren2013), accurate biomarkers of NUE should be able to describe N partitioning at both levels. Although N isotopic fractionation in ruminants has been linked to both rumen bacterial (Sutoh et al., Reference Sutoh, Obara and Yoneyama1993; Wattiaux and Reed, Reference Wattiaux and Reed1995) and splanchnic tissue (Cantalapiedra-Hijar et al., Reference Cantalapiedra-Hijar, Fouillet, Huneau, Fanchone, Doreau, Nozière and Ortigues-Marty2015) metabolism, the significance of these pathways and biological mechanisms has only been evaluated under specific feeding conditions and with few animals (Cantalapiedra-Hijar et al., Reference Cantalapiedra-Hijar, Ortigues-Marty, Sepchat, Agabriel, Huneau and Fouillet2016). Therefore, this study used meta-analysis to gauge the extent to which this isotopic biomarker can be proposed as a generalizable predictor of NUE variation – particularly at the level of between-animal variation (NUE variation in animals reared under identical conditions). An additional objective was to evaluate at which level (rumen, total gastrointestinal tract or metabolism) the N partitioning and utilization had a higher impact on the relationship between Δ15Nanimal-diet and NUE in ruminant animals under a range of feeding conditions.
Material and methods
Experimental data
Individual values from all available publications (Cheng et al., Reference Cheng, Edwards, Dewhurst, Nicol and Pacheco2011, Reference Cheng, Kim, Merry and Dewhurst2013a, Reference Cheng, Nicol, Dewhurst and Edwards2013b, Reference Cheng, Sheahan, Gibbs, Rius, Kay, Meier, Edwards, Dewhurst and Roche2014 and Reference Cheng, Woodward, Dewhurst, Zhou and Edwards2016; Cabrita et al., Reference Cabrita, Fonseca and Dewhurst2014; Cantalapiedra-Hijar et al., Reference Cantalapiedra-Hijar, Fouillet, Huneau, Fanchone, Doreau, Nozière and Ortigues-Marty2015 and Reference Cantalapiedra-Hijar, Ortigues-Marty, Sepchat, Agabriel, Huneau and Fouillet2016) reporting both NUE and Δ15Nanimal-diet values in domestic ruminants were used to create a database (n_study=8). Overall, the database comprises 11 experimental studies (ID#1 to ID#11), 41 treatments (ID#_T) and individual animal values for NUE (n_indiv=226) and Δ15Nanimal-diet (n_milk=161 and n_plasma=130) measured in dairy cattle (n_study=7), beef cattle (n_study=2), dairy goats (n_study=1) and non-lactating sheep (n_study=1). Trials were conducted as either factorial (n_study=3) or Latin square-like design (n_study=8). The Δ15Nanimal-diet values reported in all available publications used in this meta-analysis corresponded to animal proteins analyzed in either plasma (n_study=3) or milk (n_study=1) or both (n_study=4). A description of the experimental studies and diets used in our database is available in the Supplementary Material (Supplementary Tables S1 and S2).
Diet characterization and nitrogen utilization assessment
To evaluate at which level (rumen, total gastrointestinal tract or metabolism) the N utilization had a higher impact on the relationship between Δ15Nanimal-diet and NUE, experimental diets were characterized according to the new updated INRA feeding system (Sauvant and Nozière, Reference Sauvant and Nozière2016) and always using treatment mean values. Ingredients and the chemical composition of diets, average feed intake and average animal BW from each dietary treatment were used to determine theoretical feed values, as well as theoretical digestive and metabolic variables related to N utilization through the systool software (www.systool.fr). The relationship between theoretical and measured dietary compositions did not differ from the first bisector with RMSE<20 and 50 g/kg dry matter (DM) for CP and NDF, respectively. Diets were thus described in terms of rumen protein balance (RPB, g/kg DM), rumen degradable protein (RDP, g/kg DM), efficiency of microbial protein synthesis according to either available energy (EMPS_E, g/g rumen fermentable OM (fOM)) or available protein (EMPS_N, g /g RDP), the digestive efficiency of N use (DENU, g metabolizable protein (MP)/g CP) and the efficiency of MP utilization for either production (EMPU_prod, g of milk N secretion or N retention/g N from metabolizable protein intake) or for total net protein synthesis (EMPU_tot (g of milk N secretion or N retention+endogenous fecal N+N lost in scurf)/(g N from metabolizable protein intake−g endogenous urinary N excretion)). These new variables were added to our database.
Statistical analysis
Sources of variation in nitrogen use efficiency and Δ15Nanimal-diet
We fitted a random intercept model, through the nlme package in the R software (R Development Core Team, 2015), describing variability in NUE and Δ15Nanimal-diet, separately:
 $$Y_{{ij}} \,{\equals}\,\beta _{0} {\plus}\beta _{i} {\plus}{\varepsilon}{_i}_{j} $$
where, Y ij is the observed NUE or Δ15Nanimal-diet values for observation j on the group i, β 0 is the mean value across the population of domestic ruminants being sampled, β i is a random variable representing the deviation from the population mean for the ith group, and ε ij is a random variable representing the deviation in NUE or Δ15Nanimal-diet values for observation j on group i from the mean value for group i. The grouping factor (ID/P/D) included multiple nested levels of random effects for diet (D) within experimental period (P) within-study (ID). The residual error of this model represented the between-animal variability together with the experimental error. Total variance explained by the grouping factor was split to assess the proportion of variance explained by each source of variation (ID, ID/P and ID/P/D).
Several parameters of interest were estimated with this approach, namely the average values for NUE and Δ15Nanimal-diet for an ‘average’ ruminant (β 0), the variance of NUE and Δ15Nanimal-diet among experimental conditions (between-group variability (σ i 2)), and the variances of NUE and Δ15Nanimal-diet within the experimental unit (within-group variability (σ e 2)). With this random intercept model the intra-class correlation coefficient (ICC) was calculated to assess the explained variance due to each level of the nested grouping factor included in the model (ID, ID/P and ID/P/D). The ICC gives an idea of the importance of the random variable (study, period and diet) to explain variation in NUE and Δ15Nanimal-diet values and it identified which grouping factors should be considered in the final mixed-effect model. The ICC was calculated as:
 $${\rm ICC}\,{\equals}\,\sigma _{i} ^{2} \,/\,\left( {\sigma _{i} ^{2} {\plus}\sigma _{e} ^{2} } \right)$$
Analysis of the relationship between nitrogen use efficiency and Δ15Nanimal-diet
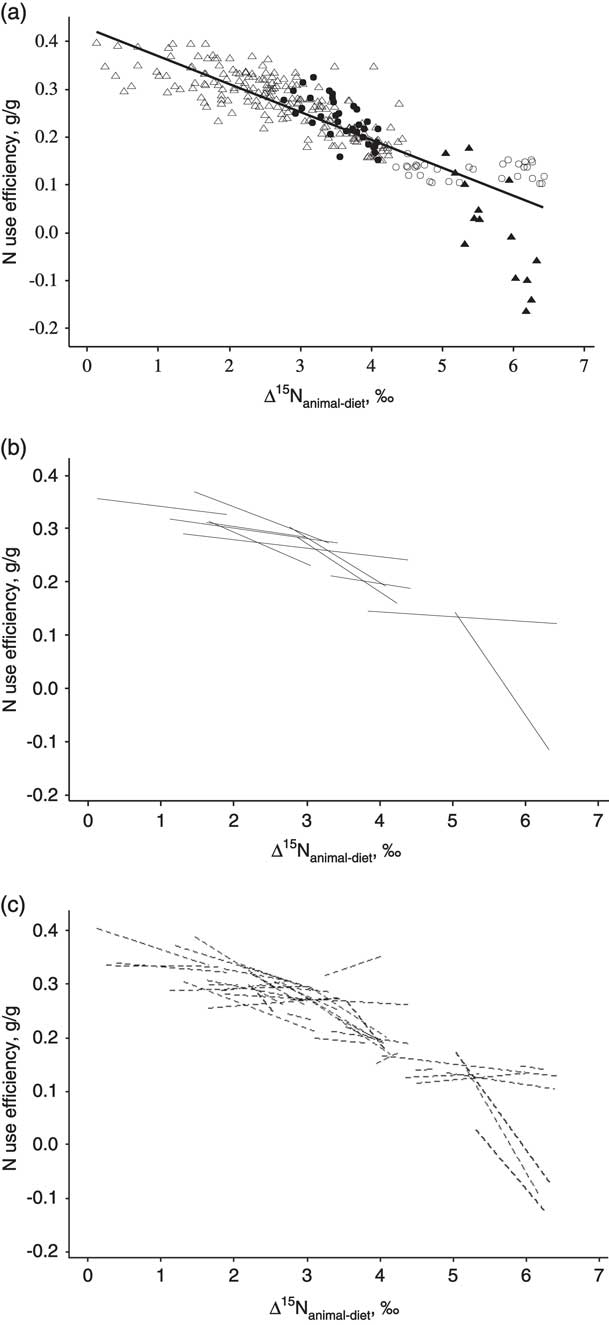
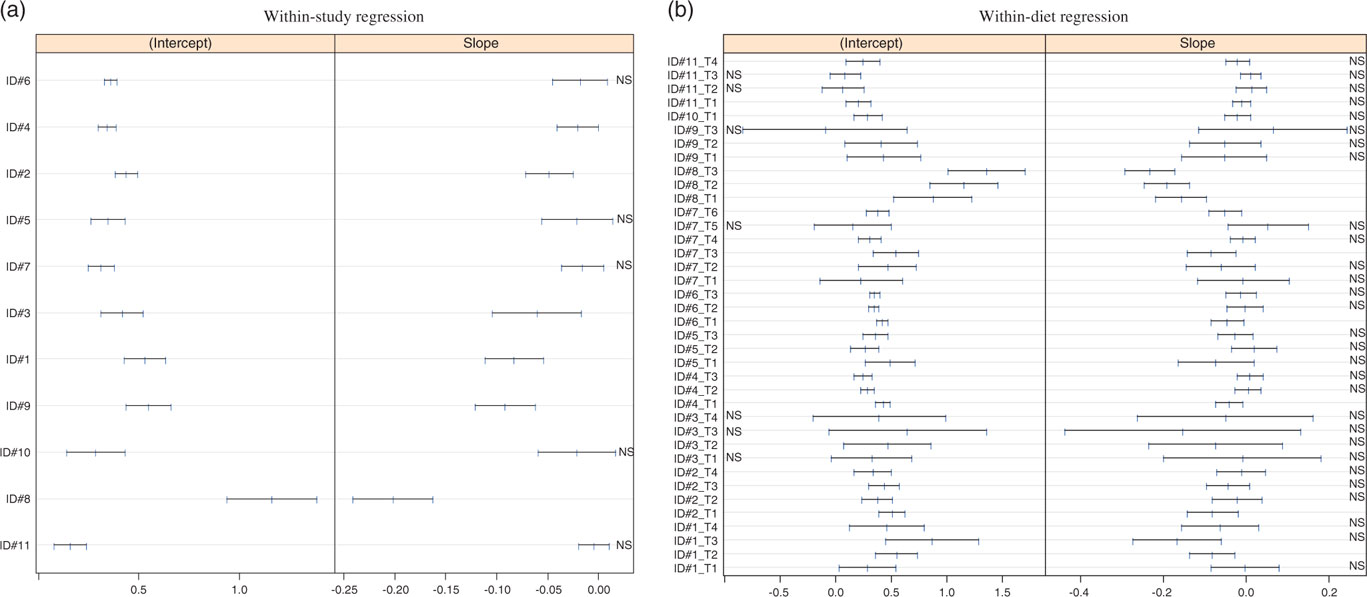
First, we used the lmList function of the nlme package (Pinheiro and Bates, Reference Pinheiro and Bates2000) to fit linear regressions relating NUE to Δ15Nanimal-diet for each study and dietary treatment separately (Figure 1). The confidence intervals were calculated for the individual regression coefficients and graphically presented (Figure 2) for evaluation of between-group variation. When there were indications of large study-to-study or diet-to-diet variation in either the intercept or slope estimates, a random effect was proposed in the model (Pinheiro and Bates, Reference Pinheiro and Bates2000).
Relationship between nitrogen use efficiency (NUE) and N isotopic fractionation (Δ15Nanimal-diet) in ruminants using individual values (n=282). (a) Simple linear regression analysis (overall relationship: NUE=0.429−0.058×Δ15Nanimal-diet) where open triangle=dairy cows; open circles=dairy goats; closed triangles=non-lactating sheep; closed circles=growing beef cattle; (b) simple linear regression for each study (n=11; within-study regression), (c) simple linear regression analysis for each diet (n=38; within-diet regression). Coefficients for individual regressions within-study and within-diet are presented in Figure 2.

Confidence intervals (95%) for the intercepts and slopes obtained from the regression of nitrogen use efficiency (NUE) (Y) in ruminants on N isotopic fractionation (X). (a): Within-study regression (ID#); (b): Within-diet regression (ID#_T). When non-significant estimates were found, the letters NS appears beside the corresponding confidence interval. All slopes are numerically negative within-study (a) and 31 out of 38 within-diet (b). However, large confidence intervals are obtained because of the relative low number of observations within-study (n=15 to 34) and within-diet (n=3 to 16) leading to non-significant responses in four studies out of 11 and in 29 dietary treatments out of 38. The average slope was −0.053 and −0.046 within-study and within-diet, respectively, compared with a slope of −0.058 between studies (Figure 1).

Mixed-effect models were then used to test the ability of Δ15Nanimal-diet to reflect average NUE variation across diets and individuals. Different random structures (from simple to more complex models), were compared based on the Akaike Information Criterion (AIC; the lowest being best) and the Bayesian Information Criterion (BIC; the lowest being best). The random effects were tested on the intercept, slope or both. When information criterion statistics (AIC, BIC) were similar for two models, the log-likelihood ratio test criteria performed with the command ANOVA (model 0, model 1) in R was used to determine the best model. Random-effect structures were always compared (AIC, BIC) using the restricted maximum likelihood method.
The general form of the mixed-effect model was:
 $$Y_{{ij}} \,{\equals}\,\left( {\beta _{0} {\plus}b_{{0i}} } \right){\plus}\left( {\beta _{1} {\plus}b_{{1i}} } \right)X_{{ij}} {\plus}{\varepsilon}_{{ij,}} $$
where Y ij and X ij are NUE and Δ15Nanimal-diet values, respectively, β 0 and β 1 are the fixed effects for the intercept and the slope, respectively; the b i are the random effects of experimental factors (the effect of study when using mean treatment values and the effect of either study, period within-study or diet within-period and study when using individual values) and assumed to be independent for different factors; and ε ij , are the identically distributed within-groups errors, assumed to be independent of the random effects. Because of the relative small number of data and complex random-effect structure, a diagonal variance-covariance structure for the random effects was chosen to obtain convergence for the most complex models (Pinheiro and Bates, Reference Pinheiro and Bates2000).
An alternative approach, inspired from Phuong et al. (Reference Phuong, Friggens, De Boer and Schmidely2013), was adopted to attempt to regress between-animal variation in NUE against between-animal variation in Δ15Nanimal-diet regardless of the influences of experimental factors. The between-animal variability in both NUE and Δ15Nanimal-diet was approached once the random effect of the experimental study (ID), period within-study (ID/P) and diet within-period and study (ID/P/D) were removed from raw values according to equation (1). The resulting residuals for NUE and Δ15Nanimal-diet (Table 1) were considered mainly due to the between-animal variation and unidentified sources of error (within-animal variation). If a relationship between NUE and Δ15Nanimal-diet was still significant once the raw values were devoid of the influence of experimental factors, the ability of this biomarker to capture between-animal variation in NUE would be proven.
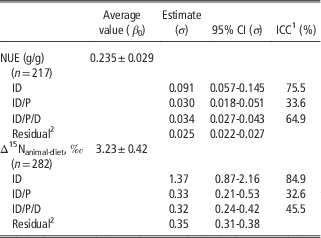
Variance-component estimates of nitrogen use efficiency (NUE) and N isotopic fractionation (Δ15Nanimal-diet) in ruminants when random effects of study (ID), period within-study (ID/P) and diet within-period and study (ID/P/D) were considered

CI=confidence intervals; ICC=intra-class correlation coefficient;
1 ICC: total variance explained by the tested random variables. For nested random variables as ID/P/D for instance it refers to the variance explained by the dietary treatment unexplained by the experimental period and study.
2 Total variance (σ) unexplained by the random effect of study, period and diet (within-group variability) and including mainly the between-animal variability and experimental error.
Identification of outliers
A two-sided outlier test for the standardized residuals was performed at every step to identify outlier observations. Observations with absolute standardized residuals (random effects) greater than the 1−(0.05/2) quantile of the standard normal distribution were thus identified (Pinheiro and Bates, Reference Pinheiro and Bates2000). Outliers were only removed from the database if biological reasons justified their elimination.
Partial least square regression analysis
To answer the question about which variables related to N utilization could better explain the link between Δ15Nanimal-diet and NUE, a partial least squares (PLS) regression analysis was carried out (XLStat v2015.2.02), independently for both variables, on descriptors of N use at the rumen, digestive and metabolic levels. Partial least squares analysis circumvents the problem of multicollinearity between variables related to N partitioning. Thus, the PLS model included either NUE or Δ15Nanimal-diet as the dependent variable and the seven descriptors of N partitioning as independent variables (RPB, RPD, EMPS_E, EMPS_N, DENU, EMPU_prod and EMPU_tot). To determine the number of components to keep in the PLS model, the cross-validation criterion Q2 was considered (Q2>0.0975). The importance of each variable in the model was assessed through their variable importance in projection (VIP) scores. Variables with VIP scores higher than one are considered most important.
Results
Description of the meta-design
Three diets out of 41 (nine individual NUE observations out of 226 (4.0%)) belonging to the same study (ID#7) were removed from our database based on both statistical (large standardized residuals) and biological reasons as discussed later. The number of individual observations within each study ranged from 15 to 34 (Supplementary Table S1) and there were from three to 16 observations for each dietary treatment. Most studies (eight out of 11) tested the dietary treatments across several experimental periods (either 3 or 4) and in these cases each diet was tested on either 1 (ID#2, ID#3, ID#7) or 2 (ID#8 and ID#11) or 3 (ID#4, ID#5 and ID#6) animals per period. As shown in the Supplementary Table S1, the 11 experiments cover a large range of NUE values (from −0.140 to 0.394 g/g) and show a high variability (CV=40%) in relation to its mean value (0.243 g/g). This variability in NUE resulted from the heterogeneity of experimental studies in terms of type of ruminant, experimental diets (Supplementary Table S2; CP content ranging from 128 to 268 g/kg DM and NE content from 1.16 to 1.99 Mcal/kg DM) and feeding level (Supplementary Table S2). The difference in natural 15N abundance between the ruminant and its diet (Δ15Nanimal-diet) averaged 3.28‰ (CV=41%) and ranged from 1.01‰ to 5.70‰ across diets and studies. Four studies reported Δ15Nanimal-diet values both in plasma and milk proteins, but no effect of the type of sample (plasma v. milk) was noted either on the intercept (P=0.28) or on the slope (P=0.39) from the overall relationship between NUE and Δ15Nanimal-diet across these four studies (Supplementary Figure S1). Thus, all Δ15Nanimal-diet data (n_milk=152 and n_plasma=130) were used in subsequent regression analysis to improve model predictions.
Identified sources of variation
Variance components estimates (Table 1) calculated through a random intercept model showed the effect of study as a strong grouping factor explaining 76% and 85% of the total variance (ICC) of NUE and Δ15Nanimal-diet, respectively. This means that around three quarters of variation observed in values for our dependent variable (NUE) was explained by variation among studies (between-study variability). The random effect of period (time) further explained one third of the remaining NUE and Δ15Nanimal-diet variation. For this part, within a given study and experimental period the random effect of the diet explained around 65% and 45% of NUE and Δ15Nanimal-diet variation, respectively.
Relationship between NUE and Δ15Nanimal-diet
Figure 1 shows the relationship between NUE and N isotopic fractionation when all individual data (n_indiv=217) were regressed using a simple linear regression (between-study regression in Figure 1a), or when individual linear fits were obtained for each study (within-study regression in Figure 1b; n_study=11) or diet (within-diet regression in Figure 1c; n_trt=38). A significant (P<0.001) quadratic term for Δ15Nanimal-diet was noted when conducting the between-study regression analysis (Figure 1a), slightly improving the fit (R 2=0.75; data not shown).
Although the response of NUE to Δ15Nanimal-diet variation (slope) was always negative within-study (Figure 2a) only six out of 11 were significantly (P<0.05) different from 0. Likewise, although most (31 out of 38) slopes were negative within-diet (Figure 2b) only around 29% (nine out of 31) were significantly (P<0.05) different from 0. The confidence intervals for the intercepts and slopes across studies and diets did not always overlap; with the most negative slope and highest intercept for the only study conducted with non-productive animals (study ID#8). A high variability among studies and diets was thus evidenced, suggesting the need for different intercepts and response (slope) coefficients among experimental conditions in our model.
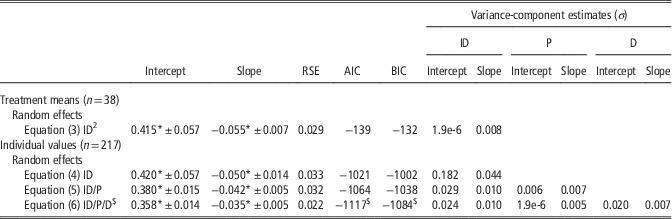
Regardless of the approach (treatment means v. individual values) and based on AIC/BIC criteria, as well as on the comparison of random variance structure through the likelihood ratio test, the best mixed-model included the random effects of experimental factors on both the intercept and slope (Table 2); that is the most complex model structure. Based on variance-component estimates of the best mixed-effect model using individual values, it is concluded that the influence of experimental factors (study, period and diet) was higher for variation in NUE response to Δ15Nanimal-diet (σ=0.010, 0.005 and 0.007 for an average slope of −0.035 (14%<CV<29%)) than for mean estimates of NUE (σ=0.024, 0.0000019, 0.020 for an average intercept of 0.358 (CV<7%)).
Mixed-effect regression models of nitrogen (N) use efficiency in ruminants (Y) on the N isotopic fractionation (X) using either treatment means or individual valuesFootnote †

RSE=residual standard error; AIC=Akaike information criterion; BIC=Bayesian information criterion; ID=random effect of the experimental study; ID/P=random effect of period within the experimental study; ID/P/D=random effect of diet within-period and experimental study.
† All models were tested with random effects on the intercept, slope or both. Best models were obtained when random effects on intercept and slope were included.
$ Best random structure model based on AIC/BIC criteria and the log-likelihood ratio test (P<0.05). When using individual values, model comparisons were conducted with the restricted maximum likelihood method.
* P-value<0.001.
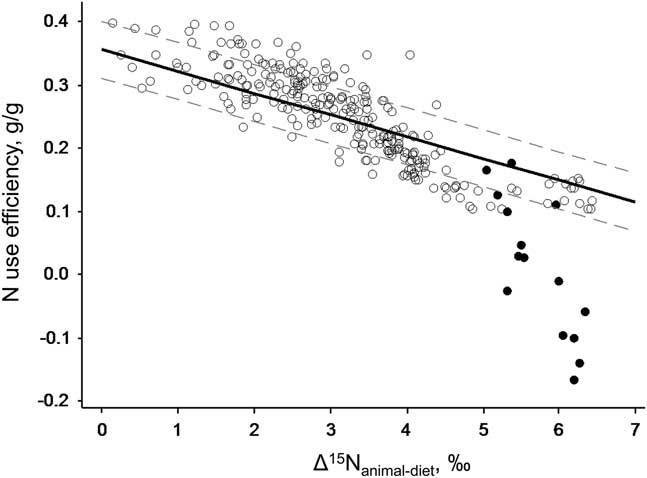
On average, the relationship between individual values of NUE and Δ15Nanimal-diet adjusted by the random effects of the study, period (within-study) and diet (within-period and study) had a significant and negative slope of −0.035 g/g (Figure 3) much less pronounced than that obtained for the unadjusted between-study regression analysis (Figure 1; −0.058 g/g) or when the analysis was based on treatment means and corrected for the effect of study (Table 2; −0.055 g/g). However, there may be a biased prediction for adult ruminants fed close to maintenance requirements (ID#8; black circles in Figure 4).
Overall relationship between nitrogen (N) use efficiency in ruminants (N retention or milk N secretion/N intake) and N isotopic fractionation (Δ15Nanimal-diet) when taking into account the random effects of the study, diet (within-study) and period (within-diet) on the intercept and slope. The resulting equation is: NUE=0.358 (±0.014)−0.035 (±0.0050)×Δ15Nanimal-diet (RSE=0.022). Black circles identify individual data from the only study (ID#8) using adult ruminants fed close to maintenance energy requirements. Dashed lines depict 95% confidence intervals of the regression equation.

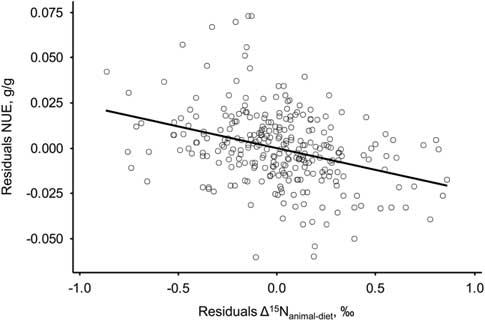
Simple linear regression between residuals of N use efficiency in ruminants (NUE) and N isotopic fractionation (Δ15Nanimal-diet) obtained when both variables were independently adjusted for the random effects of the study, period (within-study) and diet (within-period and study). Equation: NUE=−0.024 (±0.0039)×Δ15Nanimal-diet (P<0.001; R2=0.12, RSE=0.019).

Finally, when individual data for NUE and Δ15Nanimal-diet were independently adjusted by the random effects of the study, period (within-study) and diet (within-period and study), their residuals, mainly representing the between-animal variation, were still negatively correlated with each other (P<0.001) though with a poor fit (r 2=0.12; Figure 4).
Nitrogen partitioning and nitrogen isotopic fractionation
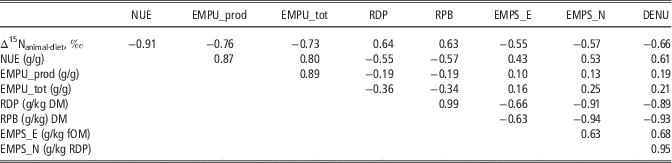
Relationships between Δ15Nanimal-diet and variables related to N use at the whole body, rumen, digestive and metabolic levels are presented in Table 3. Overall, Δ15Nanimal-diet showed a high degree of correlation with most variables, with coefficients of determination (r 2) ranging from 0.30 (EMPS_E) to 0.83 (NUE). The Δ15Nanimal-diet was negatively correlated to variables reflecting the efficiency of N utilization at the different levels (EMPU_prod, EMPU_tot, DENU, EMPS_E and EMPS_N) while positively correlated to variables reflecting protein degradation in the rumen (RDP and RPB). Under the experimental conditions of the studies used in this meta-analysis and according to dietary characterization by the INRA feeding system, the measured whole-body NUE showed a higher correlation with the efficiency of metabolic N use (r=0.87 and 0.80 for EMPU_prod and EMPU_tot, respectively) compared with variables reflecting the efficiency of N use in the rumen (r=0.53 and 0.43 for EMPS_E and EMPS_N, respectively) or digestive (r=0.61 for DENU) levels.
Pearson’s correlation coefficients between nitrogen use efficiency (NUE), N isotopic fractionation (Δ15Nanimal-diet) and parameters related to N utilization in ruminants

EMPU_prod=efficiency of metabolizable protein use for production; EMPU_tot=efficiency of metabolizable protein use for total net protein synthesis; RDP=rumen degradable protein; RPB=rumen protein balance; EMPS_E=efficiency of microbial protein synthesis according to the available energy; EMPS_N=efficiency of microbial protein synthesis according to rumen degradable protein; DENU=digestive efficiency N use; DM=dry matter.
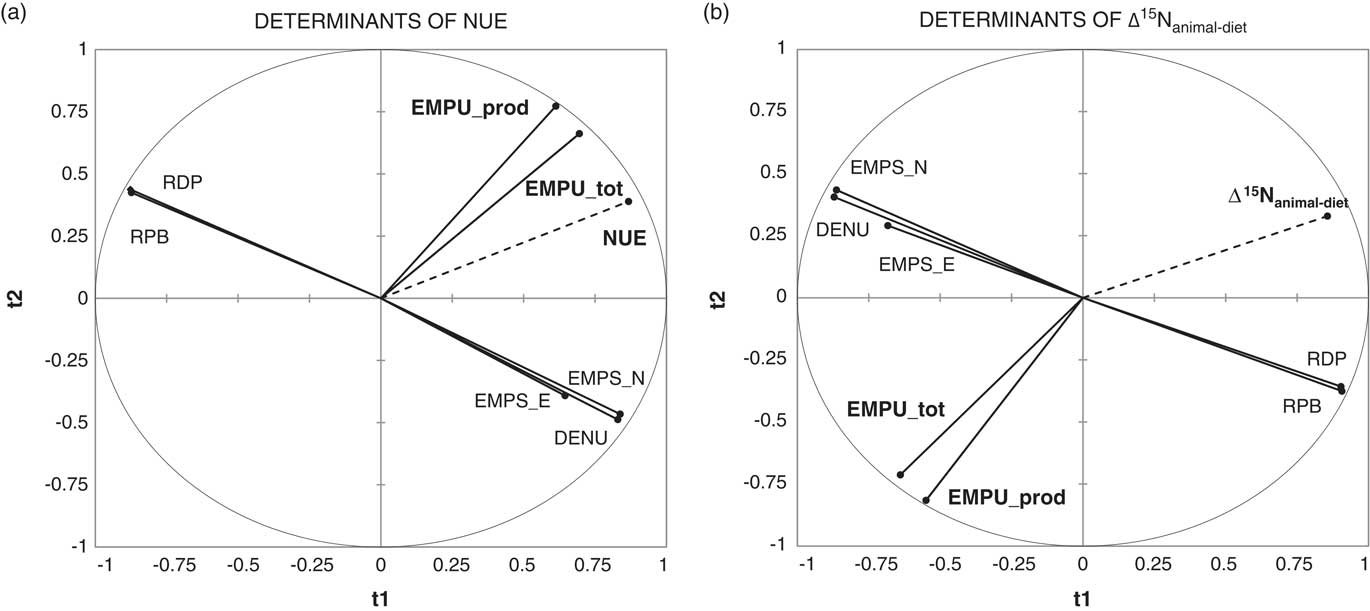
Partial least squares regression models were developed independently to predict variation in Δ15Nanimal-diet or NUE as a function of variables related to N utilization (Figure 5). In both cases, the best PLS regression models contained three components. These components explained 96% and 87.0% of the observed Δ15Nanimal-diet variation (R2Y) and could predict 93% and 83.0% of variation in new values (predictive ability of the model; Q2), respectively. The error of prediction of the model was relatively low (MSEP=0.017 and 0.44 for NUE and Δ15Nanimal-diet, respectively) compared with the range of observed values (Supplementary Table S1). Metabolic N use efficiencies (EMPU_tot and EMPU_prod) were the most important variables in both predictive models as evidenced by their VIP values (from 1.20 to 1.41 for ENU and from 1.12 to 1.25 for ENU and Δ15Nanimal-diet, respectively). In both cases, the VIP scores for the other variables were lower than the unity for all components. However, when the PLS model for Δ15Nanimal-diet was constructed using only these two variables the resulting predictive performances were much lower (data not shown), highlighting the importance of all variables for explaining variation in N isotopic fractionation.
Partial least squares (PLS) regression analysis of either (a) nitrogen use efficiency (NUE) or (b) Δ15Nanimal-diet on descriptors of ruminant N partitioning (efficiency of metabolizable protein use for production (EMPU_prod); efficiency of metabolizable protein use for total net protein synthesis (EMPU_tot); rumen degradable protein (RDP); rumen protein balance (RPB); efficiency of microbial protein synthesis according to the available energy (EMPS_E); efficiency of microbial protein synthesis according to rumen degradable protein (EMPS_N); digestive efficiency of N use (DENU)). Best PLS regression model kept three components (t) in both cases with Q2 values ranging from 0.83 (Δ15Nanimal-diet) to 0.92 (NUE). The most important variables according to variable importance in projection were in both cases EMPU_prod (1.17 to 1.41) and EMPU_tot (1.12 to 1.24) and are highlighted in bold type in both graphics.

Discussion
High between-animal variability in Δ15Nanimal-diet has been reported for ruminants fed the same diet and reared under the same conditions (Hartman, Reference Hartman2011; Sponheimer et al., Reference Sponheimer, Robinson, Ayliffe, Passey, Roeder, Shipley, Lopez, Cerling, Dearing and Ehleringer2003a). Within our database, we noted that variation in Δ15Nanimal-diet for animals reared under identical conditions (same species, study, diet and period) was as large as 1.7‰ (data not shown), which is half of the accepted trophic shift value (3.4‰; Minagawa and Wada, Reference Minagawa and Wada1984), that is the threshold which ecologists use to distinguish trophic levels. Between-individual variation in Δ15Nanimal-diet could stem from individual differences in protein balance (Sick et al., Reference Sick, Roos, Saggau, Haa, Meyn, Walch and Trugo1997; Fuller et al., Reference Fuller, Fuller, Sage, Harris, O’Connell and Hedges2004). In this sense, one of the first authors to evoke the potential link between NUE and Δ15Nanimal-diet was Vanderklift and Ponsard (Reference Vanderklift and Ponsard2003). As then different studies proposed or confirmed a strong relationship between the N isotopic fractionation and NUE in fish (Gaye-Siessegger et al., Reference Gaye‐Siessegger, Focken, Abe and Becker2004), birds (Sears et al., Reference Sears, Hatch and O’Brien2009), pigs (Warinner and Tuross, Reference Warinner and Tuross2010) and ruminants (Cheng et al., Reference Cheng, Sheahan, Gibbs, Rius, Kay, Meier, Edwards, Dewhurst and Roche2014; Cantalapiedra-Hijar et al., Reference Cantalapiedra-Hijar, Fouillet, Huneau, Fanchone, Doreau, Nozière and Ortigues-Marty2015). In the present study, we explored by meta-analysis the relationship between Δ15Nanimal-diet and NUE in domestic ruminants through different statistical approaches and found on average a significant and negative correlation between them, even at the level of between-animal variation (Table 2 and Figures 3 and 4).
Data exclusion from the database
Three dietary treatments belonging to the same study (Cheng et al., Reference Cheng, Edwards, Dewhurst, Nicol and Pacheco2011) were first identified as outliers and excluded from our database based on biological reasons. They had a particular chemical composition (forages with high ammonia-N content (almost 15% of total N, on average) two fold higher compared with the other six experimental diets from the same study) and were associated with high standardized residuals when exploring the overall and within-study relationship between NUE and Δ15Nanimal-diet. One possible explanation for the very low Δ15Nanimal-diet values observed for these three treatments (ranging from 0.81 to 2.06) compared with the rest of diets (ranging from 2.33 to 3.63) could be differences in N isotopic fractionation by rumen bacteria depending on the nature of the N source (ammonia v. amino acids; Wattiaux and Reed, Reference Wattiaux and Reed1995). When data from these three diets were removed a negative rather than positive (Cheng et al., Reference Cheng, Edwards, Dewhurst, Nicol and Pacheco2011) relationship between NUE and Δ15Nanimal-diet was found (ID#7 in Figure 2) in accordance with the average trend of other studies in our database (Cheng et al., Reference Cheng, Sheahan, Gibbs, Rius, Kay, Meier, Edwards, Dewhurst and Roche2014; Cantalapiedra-Hijar et al., Reference Cantalapiedra-Hijar, Fouillet, Huneau, Fanchone, Doreau, Nozière and Ortigues-Marty2015). Likewise, a positive rather than negative relationship between NUE and Δ15Nanimal-diet can be calculated from the N balance and isotopic data reported by Sutoh et al. (Reference Sutoh, Obara and Yoneyama1993) in sheep receiving diets based on alfalfa hay supplemented or not with sucrose. A different pattern of N isotopic fractionation at the rumen level when animals are fed diets rich in RDP, as it is the case with alfalfa hay, cannot be excluded and could agree with the unexpected positive relationship found for three high ammonia diets removed from our database as discussed above. In the present meta-analysis, RPB and RDP, both of them associated with rumen ammonia-N concentration, were moderately and positively correlated (0.63 to 0.64) to Δ15Nanimal-diet, but they were not, however, the most important variables explaining Δ15Nanimal-diet variation in the PLS analysis (Figure 5). Further study is needed to better understand the role of rumen metabolism in N isotope fractionation when there is a large excess of RDP.
Identifying main sources of variation
The relationship between NUE and Δ15Nanimal-diet might not be unique across experimental conditions: the confidence intervals for the estimated slope did not always overlap across studies and diets. Nevertheless, it is not possible to accurately predict this relationship for individual diets as the low number of replications led to inaccurate estimates; that is large confidence intervals as shown in Figure 2. Indeed, despite a negative response of NUE to variation in Δ15Nanimal-diet for most diets, few significant coefficients were found (nine out of 38). The use of a mixed-effect regression analysis in our meta-analysis allowed us to estimate an average trend between NUE and Δ15Nanimal-diet without the need to accept that the relationship might be different for each experimental condition. The need to account for the random effects of known experimental conditions was thus graphically confirmed and agreed with the previous intra-class correlation analysis (Table 1) showing the effect of study as a very high grouping factor.
Despite some results suggesting lower δ15N values in milk v. plasma samples within the same individual (Jenkins et al., Reference Jenkins, Partridge, Stephenson, Farley and Robbins2001), no effect of sample type was noted in the overall relationship between NUE and Δ15Nanimal-diet in the present study (Supplementary Figure S1). Finally, because inter-species variation may exist in rumen and metabolic N utilization, the relationship between NUE and Δ15Nanimal-diet might differ across ruminant species (cattle, goat and sheep). Unfortunately, there were too few data available in the literature to address this question.
Mixed-effect analysis based on treatment means
On average, a global and significant negative relationship between NUE and Δ15Nanimal-diet was found under the main influence of dietary treatments (equation (3) in Table 2; slope=−0.055). The strong impact of diet quality, mainly the protein content and the nature of the protein, on Δ15Nanimal-diet variation is well documented in the literature (Vanderklift and Ponsard, Reference Vanderklift and Ponsard2003; Poupin et al., Reference Poupin, Bos, Mariotti, Huneau, Tomé and Fouillet2011). Likewise, dietary protein content (Huhtanen and Hristov, Reference Huhtanen and Hristov2009) and quality (rumen degradable v. undegradable protein; Hristov et al., Reference Hristov, Etter, Ropp and Grandeen2004) are known to be two of the main determinants of NUE in ruminants. The slope found with this approach suggests that on average an increase in Δ15Nanimal-diet of 1‰ observed between two dietary treatments is associated with a 0.055 g/g decrease in NUE. This negative slope is compatible with a difference in Δ15Nanimal-diet of around 1.5‰ reported by Sponheimer et al. (Reference Sponheimer, Robinson, Ayliffe, Passey, Roeder, Shipley, Lopez, Cerling, Dearing and Ehleringer2003a) in cattle fed two contrasting diets and leading to an estimated difference in NUE (calculated from N balance) of 0.056 g/g in llamas subsequently fed the same diets (Sponheimer et al., Reference Sponheimer, Robinson, Roeder, Passey, Ayliffe, Cerling, Dearing and Ehleringer2003b).
Mixed-effect analysis based on individual values
On average, we found a significant and negative relationship between individual values of NUE and Δ15Nanimal-diet. The discrepancy between the slope obtained when using individual (−0.035 g/g) rather than treatment mean (−0.055 g/g) values could stem from the smaller influence, but still significant, of between-animal variation in the relationship between NUE and Δ15Nanimal-diet compared with other experimental conditions such as physiological animal status or dietary treatments. An alternative explanation could be that physiological mechanisms explaining between-animal variation in NUE are not exactly the same as those related to between-diet variation in NUE.
Indeed the variance estimates calculated from a simple intercept model showed the effect of the study as a strong grouping variable explaining more than half of total variance in NUE and in agreement with previous studies (Kohn et al., Reference Kohn, Dinneen and Russek-Cohen2005; Huhtanen et al., Reference Huhtanen, Cabezas-Garcia, Krizsan and Shingfield2015). The high diversity of experimental conditions included in our database in terms of animal species, physiological status and experimental diets explained the large contribution of study to NUE variation. However, within a given study and experimental period it is noted that the variance unexplained by the diet, and corresponding mainly to between-animal variation, was still very high (35% and 55% of the NUE and Δ15Nanimal-diet variation, respectively). Thus, by applying a mixed-effect model to our individual data to take into account the random effects of the study, diet and period we demonstrated that on average Δ15Nanimal-diet is negatively related to between-animal variation in NUE, which otherwise would have been only evident for nine out of 38 diets (Figure 2).
Limits of the prediction model
A generalizable equation might result in a biased estimation of NUE, especially when animals are in a negative or close to zero N balance as it is the case for data from the only study carried out on adult ruminants fed close to maintenance energy requirements (ID#8 represented as black circles in Figure 3). Data from that study seem to be responsible for a slightly better fitting when a quadratic term was included in the unadjusted between-study relationship of NUE v. Δ15Nanimal-diet (Figure 1a; data not shown). The sharper slope in the relationship between NUE and Δ15Nanimal-diet found in the study ID#8 (Figure 2) supports the concept of a higher 15N enrichment over the diet when the main protein source for the individual is its own stores (Martinez del Rio et al., Reference Martínez del Rio, Wolf, Carleton and Gannes2009) as found for example when birds lose weight during egg-laying and incubation (Hobson et al., Reference Hobson, Alisauskas and Clark1993), when feeding levels were below maintenance requirements in fish (Gaye-Siessegger et al., Reference Gaye-Siessegger, Focken, Muetzel, Abe and Becker2007) or when pregnant women lose weight during nutritional stress (Fuller et al., Reference Fuller, Fuller, Sage, Harris, O’Connell and Hedges2004). However, we contend that this does not preclude the possibility of using Δ15Nanimal-diet to rank such animals for NUE. Future studies should investigate effects of body N reserve mobilization on relationships with Δ15Nanimal-diet.
Mixed-effect regression based on residuals
A difference in Δ15Nanimal-diet values of 1‰ for animals fed the same diet at the same time (and site) was associated on average with a significant difference of 0.024 g/g in NUE, which represent around 10% of the mean value of NUE obtained in our database (Supplementary Table S1). This result highlights the ability to use this new isotopic biomarker to rank animals reared under similar conditions for NUE, although with a greater uncertainty than for diets, and it agrees with results obtained by Gaye-Siessegger et al. (Reference Gaye‐Siessegger, Focken, Abe and Becker2004) in 32 fish showing large between-animal variation in NUE (from around −0.05 to around 0.40 g/g). Our finding also agrees with the significant and negative relationship found by Wheadon et al. (Reference Wheadon, McGee, Edwards and Dewhurst2014) when Δ15Nanimal-diet was used as a predictor of between-animal variation in feed conversion efficiency (average daily gain/dry matter intake) in 84 growing beef heifers fed the same diet at the same time (slope=−0.014 g/g FCE). The relatively sharper slope found in the present study compared with that found by Wheadon et al. (Reference Wheadon, McGee, Edwards and Dewhurst2014) could be explained by the fact that lipids contribute to BW gain, and therefore to feed conversion efficiency, but not to NUE.
Link between nitrogen partitioning and nitrogen isotopic fractionation
In the present study, the two variables related to the NUE at the metabolic level (EMPU_tot and EMPU_prod) were the most important parameters, based on their VIP values, explaining both NUE and Δ15Nanimal-diet variation. These results agree with two studies conducted in rats (Sick et al., Reference Sick, Roos, Saggau, Haa, Meyn, Walch and Trugo1997; Poupin et al., Reference Poupin, Mariotti, Huneau, Hermier and Fouillet2014) and showing that the Δ15Nanimal-diet correlated well with the balance between protein synthesis v. catabolism in the liver, an indicator of metabolic N efficiency use. Although there is clear evidence of a N isotopic fractionation carried out by rumen bacteria (Sutoh et al., Reference Sutoh, Obara and Yoneyama1993; Wattiaux and Reed, Reference Wattiaux and Reed1995) our findings suggests that on average they would contribute to a lesser extent to Δ15Nanimal-diet variation than metabolic processes. This result agrees with the concept of a higher contribution of animal metabolism to between-animal variation in feed efficiency compared with other determinants such as digestion, heat increment of feeding or feeding pattern (Richardson and Herd, Reference Richardson and Herd2004). This is likely one of the main reason why milk urea-N concentration may be unable to capture properly between-animal variation in NUE in ruminants (Vallimont et al., Reference Vallimont, Dechow, Daubert, Dekleva, Blum, Barlieb, Liu, Varga, Heinrichs and Baumrucker2010; Huhtanen et al., Reference Huhtanen, Cabezas-Garcia, Krizsan and Shingfield2015), as their values have been mostly correlated to rumen N losses (Hof et al., Reference Hof, Vervoorn, Lenaers and Tamminga1997; Nousiainen et al., Reference Nousiainen, Shingfield and Huhtanen2004) rather than to the efficiency of metabolic N use (Hof et al., Reference Hof, Vervoorn, Lenaers and Tamminga1997).
Our results may suggest that the ability of Δ15Nanimal-diet to describe the between-animal variation in NUE can be due to the strong link between the N isotopic fractionation and metabolic use of N. Finally, one strength of Δ15Nanimal-diet is the virtually lack of diurnal variation and its stability irrespective of the feeding time given its slow turnover rate. This can be advantageous when seeking to predict NUE in animals adapted to their diets over long periods, but showing different daily feeding patterns. In contrast, the period of time between the introduction of a new diet and the blood/milk sampling is an issue when predicting NUE through Δ15Nanimal-diet values, as revealed in our meta-analysis (the effect of period as a grouping factor), as it takes a long time to reach a new isotopic equilibrium (proposed lag of 45 days for plasma proteins in ruminants, Cantalapiedra-Hijar et al., Reference Cantalapiedra-Hijar, Fouillet, Huneau, Fanchone, Doreau, Nozière and Ortigues-Marty2015). Future research should evaluate the complementarity between MUN and Δ15Nanimal-diet and explore the natural abundance of 15N in specific N compounds (such as individual amino acids) to better predict NUE.
Conclusions
We showed through a meta-analysis approach that the natural 15N enrichment of ruminant protein over the consumed diet (Δ15Nanimal-diet) is on average significantly and negatively correlated to NUE in domestic ruminants reared under different conditions. This correlation was significant even at the between-animal level, highlighting the ability of this isotopic biomarker to rank individuals from a homogenous group (same animal species, physiological status and fed the same diet at the same time) in terms of NUE. The most important variables related to N utilization explaining the link between Δ15Nanimal-diet and NUE under the studied conditions were those related to N metabolism, with rumen fermentation and digestion contributing to a lesser extent.
Acknowledgment
The authors thank the many people involved in each experiment used in this meta-analysis study.
Supplementary material
To view supplementary material for this article, please visit https://doi.org/10.1017/S1751731117003391