


Introduction
The analysis of complex systems in terms of networks has become an important interdisciplinary topic in the recent years. Examples include genetic regulation in biology, epidemic spreading in social and ecological systems, neural networks and internet in communication systems.Reference Boccaletti, Latora, Moreno, Chavez and Hwang1 Another example is the Earth system which might be one of the most important complex systems around us. As shown in Figure 1, climate system can be viewed as concerning the status of the entire Earth system, including the atmosphere, land, oceans, snow, ice and living things, for example. Each component has its dynamical process with many interactions with many other components, including various positive feedbacks. Likewise, the global climatologically patterns are strongly influenced by the local variations of the components. While many factors continue to influence climate, scientists have determined that human activities have become a dominant force, and are responsible for most of the warming observed over the past 50 years.2 As climate changes, the probabilities of certain extreme weather events are affected, which might cause impacts on social and economic developments. In this regard, the climate system is intimately in interaction with human systems as well.2
Schematic view of the components of the global climate system, their processes and interactions Source: IPCC report 20072

Complex networks often have irregular topological structures, with structural issues being the most important. One can characterize the topology of a complex wiring architecture and reveal the unifying principles and statistical properties common to most of the real networks. Therefore, structural analysis initiates a revival of network modelling, developing new models to mimic its genuine properties.
On the other hand, a very important issue in the study of complex systems is the interplay between structure and dynamics. Much attention has been devoted to studying the emergence of collective dynamics in complex networks from the viewpoint of relating the propensity for dynamics in a network to topology and local properties. In particular, one aspect of this interplay is synchronization. Synchronization of oscillators acting on the nodes is one of the widely studied dynamical behaviours on complex networks. It has been shown that dynamical processes, such as network synchronization, are strongly influenced by the structure of the topology of the underlying network. Furthermore, as the distribution of connection weights in real networks is often highly heterogeneous,Reference Zhou, Motter and Kurths3 it is worth investigating the role played by weights in the synchronization dynamics in complex networks.
Generally speaking, the dynamics of a weighted network of N coupled identical oscillators is described by
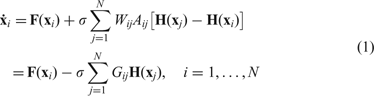
where F = F(x) governs the dynamics of each individual oscillator, H = H(x) is the output function, and σ is the overall coupling strength. Here G = (Gij) is the coupling matrix combining both topology (adjacency matrix A = (Aij)) and weights (weight matrix W = (Wij), Wij ≥ 0): Gij = δijSi − WijAij, where  denotes the intensity of node i. It has been shown that the synchronizability of random networks with a large minimum degree is determined by two leading parameters: the mean degree and the heterogeneity of the distribution of node’s intensity, Si, which is defined as the total strength of input connections of the associated node.Reference Zhou, Motter and Kurths3 By definition, intensity Si is a natural choice incorporating the topology and weights.
Synchronization, as an emerging phenomenon of a population of dynamically interacting units, has fascinated humans from ancestral times.Reference Pikovsky, Rosenblum and Kurths4, Reference Osipov, Kurths and Zhou5 The study of synchronization has become one of the main fields of nonlinear sciences. Synchronization processes can be encountered in physics, chemistry, life sciences, biology, and also in engineering. In the beginning, synchronization was mainly illustrated by periodic oscillations, as originally found, by C. Huygens in 1665, for weakly coupled pendulum clocks. After the discovery of deterministic chaos, the search for synchronization has moved to chaotic systems. Within this framework, there are mainly three types of synchronization in chaotic systems: (a) complete (or full) synchronization, (b) generalized synchronization, and (c) phase synchronization.Reference Pikovsky, Rosenblum and Kurths4 Chaotic phase synchronization is somewhat similar to the synchronization of periodic oscillations and is manifested in the appearance of certain relations between the phases of interacting non-identical systems and results in the establishment of a coincidence of characteristic time scales of the coupled systems. Remarkably, the amplitudes of oscillations often remain chaotic. We will illustrate these arguments by investigating the dynamic relationships between El Niño/Southern Oscillation (ENSO) and the Indian Monsoon (referred to below as Monsoon), which are the predominant climate phenomena in the Asian/Pacific region.
Synchronization is possible if at least two elements are coupled, but it much more often happens in ensembles that include hundreds, thousands, or even more subsystems. In cases where a large number of interacting units are involved, in particular in the presence of a complex network structure configuration, the investigation of synchronization is still emerging. Therefore, in the second part of this paper, we present a model that consists of network of networks in order to disclose the functional networks of brains. The cerebral cortex of mammalian brains is an excellent example of realistic complex systems. Cortical connectivity is organized into a hierarchy, from the microscopic cellular level via the mesoscopic level of local neural circuits and columns to the macroscopic level of nerve fibre projections between brain areas.Reference Scannell, Burns, Hilgetag, O’Neil and Young6 We find that in a biologically plausible regime the dynamics exhibit a hierarchical modular organization, in particular, revealing functional clusters coinciding with the anatomical communities. Our results provide insights into the relationship between network topology and the functional organization of complex brain networks.
Synchronization in coupled systems and applications to earth sciences
Historically, the analysis of synchronization was performed between self-oscillatory systems, that depend on the presence of external (periodic) forcing. After the establishment of chaos theory, the study of synchronization has been extended to chaotic systems. In addition, a great deal of attention has been paid to applying these nonlinear methods to real time series analysis, which makes it possible to reveal interrelations that linear methods cannot. We show these ideas by investigating the relationship between two oscillating systems, namely ENSO and Monsoon, on inter-annual time scales.Reference Maraun and Kurths7
ENSO exhibits self-sustained oscillations of the tropical Pacific ocean–atmosphere coupled system. It is associated with increased rainfall across the Pacific regions, but also contributes to large-scale temperature departures throughout the world, with most of the affected regions experiencing abnormally warm conditions across south-eastern Asia, south-eastern Africa, along the west coast of South America, etc. Figure 2 shows the effects of El Niño around the world via tele-connections. A Monsoon is a seasonal prevailing wind that lasts for several months; for instance, the Indian summer Monsoon affects a huge number of people, with social and economical impacts. ENSO and the Monsoon have been known to be somewhat correlated on inter-annual time scales. Weak Monsoons follow low values of the Southern Oscillation index, i.e. Monsoon failure coincides with El Niño, while strong Monsoons coincide with La Niñas.
The effects of El Niño around the world described via tele-connections (upper graph: winter time; lower graph: summer time) Source: NOAA Climate Prediction Center

The previous results are mainly based on linear correlation and wavelet analysis. Here we present a method used in nonlinear time series analysis, which decomposes oscillatory dynamics into time-dependent amplitude and phase, making it possible to study the relationship between only the phases of ENSO and Monsoon, irrespective of their amplitudes. This approach allows us to corroborate earlier results with a far better time resolution and to infer so far unknown subtle relations invisible to correlation analysis.
We used the monthly mean sea surface temperature data in the eastern tropical Pacific, i.e. the NINO3 index derived from the Kaplan dataReference Kaplan, Cane, Kushnir, Clement, Blumenthal and Rajagopalan8 as a measure for ENSO variability. The Monsoon was represented by the monthly anomalies of the All India Rainfall (AIR) index defined by Ref. Reference Mooley and Parthasarathy9. We analyse the data in the period from 1 January 1871 to 31 December 2003. Since our work focuses on the inference of phase relations of inter-annual oscillations, we low-pass filtered the data in the spectral domain, i.e. high frequency variability with frequencies higher than 0.7 cycles per year is damped. Figure 3 shows a section of the time series of the ENSO and Monsoon data, clearly emphasizing the inter-annual oscillations of ENSO and the biennial oscillation of the monsoon.
Section of the NINO3 (upper graph) and AIR anomalies (lower graph) time series. The dotted lines depict the raw data, the solid lines show the low-pass filtered data used for the further analysisSource: Reference 7

Phase synchronization is a weak form of synchronization in the sense that the phases Φi describing the oscillations get locked, which amplitude might be uncorrelated, namely, we have

To investigate for coherent phase relations, one has to derive the oscillation phases of the involved systems. If one observes only a one dimensional time series x(t) of one of the systems, initially one has to find a suitable two-dimensional embedding. A common approach is constructing an analytical signal by the use of the Hilbert transformation

where P.V. denotes the Cauchy principal value. The phase can then be defined as φ(t) = arctan(y/x). This approach is meaningful only if the embedded signal rotates around a fixed centre. For geophysical signals exhibiting variations on a wide range of frequencies, one could obtain well-defined phases by considering the curvature of phase space trajectories:Reference Osipov, Hu, Zhou, Ivanchenko and Kurths10

To study the occurrence of phase coherence in more detail, we calculate the difference of the phases as shown in Figure 4. Distinct epochs become visible: the plateaus from 1886 to 1908 and from 1964 to 1980 indicate phase coherence during these intervals. In the years 1908–1921, 1935–1943 and 1981–1991, the Monsoon oscillates faster than ENSO, failing when ENSO peaks on inter-annual scales, as during the phase coherent intervals, but with an additional peak in between (2:1 phase coherence; plotting the difference of the Monsoon phase and two times the ENSO phase would yield plateaus). During these epochs, the phases of ENSO and Monsoon are predominantly well defined (grey shading) and both systems exhibit distinct oscillations. During other times, especially 1921–1935 and 1943–1963, the phases are rather badly defined and both processes exhibit irregular oscillations of low variance. We have developed a significance test to verify that the phase coherent intervals have a significant level of 99% at least.
Phase difference of ENSO and Monsoon (black). Grey shading marks intervals of jointly well defined phases. 1886–1908 and 1964–1980 (I): plateaus indicate phase coherence. 1908–1921, 1935–1943 and 1981–1991 (II): Monsoon oscillates with twice the phase velocity of ENSO. During these intervals, both systems exhibit distinct oscillations (NINO3 time series, upper graph). 1921–1935 and 1943–1963: phases are badly defined, both processes exhibit irregular oscillations of low variance (upper graph). Lower graph shows volcanic radiative forcing index (VRF)Source: Reference 7

The high time resolution allows us to precisely determine the onset of phase coherent intervals and thus to suggest a mechanism that might cause the coupling. The lower graph in Figure 4 displays the volcanic radiative forcing index.Reference Sato, Hansen, McCormick and Pollack11 Interestingly both intervals of phase coherence coincide with periods of strong volcanic radiative forcing and start with two major eruptions, of Krakatau and Mount Agung. The possible reason could be: volcanic forcing might not cause single ENSO events, but rather either increase the coupling between ENSO and Monsoon, causing more regular oscillations of the total system, or cause more regular oscillations of one of the systems (probably ENSO), thus increasing the coupling between them. The cooling effect could reduce the land/sea temperature gradient and thus make the Monsoon more sensitive to ENSO influence.
Complex network of networks for understanding of brain dynamics
Synchronization dynamics (phase coherence) presented in the previous section takes place in a simple coupling configuration in the sense that only two processes are involved. As mentioned in the Introduction, complex networks are ubiquitous around us. The investigation of synchronization with complex topology is a big challenge for modern sciences. In this case, there are a large number of dynamical processes involved. Here we propose a new approach, a network of networks, to model brain dynamics.
Let us start by distinguishing three main classes of complex networks,Reference Boccaletti, Latora, Moreno, Chavez and Hwang1 one of which will be used for our modelling:
(1) Random networks. In this network, a pair of nodes i and j are connected with a probability p (Figure 5(a)). Hence, the connection is fully random, and the shortest path (path length) between any pair of nodes is very small even for very large networks.
Figure 5The three basic classes of complex networks: (a) random networks; (b) small-world networks; (c) scale-free networks

(2) Small-world networks. One starts with a regular ring of nodes, each connected to its k nearest neighbors; then, with a probability p, each link is rewired, namely, it is cut and reconnected to another node randomly. When p is small, the resulting network is dominated by the local coupling, while there are a very few long-range random shortcuts (Figure 5(b)). The average distance of the shortest path between any pair of the nodes has been significantly reduced due to this small number of shortcuts. When p is approaching 1.0, a fully random network is retrieved.
(3) Scale-free networks. In many large-scale real-world complex systems, the degrees of nodes are very heterogeneous; for example, with the existence of hubs (Figure 5(c)). The probability P(k) to find a node with degree k in the network follows a power-law distribution


These findings of complex networks have stimulated a great deal of research in the structure analysis of real-world complex systems to disclose the underlying network topology. However, another very important issue in the study of complex systems is the interplay between structure and dynamics. We present a mode using the complex networks approach to aid in understanding brain dynamics.Reference Zhou, Zemanova, Zamora, Hilgetag and Kurths12
The cortical connectivity of the cerebral cortex of mammalian brains has a hierarchical organization, from the microscopic cellular level to the macroscopic level of the nerve fibre projections between brain areas. Here, we focus on the highest structural level, i.e. the systems level of corticocortical connections. We employ the known cortical network of the cat and simulate the dynamics of each node (cortical area) by a subnetwork of interacting excitable neurons. The cortex of the cat can be parcelled into 53 areas which are linked by about 830 fibre connections of different densities. It forms a weighted complex network, Figure 6, and has typical small world properties. There exist a small number of clusters that broadly agree with the four functional cortical subdivisions, i.e. visual cortex (V), auditory (A), somato-motor (SM), and fronto-limbic (FL).
Connection matrix MA of the cortical network of the cat brain. The different symbols represent different connection weights: 1 (• sparse), 2 (∘ intermediate) and 3 (* dense). The organization of the system into four topological communities (functional sub-systems, V, A, SM, FL) is indicated by the solid linesSource: Reference 12

The subnetwork representing each cortical area is arranged as a small world topology, i.e. a regular array of Na(=200) neurons with a mean degree ka(=12) that is rewired with a probability p(=0.3). Such a topology incorporates basic biological features and is found to enhance synchronization of neural networks. Furthermore, our model also includes other realistic, experimentally observed features, e.g. 25% of the Na neurons are inhibitory, and only a small number of neurons (about 5%) in one area receive excitatory synapses from connected areas. We assume that cortical areas communicate with each other via their mean field activity. Individual neurons are described by the FitzHugh-Nagumo model with non-identical excitability. Specifically, our model of the neural network of the cat cortex is composed of a large ensemble of neurons connected in a network of networks. The dynamics of the neuron i at area I are:


where

Here, the matrix M A represents the corticocortical connections in the cat network as in Figure 6 (M A(I, J) : I, J = 1,…, N = 53). MI L denotes the local small world connectivity of the I th area (MI L(i, j) : i, j = 1,…, Na). Additionally, independent Gaussian white noise is added to each neuron in order to simulate perturbations, e.g. from subcortical areas. Our focus is to study the synchronization dynamics at the systems level, i.e. the correlation between the mean activity of the subnetworks and its relationship to the underlying cortical topology (Figure 6). The results we obtained at the systems level do not depend critically on the neuron model, the subnetwork parameters, and detailed coupling between neurons. The average coupling strength between any pair of neurons g is the control parameter in our simulations. Note that we assume g to be equal for couplings within and between subnetworks. We also normalize it by the mean degree ka of the small world within the area and by the average weight <w> of inter-area connections.
In a series of studies,Reference Zemanov′a, Zhou and Kurths13, Reference Zhou, Zemanov′a, Zamora-Lopez, Hilgetag and Kurths14 we have reported that the model possesses two distinguished regimes, weak and strong synchronization. In the weak synchronization regime, the model displays biologically plausible dynamical clusters. The functional connectivity, obtained by passing the correlation matrix through various thresholds, exhibits various levels of organization.Reference Zhou, Zemanova, Zamora, Hilgetag and Kurths12 The dynamics form four major clusters (Figure 7), in an excellent agreement with the four functional subsystems. The specialized clusters are integrated into larger clusters through brain areas having many inter-community connections. Furthermore, brain areas that bridge different dynamical clusters are found to be the areas involved in multisensory associations. It is important to note that such a hierarchical transition to synchronization via clustering is a typical property of complex networks.Reference Arenas, Daz-Guilera, Kurths, Moreno and Zhou15 The approach of a network of networks has been also applied to understanding the spread of diseases.Reference Li, Yi and Kurths16
Four major dynamical clusters (∘) in the weak synchronization regime, compared with the underlying anatomical connections (.)Source: Reference 14

Conclusions
We present a short overview on synchronization dynamics in complex systems, with applications to rather different subjects, in particular from ENSO/Monsoon in the climate system to modelling in brain dynamics. It is these different applications that suggest the complex networks could be a promising and a far-reaching interdisciplinary topic. One of the important advantages of this approach is that it orientates itself on a systems level, not only disclosing the underlying properties and mechanisms but also constructing a more realistic model. Very often, a complex system is made up of many components whose interactions are not effectively computable. In such cases, it is more helpful to study the macroscopic behavior than to dissect individual events. In this regard, complex networks could shed light on the structural integrity and its associated dynamics, which deserves continuous attentions in future.
Last but not least, we emphasize that the investigation of synchronization is still emerging. So far, most of the work has considered the impact of network architectures on the synchronization dynamics. However, in many realistic systems, the feedback of dynamics can reshape the network structures. In this sense, one needs to consider evolving networks under the external influences, for instance the effects of a noisy environment on system dynamics or climate change impact on social-economic networks. Such an evolving network is formed by a time varying ensemble of elements and interrelations. Under the effects of external influences new elements may emerge to join the network or old ones may disappear, while the strength of each individual interaction may also fluctuate or even vanish. Evolving networks are marked by the emergence of information, rich dynamics and structure formation, e.g. collective behaviour between some of the elements. They can switch between stability and instability, leading to new qualitative behaviour like robustness or vulnerability. The study of evolving complex networks is the main challenge in this field in order to achieve a complete comprehension of structure–dynamics relations in complex systems.
Jürgen Kurths studied mathematics at the University of Rostock and got his PhD in 1983 at the GDR Academy of Sciences and his Dr. habil. in 1990. He was full Professor at the University of Potsdam from 1994–2008 and has been Professor of Nonlinear Dynamics at the Humboldt University, Berlin and chair of the research domain Transdisciplinary Concepts of the Potsdam Institute for Climate Impact Research since 2008. He is a fellow of the American Physical Society and of the Fraunhofer Society (Germany). He got a Humboldt-CSIR research price in 2005 and a Dr. h.c. in 2008. His main research interests are complex synchronization phenomena, complex networks, time series analysis and their applications in cognitive and neuroscience and climatology. He has published more than 350 papers and two monographs, which have been cited more than 11,000 times.



