In recent years (particularly since the 2016 election), there has been growing attention to, and interest in, the political, social, and cultural differences between rural and non-rural communities in the United States (Gimpel et al. Reference Gimpel, Lovin, Moy and Reeves2020; Kelly and Lobao Reference Kelly and Lobao2019; Niskanen Center 2019). Rural portions of the United States account for roughly 97% of the country’s land area, but only an estimated 19% of Americans live there (U.S. Census Bureau 2016b). While accounting for less than one-fifth of the population, rural Americans are extremely important from both a political and environmental perspective. Due to the structure of the federal government, rural states are overrepresented (in terms of population) in the Senate and in the Electoral College. Rural Americans play an important role in implementing the nation’s environmental policies, and many of the environmental regulations in America also affect rural citizens more directly than they do citizens in urban or suburban areas. For example, some regulations designed to protect clean water throughout the country (such as the Waters of the US Act (US EPA 2015)) disproportionately increase regulations on waterways in rural areas. Conservation of ecosystems, water, and wildlife, the production of energy—renewable and non-renewable—and many other environmental issues depend on the actions taken by rural residents; gaining rural buy-in for environmental regulations can lead to greater success in their implementation.
Theoretically, there is reason to believe that rural communities would have unique environmental policy attitudes. Rural and urban residents tend to use the natural environment for different purposes—rural use is more frequently extractive, while urban use is more frequently recreational—which could lead rural Americans to favor a different balance between economic development and environmental protection (Freudenburg Reference Freudenburg1991; Hendee Reference Hendee1969). Rural residents also tend to have lower incomes, which can translate to a greater prioritization of economic growth over environmental protection (Freudenburg Reference Freudenburg1991; Murdock and Schriner Reference Murdock and Schriner1977).
Beyond the practical drivers of these attitudinal differences, recent research suggests that differences in core values and identities may be key to understanding unique policy preferences in rural communities. A shared sentiment of disenfranchisement and a sense that rural communities are “left behind” as government policies prioritize the needs of other groups has led to skepticism and distrust of the federal government and a sense that rural communities are left out of the policymaking conversation (Cramer Reference Cramer2016; Hochschild Reference Hochschild2016; Wuthrow Reference Wuthrow2018). This perspective would suggest an opposition to government regulations and environmental policies among rural Americans.
Meanwhile, other components of rural identities suggest a strong sense of environmental stewardship and a prioritization of environmental conservation that could lead rural Americans to be more supportive of environmental protection policies. Rural Americans tend to have powerful place-based identities that drive their political preferences in unique ways (Jacobs and Munis Reference Jacobs and Munis2019). This contributes to a recognition that caring for the health of the environment is a responsibility passed down through generations. Existing research finds that rural Americans demonstrate a deep connection to nature and prioritization of environmental stewardship over the long-term (Freudenburg Reference Freudenburg1991; Hamilton, Colocousis, and Duncan Reference Hamilton, Colocousis and Duncan2010), suggesting that rural voters may be inclined to support environmental protection initiatives and policies. The focus of this study is understanding how both of these seemingly conflicting themes can co-exist as components of rural identities and inform unique perspectives on environmental policy preferences among this important group of Americans.
One cannot deny that rural America is increasingly diverse—representing many different industries, geographies, income levels, lived experiences (Ajilore and Willingham Reference Ajilore and Willingham2019). Despite this growing diversity, the limited studies of rural environmental attitudes show that rural perspectives on environmental issues are surprisingly consistent across geographies and industries (Lowe and Pinhey Reference Lowe and Pinhey1982; Milbrath and Sahr Reference Milbrath and Sahr1975). A shared rural identity remains salient and informs attitudes and behaviors that are consistent across rural geographies, industries, and communities.
Building on the insights of scholars who have investigated how rural identities drive political attitudes, this study explores how aspects of rural identities drive environmental policy attitudes. Through qualitative research across the United States—105 individuals across focus group (70) and interview (35) settings from twenty-five states across the country—I document shared experiences and perspectives that inform rural identities and how they explain this population’s attitudes towards the environment and environmental policies. In what ways do rural identities drive environmental attitudes and policy preferences? How can this understanding help policymakers and policy communicators better engage rural Americans on environmental policy issues?
In the following sections, I first review the existing literature on rural identities and environmental attitudes and discuss how the prior may inform the latter. I present two theoretical approaches to understanding rural identities and their effects on political and environmental attitudes. I then describe the methods used to investigate the primary research questions, and how they provide useful insight into the broader connection between rural identities and environmental attitudes. I follow with a presentation of the findings from focus groups and interviews with rural voters across the United States. Discussions with the participants highlighted four primary components of rural identities—connectedness to nature, resentment/disenfranchisement, rootedness, and self-reliance—that informed unique rural perspectives on environmental policymaking. I conclude with a discussion of implications of rural identities for environmental political scientists, policy makers, and communicators.
Background
Identities are important drivers of political attitudes and have been shown to be powerful predictors of environmental policy preferences (Clayton Reference Clayton, Clayton and Opotow2003; Clayton and Opotow Reference Clayton and Opotow2003; Stets and Biga Reference Stets and Biga2003). Rural identities, a form of place-based identities, can inform unique political and environmental attitudes. In this section, I review the relevance of identities, and specifically rural identities, in determining policy attitudes. I then describe two strands of existing literature that inform our understanding of how rural identities may drive environmental policy attitudes—in conflicting directions.
Identities as Drivers of Policy Attitudes
Social identities are psychological constructs that define who we are and how we see ourselves in the world. Specifically, we determine our social identities by the groups that we belong to (in-groups) and how we differentiate ourselves from groups to which we do not belong (out-groups) (Mead Reference Mead1934; Tajfel et al. Reference Tajfel, Billig, Bundy and Flament1971; Tajfel and Turner Reference Tajfel, Turner, Worchel and Austin1986). The formation of social groups is an important part of human nature that helps us make sense of the world, ourselves, and our place in it (Tajfel et al. Reference Tajfel, Billig, Bundy and Flament1971). A multitude of research has found that humans will align themselves into groups and discriminate against other groups based on small, often laboratory-generated distinctions (such as affinity for a certain painting or likelihood to over- or underestimate how many dots are on a page) (Abrams Reference Abrams1985; Brewer Reference Brewer1979; Tajfel et al. Reference Tajfel, Billig, Bundy and Flament1971).
Social identities are becoming increasingly relevant in modern American politics as drivers of political attitudes and behaviors (Green, Palmquist, and Schickler Reference Green, Palmquist and Schickler2002; Huddy Reference Huddy2001; Mason Reference Mason2018). The concept of group consciousness and linked fate (Dawson Reference Dawson1995) connects identification with a group to political awareness and commitment to collective action on behalf of the group itself, informing shared political attitudes and participation (Miller et al. Reference Miller, Gurin, Gurin and Malanchuk1981). While partisan identities tend to be the most prominent drivers of political attitudes, other identities, such as racial, religious, or place-based identities, can also inform political attitudes over and above the effects of partisanship (Diamond Reference Diamond2020; Greenlee Reference Greenlee2014; Huddy Reference Huddy2015; Klar Reference Klar2013, Reference Klar2014). Identities are a useful way to conceptualize how distinct groups form political attitudes and can help us understand the roots and contexts of policy preferences. Additionally, recognizing the identity-based drivers of political attitudes can help political scientists predict how members of certain identity groups may perceive and react to different policy formulations and messages.
Rural Identities
As America faces a growing urban-rural divide, one type of identity is growing in political importance: rural identities. In some ways, rural identities are a form of place-based identities—an individual’s sense of place as part of how they conceptualize themselves (Stedman Reference Stedman2002). The attachment that individuals feel towards the place that they live expands beyond simply geographic location, including the physical setting, human activities, and social interactions rooted in the physical setting of home (Brandenburg and Carroll Reference Brandenburg and Carroll1995; Relph Reference Relph1976, Reference Relph and Hanson1997). As described by Ryden, “identity is a crucial component of place: through extensive interaction with a place, people may begin to define themselves in terms of … that place, to the extent that they cannot really express who they are without inevitably taking into account the setting that surrounds them as well” (Ryden Reference Ryden1993, 76). There is some evidence that place attachment drives political attitudes more strongly among rural voters than urban voters. Jacobs and Munis (Reference Jacobs and Munis2019) find that place-based appeals influence political decisions more strongly among rural than urban voters.
Rural identities, however, are more than just an attachment to place. They represent a cultural identification with other individuals living outside of cities through shared experiences and cultural values. As Ching and Creed described, “people live the rural/urban distinction through mundane cultural activities such as their selection of music (country versus rap) and their choice of clothing (cowboy boots versus wing tips)—means through which identity is commonly expressed” (Ching and Creed Reference Ching, Creed, Ching and Creed1997, 3). Alkon and Traugot (Reference Alkon and Traugot2008) described how people in rural areas use “place comparison”—negatively characterizing urban places to maintain differences between them—to emphasize their own identities as rural.
Social sorting, the process through which people increasingly sort themselves geographically and socially into homogenous identity groups (Mason Reference Mason2016), contributes to the increasing political salience of rural identities. As people in urban and rural areas share fewer and fewer overlapping identities, the differences between the two groups become more apparent, and physical location becomes an increasingly important part of one’s identity. A 2017 poll found that rural Americans strongly identify as a group that is different from urbanites or suburbanites, and nearly seven in ten rural residents said that their values differ from those who live in big cities—over 40% said that they were very different (Washington Post-Kaiser Family Foundation 2017). These perceived differences lead rural Americans to more closely identify with other people who also live in rural areas.
Rural Resentment and Political Attitudes
Recent research has begun to investigate how rural identities drive political attitudes in unique ways, specifically by focusing on how rural Americans feel disengaged with and resentful towards government and elites. Cramer (Reference Cramer2016) described the process through which rural identities inform political attitudes through the emergence of a “rural consciousness,” which can drive political preferences over and above the effect of partisanship. She described rural identity as “much more than an attachment to place … a sense that decision makers routinely ignore rural places and fail to give rural communities their fair share of resources, as well as a sense that rural folks are fundamentally different from urbanites in terms of lifestyles, values, and work ethic” (Cramer Reference Cramer2016, 5). This sentiment is further documented by Robert Wuthrow, who found that rural Americans often feel that Washington is distant, both geographically and culturally (Wuthrow Reference Wuthrow2018). “As far as (rural Americans) can see, the federal government hasn’t the least interest in trying to understand rural communities’ problems, let alone do anything to fix them” (Wuthrow Reference Wuthrow2018, 98). This has led to a sense of being left behind by the nation’s social and economic policies, a resentment towards urban elites, and a perceived threat to the cultural values that ground rural communities.
This is paralleled in Hochschild’s (Reference Hochschild2016) ethnographic study of rural Louisiana that described rural citizens feeling like they are the only ones working hard while other groups progress faster due to government support. This sentiment reflects a core value of rural America, that of self-sufficiency and independence (Bostrom Reference Bostrom2003; Institute of Medicine (US) Roundtable on Environmental Health Sciences, Research, and Medicine Reference Merchant, Coussens and Gilbert2006). The remote geographic location of many rural communities necessitates self-sufficiency and tight-knit communities, avoiding reliance on the government or outside groups. This self-sufficiency combined with feeling “left behind” leads to skepticism of the government, “urban elites” and minorities, favoring local governance and opposing social welfare programs that they view as giving others a free ride.
Rural resentment can also be tied to growing opposition to the “nationalization” trend occurring in modern American politics (Allott Reference Allott2020), where politics seems to be increasingly discussed on the national scale, even though the policies that tend to have the biggest impacts on individuals’ day-to-day lived experiences tend to be decided by more local institutions (Drutman Reference Drutman2018). For rural communities, the focus of nationalized political discussions tends to be on large metropolitan areas, ignoring the issues occurring in rural locales (Munis Reference Munis2021; Wuthrow Reference Wuthrow2018). This contributes to the sense of disconnect, disenfranchisement, and resentment. Munis (Reference Munis2020) developed a scale of place resentment, defined as a hostility towards place-based outgroups perceived as enjoying undeserved benefits. Results showed that rural Americans tended to show higher levels of place resentment than urban Americans.
Racial resentment among rural Americans is also an important undercurrent of this research. Although growing in diversity, rural America remains predominantly white—78% of rural America is white/non-Hispanic, compared to 64% of the national population (US Census Bureau 2016b), and many of the sentiments of rural resentment discussed earlier may be attributable, in part, to racial resentment. Hochschild specifically documents how white rural Americans with whom she spoke were frustrated by the handouts and special treatment that appeared to allow urbanites, immigrants, and communities of color to “skip the line” and move ahead while (predominantly white) rural Americans were continually pushed to the back of the line (Hochschild Reference Hochschild2016). Wuthrow also documented frustration in rural communities that minorities and immigrants were receiving handouts that the white members of the community were not (Wuthrow Reference Wuthrow2018). Considering the role that racial attitudes may play in rural resentment is also important for environmental issues, the most disproportionate impacts of which tend to disproportionately affect communities of color.
These aspects of a rural identity may color rural Americans’ preferences for environmental policies in a way that extends beyond the typical divides of partisanship. A sense of feeling left behind by the government leads to disdain towards environmental regulations and a preference for more power to be given to corporations or private individuals (Cramer Reference Cramer2016; Hochschild Reference Hochschild2016). Alkon and Traugot (Reference Alkon and Traugot2008, 97) found that rural communities in their study feared that heavy regulation would threaten the rural character—they believed that the rural area’s “pragmatic, trustworthy residents can solve local problems without government regulation,” rural opposition to environmental policies. Wuthrow also documented a sense in rural America that Washington was a big bureaucracy, applying one-size-fits-all solutions that don’t meet the needs of rural communities, and forcing environmental regulations on rural America without providing the necessary financial support to implement them (Wuthrow Reference Wuthrow2018).
Rural Environmental Concern
While existing literature on rural resentment suggests opposition to regulation and environmental policies, another strand of literature suggests that rural identities may inform greater concern about environmental issues and support for conservation measures. This is due in part to rural Americans’ close interactions with nature and reliance on it for their livelihoods, but also a sense of legacy and stewardship that rural Americans feel towards the places they live.
Rural Americans tend to have a deep connection to place, having often lived in a particular area, or even a specific farm, for generations. A recent survey of rural and urban Americans found that 60% of rural voters strongly agreed that the area they live in is an important part of who they are, compared to 40% of urban and suburban voters (Bonnie, Diamond, and Rowe Reference Bonnie, Diamond and Rowe2020). There is a robust literature finding that strong place attachment predicts pro-environmental attitudes and behavior, particularly an attachment to natural spaces (Daryanto and Song Reference Daryanto and Song2021; Scannell and Gifford Reference Scannell and Gifford2013). Brehm, Eisenhauer, and Kranich (Reference Brehm, Eisenhauer and Krannich2006) found that place-based factors were more predictive of environmental concern than other sociodemographic variables. Individuals with attachment to a specific region or community are more likely to support protected area policies (Carrus, Bonaiuto, and Bonnes Reference Carrus, Bonaiuto and Bonnes2005). Research has also found that place identity—over and above place dependence (reliance on the physical geography for livelihoods)—informs environmentally-responsible behavior (Vaske and Kobrin Reference Vaske and Kobrin2001). In rural communities specifically, place and community attachment have been identified as the strongest predictors of pro-environmental behaviors (Takahashi and Selfa Reference Takahashi and Selfa2015).
Living in a rural area may better predict an individual’s likelihood to undertake behaviors in line with pro-environmental attitudes, compared to those living in urban areas (Berenguer, Corraliza, and Martín Reference Berenguer, Corraliza and Martín2005; Bunting and Cousins Reference Bunting and Cousins1985; Hinds and Sparks Reference Hinds and Sparks2008). Hamilton, Colocousis, and Duncan (Reference Hamilton, Colocousis and Duncan2010) found that individuals in rural areas were more likely to support restrictions on development and also were more concerned about conserving resources for the future than were non-rural Americans. Others have found that rural communities are supportive of environmental protection policies, particularly if messages about such policies are crafted in language consistent with rural identities and values (McBeth and Foster Reference McBeth and Foster1994). Rural students who were exposed to a place-based stewardship education experienced increases in environmental sensitivity and environmentally-responsible behaviors (Gallay et al. Reference Gallay, Marckini-Polk, Schroeder and Flanagan2016).
Taking the established research into consideration, this study links what we already know about rural identities and political attitudes to the environmental policy realm. Existing literature on rural identities and political attitudes suggests that these communities may be opposed to environmental regulations, distrust the government, and prefer self-reliant or community-based governance systems. Meanwhile, the literature on environmental attitudes shows that individuals from rural areas exhibit a distinct conservation ethic and potentially deeper concern about the environment than urbanites. While attitudes towards environmental regulation and environmental conservation should not be conflated and may exist simultaneously within an individual, they do suggest divergent environmental policy preferences. By looking more closely at the components of rural identities that inform environmental attitudes, we can gain a deeper understanding of the nature of rural environmental policy preferences and understand how to better engage rural populations in effective and fair environmental and conservation policies.
Sample and Methods
Identities, while inherent in human nature, rarely penetrate the conscious mind. Different from demographic or even attitudinal information, identities as mechanisms that inform political attitudes can be difficult to measure in a quantitative way. Furthermore, rural identities may be less salient than other more commonly discussed identities, such as racial or gender identities. Qualitative research methods can be helpful when trying to elucidate how people think, how they act, how processes unfold, or to understand general mechanisms. For this topic, qualitative research allows us to understand the drivers and nuances of rural identities and their implications on environmental policy preferences that survey data alone may miss. Given this, the data for this study was collected through a series of focus groups and semi-structured interviews conducted with American voters living in rural areas from 2018–2019.
Focus Groups
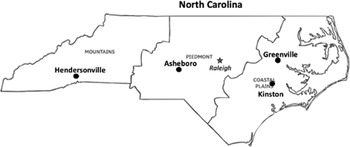
Eight focus groups were held in southeastern and western states. The first four focus groups were held in 2017 and 2018 in select rural locations in North Carolina. North Carolina offers a useful place to investigate both rural identities and environmental attitudes due to its diversity in geography, economic industries, and regional cultures. North Carolina is one of the most “persistently rural” states in the nation, with 59% of its municipalities having 2,500 people or fewer (Stanford Reference Stanford2017). Of the top ten most populous states in the country, North Carolina has the largest proportion of individuals living in rural areas (Tippett Reference Tippett2016). Four in-person focus groups were held in rural-adjacent cities across the state (see figure 1): Greenville (November 13, 2017), Asheboro (November 14, 2017), Hendersonville (July 18, 2018), and Kinston (July 19, 2018), with participants recruited from the surrounding rural areas. Due to the difficulty of reaching rural Americans to participate in a research study, a bipartisan partnership of national public opinion research firms, Hart Research Associates and New Bridge Strategy, was contracted to recruit the participants and facilitate the focus groups.
Map of North Carolina focus group locations

Following the North Carolina focus groups, four telephone focus groups were held in June 2019 with rural voters in Colorado, Montana, Nevada, and New Mexico. These additional focus groups incorporated the perspective of a broader swath of rural Americans, with an emphasis on the rural west due to funding priorities and the assumption that the rural western experience is quite distinct from the rural southern experience.
Focus group participants (n=70) were recruited from voter lists in rural zip codes from either the surrounding area (North Carolina city-based focus groups) or the state as a whole (CO, MT, NV, NM).Footnote 1 Participants were asked a series of screening questions to ensure that they lived full-time in the area; had not recently participated in a focus group on current events, politics, or the environment; were not (and did not have family members that were) employed in media, government, or environmental industries; and were not active military personnel.Footnote 2 Participants were involved in a variety of rural industries, including farming, forestry, and livestock management, as well as manufacturing and commerce. The focus groups were audio recorded, lasted approximately two hours, and participants were compensated. Participants were asked questions about their experience and identities living in rural communities, their perspectives on environmental and conservation issues, perceptions of environmental groups and messaging on environmental policy, and perspectives on climate change. The focus group guide is included in the online appendix.
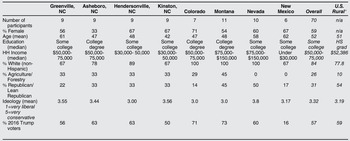
Table 1 summarizes the demographics of the participants of each focus group, the focus group participants overall, and average U.S. rural demographics for comparison purposes. The demographics of the focus group participants were similar to the U.S. averages for rural areas (as defined by the U.S. census). This sample was slightly more educated, slightly whiter, and included slightly more individuals working in agriculture or forestry than the national rural average. Politically, these participants tended to identify less as Republicans than the national rural average but reported being slightly more ideologically conservative. This is due in part to the fact that the majority of the participants, although politically conservative, identified as independents instead of Republicans or Democrats.
Demographics of focus group participants

* U.S. rural statistics presented for reference. Data from 2012–2016 American Communities Survey (U.S Census Bureau 2016a) and Pew Research Center (Parker et al. Reference Parker, Horowitz, Brown, Richard Fry and Igielnik2018)
Semi-Structured Interviews
To incorporate participants from a broader national geographic representation, the focus groups were supplemented with targeted interviews with rural stakeholder leaders. These semi-structured conversations with individuals who are embedded in rural communities provided an additional opportunity to capture more diverse perspectives of people managing natural resources in rural areas.
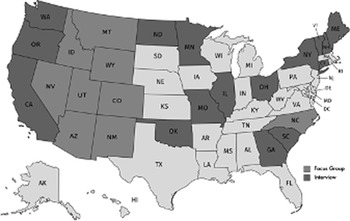
Interview participants (n=35) were identified through research team contacts, with an effort to include participants from seven distinct groups: elected county officials (2), agriculture stakeholder leadersFootnote 3 (20), forestry stakeholder leaders (6), rural business leaders (1), conservation/hunting/fishing leaders (2), African American landowners (2), and Native American tribal leaders (2). These categories were identified through conversations with experts in rural stakeholder engagement. Eight of the interviewees (23%) were female. Interviews were held both over the phone and, where possible, in person from May–October 2019. Interviews were recorded and lasted between forty-five minutes and two hours. Participants were asked similar questions as in the focus groups, with an emphasis on understanding rural identities and perspectives on environmental conservation policies. The semi-structured interview guide is included in the online appendix. Interviewees came from the following states: California, Connecticut, Georgia, Idaho, Illinois, Maine, Minnesota, Missouri, New Hampshire, New Mexico, New York, North Carolina, North Dakota, Ohio, Oklahoma, Oregon, South Carolina, Vermont, Washington, and Wyoming. Figure 2 shows all the states represented in the interviews and focus groups.
Map displaying the states represented in the focus groups and interviews

Analysis
The goal of this study was not necessarily generalizability through hypothesis testing, but theory building to improve our understanding of rural identities and how they inform environmental and conservation policy preferences. To this end, data analysis was done using inductive thematic analysis of the focus group and interview transcripts using NVivo12 qualitative data analysis software. Thematic analysis allows the researcher to identify, analyze and report themes common across the focus groups, and is particularly helpful in cases when the goal of the research is to explore a previously under-researched topic (Braun and Clarke Reference Braun and Clarke2006). I reviewed the transcripts to develop an inductive node structure coding evidence of rural identities and the nature of differentiation from urbanites or connections to other rural Americans. Following this inductive process, I identified four major themes that repeatedly surfaced as components of rural identities and recoded the transcripts to identify references to the four components and how those components influenced environmental policy attitudes. The final coding structure is included in the online appendix.
Findings
Conversations with study participants consistently suggested a sense of group identification and shared fate—a sense of commonality and shared circumstances (Sanchez and Vargas Reference Sanchez and Vargas2016)—between rural Americans, even those who live several states away. Most participants agreed that they had values and priorities that differed from people living in more urban areas, and that shared worldview contributed a sense of social identification with other rural Americans. As one interviewee from California described, “I don’t think we all belong to the same church or go to the same school or have the same social life, but we can all identify with our community … and rural America.” Participants described this shared identity in many ways, but four key themes emerged as unifying components of a modern rural American identity: connectedness to nature (close interaction with and reliance on the natural world); disconnectedness/resentment (feeling left behind or cut out from major governance/decision making processes); rootedness (a deep connection to their land and communities, strong sense of place); and self-reliance (a sense of independence and pride in their ability to fend for themselves). Each of these components of rural identity informed the overall perspective of rural Americans on environmental policy issues.
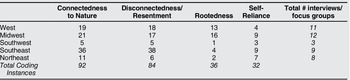
The prevalence of these four identity components were fairly consistent across regions, suggesting a universal rural identity across the varied regions and communities that make up rural America. The focus groups and interviews were not analyzed separately; however, both sources of data presented evidence for all four components described later. When considered quantitatively, two of the components—connectedness to nature and disconnectedness/resentment—were more prevalent than rootedness or self-reliance. However, this may in part be due to the structure of the interview and focus group guides that focused on these sentiments, as informed by prior research on rural identities. Table 2 shows the prevalence of coding instances (single mentions) for each of these components among the focus groups and interviews across regions.
Count of unique coding instances for each component by region (interviews and focus groups combined)

Connectedness to Nature
Rural participants described a deep connection to the natural world and a sense that this made them unique from other, non-rural citizens. This deep connection resulted both from more direct experience with nature as well as an economic and livelihood dependence on the environment. “We’re more in touch with the environment than someone who lives in a concrete high-rise in Raleigh or Charlotte,” described one focus group participant in Greenville, NC. In general, participants felt that the environment played a larger role in the lives of people in rural areas, and therefore they were more tuned into the needs of the natural environment than those in urban areas. As one participant in the Kinston, NC, focus group mentioned, “Rural people are closer to the earth … people in urban areas are more concerned about their careers, working out at Planet Fitness, and what smoothie they will have today…rural people, they got dirt underneath their fingernails.” Another Kinston, NC, participant focused on how people in rural areas have a better understanding of natural processes, noting that “people in urban areas, they don’t understand what it takes to grow food. If you’re rural, you’re growing something.”
This direct experience made environmental changes top of mind for rural Americans. “We’re more connected to nature just because it’s more readily available, as opposed to someone in a city that has to drive somewhere out of town to connect with nature,” said a Nevada focus group participant. In Asheboro, NC, a focus group participant who had not grown up in a rural area commented that “Before I married into the farm, I was that suburbanite, I had no clue what was going on. In the last five years, I can see when fall gets here in the middle of July, I couldn’t see that before. Most people think fall doesn’t get here till November, now it starts in July.”
These experiences not only differentiated rural participants from urbanites, but gave them a shared sense of pride that their lifestyles were more natural and less tainted by human impact than those of people in urban areas. For example, one focus group participant in Hendersonville commented on how urban dwellers who lived on bottled water were out of touch with the natural state of water from the ground:
I grew up country living and didn’t even know there was other water besides well water. So at the age of six when I tried bottled water for the first time, I told my mom, something doesn’t taste right. She said ‘no, water is water.’ But I could taste a difference. So living in a farm area that is untouched is different than coming to a city where everything has been touched by man.
Others criticized people in urban areas for not knowing where their food comes from. As one participant in Asheboro, NC, said, “Years ago, when I was in college, there was a kid in my class. He literally believed that corn grew in a can [others laughing]. Seriously. There was no laughing about it. That’s what his momma and daddy said. They’d never seen a corn field or nothing.”
The fact that many people in rural communities rely economically on the environment and natural resources also made connectedness to nature a core part of their identity. While only one-quarter of the focus group participants worked directly in the farming and agriculture industries, most participants felt connected to these industries through family or other community members. Agriculture was a universal experience in rural areas: “Even if you do have a city job, I guarantee you have siblings or parents or cousins that are on a farm or working directly in farm service,” said an interview participant in Missouri. This connection made rural Americans especially attuned to the needs of the environment and the direct effect that their actions can have on the health of natural resources. “I think if people’s paychecks are dependent on how well they managed resources, we wouldn’t be near as wasteful as we are. I’m not pigeonholing city people as being wasteful … but that’s something you try to be cognizant of [in a rural area]. I think when you deal with that and it’s your bottom line that’s affected, it just puts a little more emphasis on it maybe,” said an interview participant in California.
This deep connection to nature led rural participants to recognize that their actions and behaviors have a direct impact on the health of their natural environment, and subsequently, environmental health has a direct impact on their welfare. “Our entire community’s foundation is built on the environment and natural resources,” said an interview participant in Georgia. This sense of environmental stewardship was heard consistently throughout the conversations with rural participants. Participants realized that if they don’t take care of an asset, it won’t be worth anything in the future. “I think the biggest misconception is that sometimes people don’t understand the rural life of farmers. We’ve got to make a living off this land every year, so we got to take care of it,” said an interview participant in Illinois. As an interview participant from Oregon said, “The people that live in these communities absolutely love these lands and they’re not looking at them as a short-term place. They know that these lands are going to be their livelihood for not only their generation but for their children…They know they need to manage the lands in a sustainable manner.”
Disconnectedness/Resentment
A second component of rural identity was a sense of disconnectedness from government decision making that resulted in a resentment of government and regulations, as well as resentment that rural communities were being left behind economically. This led to a disillusionment about government (seen as ignoring their needs), a distrust of elites and environmental groups viewed as more closely associated with urbanites, and an overall skepticism of government regulations and policies that they felt were not designed with them in mind.
At the beginning of the discussions when the participants were asked about their overall level of satisfaction with “how things are going for their communities,” many participants highlighted the difficulty they have been having with keeping up with increased costs and fewer job opportunities in their areas. The conversation in the Asheboro, NC, focus group rested on how reliant people in rural areas are on the whims of large industries that locate in the region. A large car manufacturing plant opened several years ago in the region, creating an economic boom, but then a few years later it shuttered its doors and the area has had a difficult time recovering due to lack of opportunities. Participants often reported feeling like their way of life was eroding as economic opportunity declined and people left rural areas for job opportunities elsewhere. When asked what keeps him up at night, an interview participant from Idaho emphasized the “ability to maintain the rural communities, schools, way of life, culture. I’ve watched numbers in rural schools spiral downward—this is the heart and soul of our community.”
Participants also shared their difficulty in keeping up with increased costs as wealthier outsiders moved into their areas. This was particularly relevant in Hendersonville, NC, where the Blue Ridge Mountains are increasingly attracting new residents from all over the country. As one Hendersonville participant shared,
I guess for me, just seeing how the over-wealthy coming in, and I don't knock anybody for making the money that they deserve to make, but that movement coming is also bringing in people that want to build apartment homes or houses that fit their income.
Just lately, there was a housing development for people with low income that was completely torn down. Everybody was kicked out and told they don't care what you do, you just got to go because they ultimately wanted to flip that into something they can make a profit off of it. Seeing that happen is—it's unfortunate.
Contributing to the tension between urban and rural Americans, many rural participants felt disproportionately blamed for environmental problems. An interview participant in Illinois described how rural communities are tired of getting a bad rap for not thinking about and considering the environment, when in reality that’s the crux of their activities:
I think the biggest misconception, and I'm talking for small farmers and large farmers, is we're out here just raping and pillaging the soil and working it to death and not taking care of it. That's sometimes what I think people in urban areas think of us, but you wouldn't be on this land for 150 years if you didn't take care of it and weren't concerned about the environment. We drink the water out of the wells dug on these farms, it's not like I want to drink a lot of crap.
Other participants also emphasized how they felt environmental groups villainize farmers. “Farmers read the things that the groups say, and they are very upset about the way that environmental groups portray a farmer. Makes them seem evil,” said another Illinois interview participant. Instead, the participants emphasized how rural individuals can make a much bigger impact on environmental outcomes, but that it is more costly than for people living in urban areas, and this fact isn’t accounted for in policymaking. As one interview participant in Georgia described,
If you're in Atlanta or New York, there's not much you can do [for the environment] other than recycle and drive a Prius and use curly light bulbs. But if you are farming 32,000 acres of land, you can make a huge impact, but it comes at an enormous cost. The farmer in Bluffton, Georgia, receives the same benefit from the environmental protection [as someone in the city], but the farmer bears way more burden for it, economic burden. That doesn't mean we shouldn't do it, but it means there's a huge disparity in who would pay for changing the way we have historically operated for the last 80 years.
From a political perspective, most participants emphasized a resentment that they were not part of the policymaking process, and that policies are too often done to them and not with or for them. “Rural America is just left behind honestly … we’re just forgotten about. We’re not the [biggest] voting population, so there’s really no need to push to make sure that we are happy,” said an interview participant from California. There was generally a distrust of politicians and the federal government as well. As one Asheboro, NC, participant stated, “the representation we have both locally and in Washington is catering to their own needs or whatever special interest group is in front of them.” Similarly, another Asheboro participant added that “sometimes you’ve got people sitting up there in Washington that have never set a foot on a farm sitting there making these policies.”
Rural Americans tend to want to protect and preserve the environment, and they have many ideas about how best to do so. However, most participants could describe an experience where they felt environmental regulations were imposed on them with almost no engagement or input. These types of policies seemed to come down from Washington without thinking through the implications for the impacts and experiences on rural communities. Similarly, environmental groups that bring lawsuits or other attacks on rural communities created significant animosity among rural participants towards these organizations when no attempt was made to work within the communities to solve the problem first.
Subsequently, rural participants voiced a sense of fatigue of governments telling them how to live their lives. They viewed lawmakers as people living in urban areas who have no idea what is important to rural communities, coming in and implementing laws and regulations that don’t match up with the needs and knowledge of rural communities. “That’s what is irritating, because we’re the ones who bought the land. We’re the ones paying the taxes on it and feel we’re the best to preserve it. But somebody’s going to tell us, that’s never set foot on that land, what is best for us. That is where the resentment comes in,” said one interview participant from Illinois. As he further described,
I think what bothers farmers the most is when the government comes in and says “You’re going to have to do it this way because we have found out that this is a better way” and it might be in conflict with what we feel is a better way and something that is working. All of a sudden, we’ve got some bureaucrat telling us, that has never stepped foot in our county, what’s best for us … We’re fine. We’re doing okay. We’re doing things over, above, and beyond what you’re trying to regulate us to do.
Meanwhile, participants did praise agencies and policymakers that have “boots on the ground” and take the time to understand the experiences of rural communities. There were numerous examples of positive sentiments towards agencies like the Bureau of Land Management and local governments that spend time in rural communities and collaboratively engage in finding solutions to environmental policy problems. Similarly, many interview participants specified that there are certain environmental groups that they trust and want to work with—those that engage with the rural communities, and prioritize working together to find solutions, instead of taking a combative approach.
Rootedness
The third most prevalent identity theme across rural participants was a strong rootedness and sense of place. Rural Americans often have deep emotional and identity ties to their physical location. For many, this unique sense of rootedness was due to long generational history in one place and corresponded to a deep pride and sense of responsibility to maintain the health of their land and communities. An interviewee from Oregon described the deep connection he felt to his land: “It’s something that you feel close to your heart. That this is some place that I love and I want to protect and make sure we have it forever.” A Native American interview participant from Washington felt the same way: “We can’t just sit there and destroy our land, and we can’t just pick up our reservation and move it a hundred miles north or take it to New Zealand. We have to live with those consequences.”
The sense of rootedness was formed in part by a deep connection to, and reliance on, rural communities. “A core value of rural Americans is a sense of community, a sense of belonging,” said an interview participant in Idaho. Being somewhat isolated, rural Americans have to rely on their neighbors and community for day-to-day support. One interview participant from California told a story of a family member who had opposing political views from others in their community. For them, “it became really clear that they better be friends with their neighbors regardless of their political views because if something happens, those are the only people that are going to come out here. I think that rural America, in general, still follows that.” This sense of community directly informed a sense of shared stewardship of the land and resources, and a sense that everyone in the community is connected to each other. “If a neighbor has a medical issue and crop to harvest, it’s not unusual for all the neighbors to stop their own harvest, go to the field, harvest, take it to market, and make sure they sell that neighbor’s things first … this just is not the same in urban areas,” said an interview participant in Illinois.
Participants also reflected on how people in their area tended to have been there for generations, cultivating deep personal ties to the land. “We can’t pick up our farm and move it,” described an interview participant from Illinois. Most of the participants lived with their extended family members, and many on land that had been in their families for generations. One participant was a teacher and described how the same families cycle through the schools, generation after generation: “We’re a legacy school. We’ve got teachers that had the principal as their teacher. Parents of current students will come in for a meeting with me, and the principal will recognize them from when they taught them. We see a lot of the same people and families over the years.” Participants contrasted this experience with that of people living in urban areas that they perceived as more transient and less committed to their geographic surroundings.
The generational ties that many rural Americans feel toward their land translated to a commitment to care for the environment because of a responsibility to past and future generations. “There is this stewardship ethic, this conservation ethic, that’s been passed down from generation to generation, and that also goes back to faith, because we certainly feel like we’re just stewards of what we have right now. The land is not ours, we’re just borrowing it, and we’re responsible for it right now until we have the chance to pass it to the next generation,” said an interview participant from Georgia. Rural Americans are motivated to take care of their natural environment because they recognize it is among the most important things that they can pass down to future generations. “I think the strongest bond that farmers have with the land is that it’s been part of their family for so many years,” said an Illinois interview participant. “They’re interested in handing their land down to the next generations. They don’t want to put an anchor around the next generations’ neck with something that is just an expense to them and not producing any kind of income,” said an interview participant from Georgia.
Rootedness also translated into high levels of concern for the health of local environmental resources as opposed to more global environmental issues. During the focus groups, participants were given a list of eleven environmental problems and asked to rank the two they felt were the most important to address. Participants consistently prioritized issues that they felt they could personally see the impact of—such as clean air and clean water—as more urgent than more global issues such as climate change. In general, in both the focus group and interview discussions, participants seemed primarily concerned with the health of their local environment and issues that they experienced on a daily basis. “It’s inevitable that you’re going to look locally, because that’s where you live. That has the most direct impact on you … . Take care of your house first,” said a focus group participant in Hendersonville. Another participant in Hendersonville echoed this sentiment, “You should definitely fight local first, before going on a global scale, because if things aren't in order locally, you can't do anything about it globally.”
Self-Reliance
While rural participants demonstrated a strong sense of rootedness and connection to community, they also expressed core values of individualism and self-reliance. Several of the participants described valuing self-reliance and being able to take care of themselves and their families without the interference of other people and government. “I think we’re more independent and self-sufficient (than people in urban areas). I mean, in my small town, we look after each other, but we give each other space,” said a Colorado focus group participant. “There’s an expectation that you got to take care of yourself. You can’t have society take care of you. You got to figure it out yourself, or your family’s got to figure it out for themselves,” said an interview participant in Illinois.
This emphasis on self-reliance and individual responsibility contributed to a reticence towards government regulations and policies. Several participants emphasized that in rural America, individual values such as integrity matter more than the policies and regulations put in place. “I don’t think it’s possible to pass enough laws and regulations to give people integrity. And all of these things are being damaged because people don’t have integrity. They don’t even know what the word means. I don’t know how you put a law on that. Well, I guess I’m not for laws and rules,” said a focus group participant in Montana. However, some participants also highlighted a false dichotomy when it comes to rural Americans’ sense of self-reliance. An interview participant from Ohio identified a disconnect between rural values of self-reliance, and the reality that many farmers in America are actually highly dependent on government assistance. “Independence is a core value of rural Americans, this idea that ‘I’m independent, I run my own show, I don’t depend on anybody.’ But in reality, it’s not true. All farmers have loans.”
A major implication of this component was a desire for freedom and autonomy in how rural Americans live their lives and manage their land. Multiple participants in the focus groups described how they chose to live in a rural area because of the peace and quiet, as well as the ability to live their lives independently. “I just think that a lot of people … who live in a rural environment mind their own business, kind of take care of their own thing,” said a New Mexico focus group participant. An interview participant in Maine also noted that “folks come to Maine because it’s rural and you can do whatever you want.” In the minds of rural Americans, they prioritize conservation but want to do so on their terms. As an Illinois interview participant described, “The sentiment for conservation [among our farmers] is great, but there is also a strong sense of independence. That they can make decisions on their own for their farms.”
The rural participants felt that they were the best people to make decisions about their land, and highly resented being told what had to be regulated or what they could or couldn’t do with their property. In many cases, families had been working their land for generations, obsessing over the health of their soil or their ability to maintain irrigation. With that experience comes, in the view of rural voters, an expertise in how to effectively conserve the environmental resources that they depend on. If they do something that threatens the health of their environment, “we have to live with those consequences. I think that’s a real important part of our message as a resilient culture,” said an interviewee in Washington.
These sentiments translated to a strong desire for autonomy in decision making about their land and local resources, particularly from people and organizations who share their identities and experiences. Many of the rural voters we spoke to were skeptical of regulations or information coming from “outsiders”: “We like to do things by our tried-and-true methods. We’re skeptical of new ideas,” said an interview participant from New Hampshire. This doesn’t mean that rural voters will not accept new information from anyone, however. Another interview participant described how messaging from trusted sources (generally local organizations who share a rural identity), such as their local co-operative extension or Soybean Association (or other trade association), can be effective at educating farmers and changing behaviors. As another interview participant mentioned, “People don’t like outsiders. Needs to be an inside group. People are hungry for information, but don’t want people telling them what to do.”
Discussion and Implications for Environmental Policymaking
The goal of this theory-building study was to elucidate and document how core aspects of rural identities inform distinct perspectives on environmental policy issues. Through in-depth qualitative research with a national sample of rural voters, I identified four components of rural identity—connection to nature, disenfranchisement/resentment, rootedness, self-reliance—that have distinct implications for how rural Americans view environmental policymaking. Building on previously conflicting lines of research on rural identities and environmental policy preferences, these components of a rural American identity have implications for how to design and communicate environmental policies to more effectively engage rural Americans in environmental conservation.
Rural participants’ deep connection to the natural world and rootedness to place translated into a strong sense of stewardship for the environment that is a highly motivating factor behind rural support for environmental protection. For most rural participants, taking care of the environment was of utmost importance for their livelihood and that of their future generations. This stewardship of the land and environment was a primary motivation for taking on environmental conservation efforts, and there is a significant opportunity to emphasize this value when trying to communicate environmental policies to rural Americans. Focusing on message frames that highlight environmental stewardship as a moral responsibility to future generations is likely to be effective among rural Americans.
Meanwhile, resentment towards outsiders and a strong sense that rural Americans know best how to manage their lands are key components of a rural identity that can be either roadblocks or steppingstones to effective environmental policy in rural areas, depending on how they are approached. Rural Americans tend to value when decisionmakers and environmental groups take the time to engage with the communities, to understand their experiences, and to observe their capacity to change. Policy approaches such as collaborative governance are likely to be most effective in these communities. Providing resource support for the implementation of environmental policies will also be important to gaining rural buy-in. And environmental groups should focus on spending time in the communities they are targeting, building relationships and trust among rural communities that will likely be far more successful than taking a combative, litigious approach.
Rootedness among rural communities also informed a prioritization of local environmental quality issues among participants. For policymakers, this has implications for how to craft and frame environmental policies in rural areas. Recognizing that the quality and health of local environmental resources takes precedence for many rural communities, policymakers should focus on working with these communities to build environmental protection from the local level outwards. Additionally, when messaging environmental policies to rural audiences, communicators will be more effective if they focus on the local implications of such policies, as opposed to the more diffuse and global impacts.
Finally, participants emphasized how important it is to them to be able to make their own decisions about what happens to their land and property, without the interference of others or the government. These findings emphasize the importance of designing flexible policies and regulations that allow rural landowners to customize their approach to managing natural resources. Policies that set overall limits but allow farmers flexibility in how they meet those limits, for example, may be more welcome than rigid command-and-control regulations. Similarly, policies that incentivize farmers to adjust their behaviors (but give them the autonomy to choose how to do so) will likely be more popular. Focusing on communicating these policies through trusted, local sources is likely to appeal to rural community members more than top-down policies that seem to come directly from Washington, DC.
While this study focuses on environmental policy preferences, there are numerous other social identities that inform overall political attitudes—and can often be more universally applicable to things like vote choice. While rural identities may inform a broad sense of environmental stewardship, such identities may take a backseat to more traditional political identities such as partisanship, race, or class. This study did not find evidence that the pro-environmental attitudes informed by rural identities changed overall political attitudes such as presidential vote choice, although investigating this relationship was outside the scope of this particular project. Future research should seek to understand how the interaction between potentially conflicting identities (such as, for example, a rural environmental identity and a Republican political identity) shape things such as vote choice.
The nature of this study also brings limitations and opportunities for future research. A first limitation is the sample size and the question of population representativeness. Despite efforts to identify rural participants based on census classifications, not all of the focus group participants reported living outside of city limits on intake questionnaires, which could confound conclusions about “rural” people (although all were recruited from rural zip codes). However, even individuals that lived inside the limits of small towns surrounded by rural areas shared a consistent perspective and differentiated themselves from people in more urban places. This allows for potential extrapolation of these findings to other Americans who don’t necessarily live in rural areas but align/identify with them culturally.
Another limitation of the sample is the emphasis in the interviews on individuals who work in the natural resource management field (farmers, forestry, etc.). While this is a major industry in rural America, such individuals who work directly with the environment for their livelihood may have different perspectives on environmental issues and policy than rural Americans who are not involved in such industries. This is an important consideration, and future research with larger samples should look into the differences in attitudes and perspectives based on rural voters’ livelihoods.
Additionally, while a strength of this study is its vast coverage of rural voters across America, the focus groups in particular overrepresented voters in southern and western states. To balance this regional bias in the focus groups, interviewees were purposely chosen to represent rural voters across U.S. regions. While the themes tended to resonate across regions without significant regional variation, it is important to note that the findings may be more reflective of voters in the western part of the United States than other regions that were less represented in the sample.
An important area of future research is to better understand racial differences in both rural identities and environmental attitudes. A criticism of much of the prior research of rural political attitudes is that it focuses primarily on the attitudes of white, working-class rural Americans. While the U.S. rural population is more than 75% white, racial and ethnic diversity is growing in rural areas. Additionally, rural racial minorities may have a much different relationship with and perspective on environmental issues. It is important, therefore, to understand whether the conclusions about rural identities and environmental attitudes presented in this research are universal among rural Americans, or whether they are specific to primarily white rural communities. Additionally, prior research (Hochschild Reference Hochschild2016; Wuthrow Reference Wuthrow2018) has identified undercurrents of racial resentment among rural Americans, but these studies, like the current study, were limited by the fact that they did not specifically ask about race and racial resentment. While suggestions of racial tensions did not emerge organically in the conversations in this study, the connection between racial resentment and environmental policy preferences is a ripe area for future research, particularly because environmental challenges tend to be felt disproportionately by communities of color (in both rural and urban areas).
Finally, this study focused on the idea of environmental policies broadly, and more specifically, the relationship between rural Americans and perspectives on the environment and conservation. However, environmental policy is a broad term, including issues from climate change to endangered species to water conservation—issues that impact rural communities in very different ways. With this study as a base, future research should look more closely at rural attitudes towards specific environmental policy issues, and how rural identities inform perspectives on individual environmental policies.
As rural Americans become an increasingly important part of the American electorate, engaging these communities on a variety of policy issues will grow in importance. On issues of environmental policy in particular, engaging rural audiences is highly important, as these communities tend to be at the center of many environmental policies. While this study helps conceptualize how aspects of rural identities may inform unique environmental policy preferences, more research is needed to further understand how rural identities drive a unique perspective on the environment. With these insights, we hope to identify new ways to better engage rural Americans in environmental policymaking.
Supplementary Materials
To view supplementary material for this article, please visit http://doi.org/10.1017/S1537592721002231.