How can we recognize and measure strategic voting in a large electorate? Although we may suspect that candidate or party viability influences voters' decisions in elections, it is difficult to show objectively when a voter does not vote sincerely. Moreover, strategic calculations may influence more than simply who wins a particular election. Duverger's law suggests that incentives for strategic voting may be responsible for the development of the national party system. While strategic behavior may occur and produce such effects, it is difficult to persuade a skeptical student without further evidence.
We designed a role-playing simulation for students in undergraduate classes to identify and to measure strategic voting. In the experiment, participants act as voters in a mass election. Each participant is given an ideological preference (ideal point), and the ideological positions of candidates/parties are assigned and fixed. The only new information introduced to participants during the experiment is the likelihood that each candidate/party has to win the election. Instrumental strategic voting can be shown to exist under the conditions of this election simulation.
For many voters, the source of information about the viability of parties or candidates is from shared information such as public opinion polls reported in the mass media. It is widely assumed that voters use horserace information as an evaluation of the likelihood that candidates and parties will be elected and alter vote choice accordingly. Demonstrating this phenomenon, however, can be difficult. Is it electoral viability that influences voter decisions? Or are there other factors responsible, such as more information on candidate issues, experience and personality, persuasion, group mobilization, political discussions, or other campaign effects? The experiment is designed explicitly to identify strategic voting.Footnote 1
THE IMPORTANCE OF STRATEGIC VOTING AS A CONCEPT
Our experience suggests that most students in a political science course have spent little time contemplating the impact of electoral rules on a country's party system or on voter choice. Most American students accept the two-party system as the norm without critical examination. Our students either find unquestioned contentment with the two-party system or attribute its existence to one of various nefarious political conspiracies.
Yet the tendency for plurality elections to produce strategic voting and two-party systems has a rich history in the study of electoral systems and behavior. Riker (Reference Riker1982) credits English mathematician and barrister Henry R. Droop as the first political observer to document a link between plurality voting and two-party systems. French scholar Maurice Duverger (Reference Duverger1954) identifies strategic voting as the link between electoral and party systems. Duverger explicitly proposes that a plurality system produces a psychological effect leading to strategic calculations of self-interest; wanting to avoid a wasted vote for a preferred, losing alternative, an individual will cast a ballot for a second or lower preference that is more likely to win. Although modified by Rae (Reference Rae1971) and others to account for strong regional parties, Duverger's law predicts that plurality elections should lead to two-party systems.
Strategic voting lies at the heart of Duverger's law. Strategic or tactical voting occurs when a person supports a candidate or party because a more preferred option is unlikely to win. One may distinguish between the term strategic voting used by American political scientists and tactical voting used by British political scientists. Tactical voting is a short-term action while strategic behavior involves a sequence of decisions (Fisher Reference Fisher2004).Footnote 2 Taking no position on this lexicographic debate, we use the terms interchangeably.
The concept of strategic voting is important for understanding theories of voting. Arrow's (Reference Arrow1963) possibility theorem sparked interest in strategic misrepresentation of true preferences. Independently, Gibbard (Reference Gibbard1973) and Satterthwaite (Reference Satterthwaite1975) demonstrate that the incentives for strategic voting exist for any voting system. Their results hold for behavior in mass electorates as well. For instance, information from public opinion polls may lead to strategic calculations based on viability and, ultimately, to two-party contests (McKelvey and Ordeshook Reference McKelvey and Ordeshook1985a; Fey Reference Fey1997).
The empirical literature on strategic voting is large and growing. Cox (Reference Cox1997) provides an excellent review and discussion of this literature. While scholars commonly acknowledge that at least some voters engage in strategic voting, reliable and valid measures are difficult to construct. Election returns from split-ballot systems such as in Germany and Hungary suggest strategic voting, but there may be other reasons that voters choose different parties on the two ballots. Survey research can tap into respondent explanations of vote choice. Yet there is considerable controversy over how to measure strategic voting accurately with survey data (Niemi, Whitten, and Franklin Reference Niemi, Whitten and Franklin1992; Reference Niemi, Whitten and Franklin1993; Evans and Heath Reference Evans and Heath1993; Heath and Evans Reference Heath and Evans1994; Franklin, Niemi, and Whitten Reference Franklin, Niemi and Whitten1994; Blais and Nadeau Reference Blais and Nadeau1996; Blais, Young, and Turcotte Reference Blais, Young and Turcotte2005; Alvarez and Nagler Reference Alvarez and Nagler2000; Evans Reference Evans2002; Alvarez, Boehmke, and Nagler Reference Alvarez, Boehmke and Nagler2006). Estimates of the incidence of strategic voting range from infrequent to often.Footnote 3
Research on strategic voting has centered on a small number of national elections, particularly Britain (including much of the measurement controversy above), Canada (Merolla and Stephenson Reference Merolla and Stephenson2007), and Germany (Gschwend, Johnston, and Pattie Reference Gschwend, Johnston and Pattie2003), although other studies examine American presidential elections (Hillygus Reference Hillygus2007) and new democracies (Tavits and Annus Reference Tavits and Annus2006). Most of the research confirms the notion that district rather than national party viability influences strategic considerations of voters (Lanoue and Bowler Reference Lanoue and Bowler1998).
Communicating the notion of strategic voting and its potential impacts to students in a simple and convincing manner can be difficult. We designed a voting simulation to satisfy two goals. Pedagogically, we wanted to design a classroom simulation that would show our students how strategic voting may influence the outcome of an election. Theoretically, we wanted to investigate the conditions under which strategic voting was more likely to occur. The simulation limits participants to two effective options: to vote sincerely for a most preferred candidate or to engage in tactical behavior in order to reduce the likelihood that a least preferred candidate will be elected. The results from applications of the experiment show evidence of both sincere and strategic voting.
THE SIMULATION
This voting experiment assigns each participant with an ideological preference and provides the ideological positions of all candidates (or parties). Fielding the simulation in the classroom requires a worksheet for each participant (prepared in advance), a method to display candidate (party) positions, and a procedure to collect and display aggregate votes. The simulation is appropriate for courses in voting and elections, comparative political systems, and American politics.
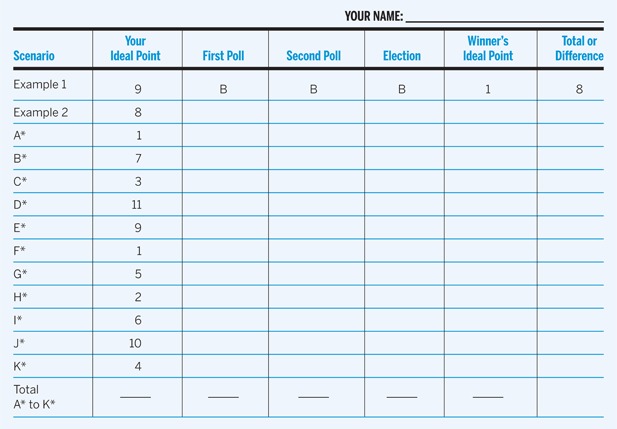
Each student-participant in the election simulation is given a worksheet to record preferences and vote in a series of single-member district (SMD) and plurality elections. Table 1 shows one participant's worksheet. The first column of the worksheet identifies the particular scenario or election (A* to K*). The second column contains the participant's ideal or most preferred point on a unidimensional interval scale ranging from 1 to 11. A participant's ideal point is assigned randomly in advance and varies for each election scenario, so each participant has an opportunity to vote in different contexts and, thus, votes may change with each election. The set of all ideal points is fixed to provide an approximately uniform distribution of voters across the 11-point scale.Footnote 4 The mean and the median voters lie at 6 on the scale. Participants' preference or utility, then, is a linear function of distance along the scale (symmetric and single-peaked). Each line of the worksheet provides the ideal point for an election (A* to K*) and serves as a separate scenario.
Student-Voter Worksheet for the Election Simulation

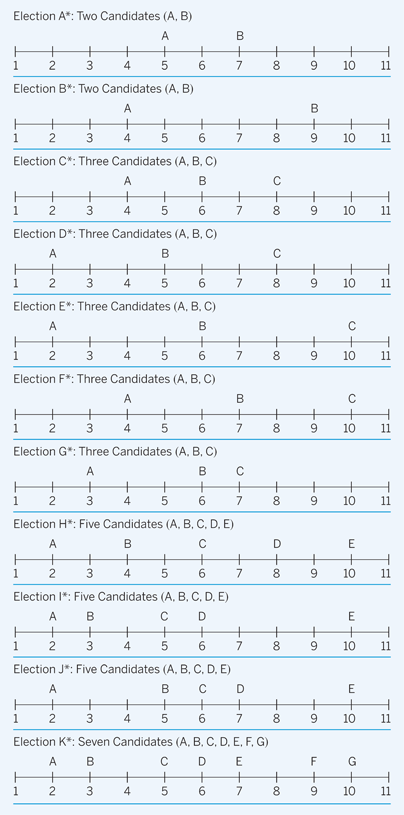
For each election, the placements of from two to seven candidates (parties) are fixed and are revealed to all participants. The number and positions of candidates on the 11-point scale vary across elections. Participants see the number and placement of the candidates for the current scenario on a figure displayed from an overhead or digital projector. Table 2 presents the candidates and their locations for 11 election scenarios, A* to K*. The verbal instructions describe that the closer a candidate's position is to the participant's ideal point, the more the participant prefers the candidate, and explain how minimizing distance between this ideal point and the winning candidate maximizes the participant's personal gain. Preference for an alternative is inversely related to distance between the assigned ideal point and the position of the alternative. The winner is selected by plurality vote, but two polls are conducted and released before votes are cast.
Candidate Ideal Points Elections A* to K*

Two examples precede the actual experiment. The examples enhance the instructions and confirm that participants understand the procedures. The first example is printed in the same manner on each participant's worksheet. For the second example, ideal points varied across participants. The second example provides a check to ensure that all participants understand the rules before the actual experiment begins.
Participants engage in a sequence of electoral contests. For each contest, we first asked participants which of the candidates they are likely to support, and they record the candidate in column three of the worksheet. In our experiments, we tabulated support through a show of hands for each alternative. We counted the number of supporters, calculated the percentage for each alternative, and displayed the results via an overhead projector or the chalkboard. Although we did not have access to a large lecture hall with a student-response system, this simulation would be an excellent use of clicker technology. Clicker systems would enhance student engagement and provide immediate feedback for each poll and election. The simulation could also be used over a computer network or the Internet as long as linked participants can respond to the sequence of polls and elections in real time.
The aggregate results from the first poll are revealed to all participants. Next, a second poll is conducted in a similar fashion, responses recorded in column four, and aggregate results released to all participants. Thus, participants see the ebb and flow of candidate support within the opinion polls.Footnote 5 Finally, participants are asked to cast their ballots on Election Day by recording their votes in column five. The winning candidate is determined, and each participant records the winner's ideal point in column six. Participants are required to respond to all polls and vote in all elections.
Following the determination of the winner, participants then compute the absolute difference between their own ideal points and the ideal point of the winning candidate and record that difference in column seven. A participant's utility is inversely related to this number.
This process is repeated for each scenario, though we do not use all of the elections listed in Table 2 in every class. At the conclusion of the simulation, the participant with the lowest score summed over column seven for all elections receives a bonus. In our classroom experiments, the overall winner received a few extra credit points in the course as an incentive.Footnote 6 Following the simulation, we hold a debriefing or a discussion with the students about what they learned from participation in the voting simulation.
Within the election simulation, participant decisions are based on the proximity spatial model—a voter should cast a ballot for the candidate who is closer to the voter ideal point. For example, in a two-candidate election, if a participant's ideal point is at 7 and the candidates are located at positions 5 and 11, the participant should vote for the candidate at 5, nearer the ideal point than the candidate at 11. Initially, participants followed this proximity expectation fully, but, depending on the election scenario, their actions may reveal strategic behavior after the first poll results are announced.
The initial elections involved only two candidates, and, not surprisingly, these two-candidate contests proved to be straightforward, with little fluctuation between the first poll, the second poll, and the ultimate outcome in the election. It became immediately apparent to our student participants in these early elections that there was really no incentive to vote in a strategic manner. As participants began to show signs of lethargy, we advanced to more stimulating scenarios.
Interest grew as the experiments involved three-candidate races. Eventually, election scenarios included more candidates, up to seven, competing for a single seat. This situation does not occur frequently within the experience of most American college students, occasionally in primary elections; in local, non-partisan elections; and in presidential nominating contests. The scenarios with three or more competitors did allow us to test for and teach participants about strategic behavior and allied concepts such as the importance of momentum and the generally low levels of candidate entry.
Since the simulation is intended to model behavior in mass elections, we did not allow discussion among participants. Results from the first and second polls are revealed publicly to all participants; this served as a form of mass communication and provided a commentary on the campaign and the electoral viability of candidates. However, we only provided pure information and offered no commentary on the meaning or usefulness of that information. Discussion among participants may alter group decisions (Endersby Reference Endersby1993). Other experimental settings model political information in a similar method as in this simulation. Collier et al. (Reference Collier, McKelvey, Ordeshook and Williams1987), for instance, limit the information provided to participants in an experimental setting to poll results. They find this to be an effective way of modeling political information available to a mass electorate.
The results reported here stem from election simulations conducted in five political science undergraduate classes at a large midwestern university in the U.S. Courses ranged from a freshman introductory course to upper-division courses on interest groups and on western European politics. The number of students participating in the experiments ranged from 18 to 75, and the election simulations utilized varied across classes. Not all the outcomes are reported below, but these selections summarize our experiences and cover the full range of scenarios presented in Table 2.
DATA AND FINDINGS
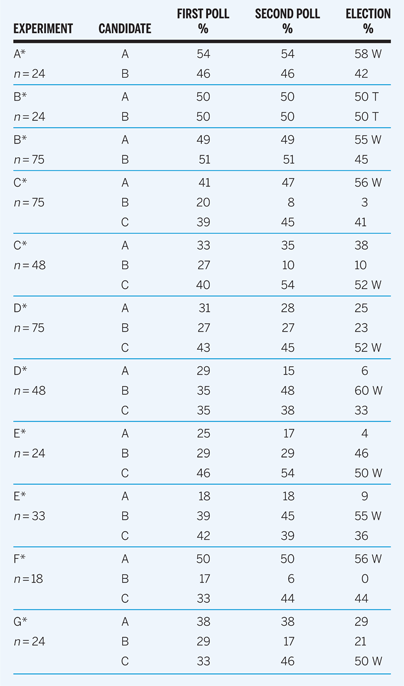
Tables 3 and 4 report the outcomes for 16 election simulations. The results illustrate how quickly students catch on to the notion of strategic behavior. As the results for two-candidate contests typically change little from poll to poll to election, we offer three interesting examples. The first case (A*) typifies the results of little movement with a bandwagon effect among voters indifferent between the two candidates. We report two outcomes for B* because of their exceptional character. In the first case, a dead heat continued from the first poll to the second. In the second case, an apparent leader in the polls lost the election. Contests with a close margin seldom demonstrate significant shifts in vote share (the first example for B*), although there are occasional surprises (the second example for B*).
Representative Simulated Election Results

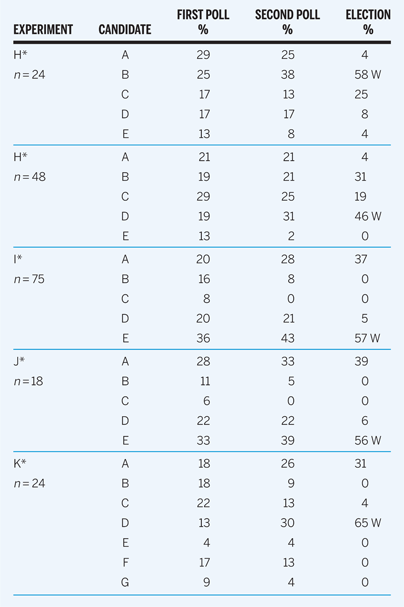
Representative Simulated Election Results

Our results for experiments with multiple alternatives provided strong evidence of the occurrence of tactical decision making. All simulations with three (Table 3) or more (Table 4) alternatives produced changes in expressed preferences. Every experiment saw movement from the first to the second polls and again to the general election. All cases, especially those with four to seven alternatives, narrowed the viable field. With multiple alternatives, the simulation is designed so that no candidate is the first preference of a majority of the voters, yet the election winner typically received a majority of the vote. Most of the results produced two-party contests by the time of the election (exceptions are G* and the first D*).
The extension from three to four candidates was consistent with the general findings. In fact, the elections again led to two factions, with one receiving a majority. What is striking about the cases with a large number of alternatives was the success of the extremist alternatives. Support for centrist candidates often collapsed, and the election became a contest between candidates toward the ends of the scale (particularly for the examples of I* and J*).
In the two-candidate elections (A* and B*), participants voted in a sincere manner. There was no instrumental reason to change, and, except for the indifferent participants with an ideal point midway between two candidates, none changed or misrepresented their preferences. In three-candidate contests, however, most participants realized that there are incentives to act strategically, after the results of the first poll are known. For example, in election C* participants with ideal points in the middle of the distribution prefer candidate B, but they many act strategically by shifting their support to the closer of candidate A or C. Signaling support of and voting for the candidate of second preference decreases the likelihood that the most distant, least preferred candidate will win the election. In actual elections with multiple alternatives, such as states with one of the earlier presidential primaries in 2008, it is difficult to isolate the onset of strategic behavior. Our results show that strategic behavior occurs at both the second poll (when candidate viability may be an issue) and when votes are actually cast.
We also noticed that strategic voting occurred earlier and more frequently when elections were contested by more than three candidates. That is to say, in elections with more than three candidates, expressed preferences were more volatile and voters were more willing to engage in strategic voting. Since these contests occurred later in the sequence, it is not certain whether this is due to the number of candidates competing or participant learning.
Strategic behavior seemed to occur much more often and more rapidly in smaller classrooms than in the large lectures. Perhaps this suggests differences in the dynamics of voting in committees and in mass electorates. One voter in a small group may influence the outcome, but that is less likely in a large decision-making body. In any case, our results imply that implementation of the simulation may work differently in small classes and large lecture halls.
Most of the outcomes follow a predictable pattern. It is often the case that the election winner led the field in the first poll. In 11 of 16 cases from Tables 3 and 4 (and in 71% of simulations overall), the winner led or tied in the first poll. Strategic defections from candidates occur early. The election winner led or tied the second poll in 15 of the 16 cases of Tables 3 and 4 (in 90% overall).
LESSONS STUDENTS LEARNED
During debriefing or discussion following the simulation, students voiced a number of observations about the election process. Students raised issues about strategic voting, bandwagon effects, the importance of the media, the median voter theorem, the role of money in candidate visibility, alternative electoral systems, and how perceptions of voters can be more important than reality. Pedagogically, what we appreciate most about the simulation is that it encourages students to think critically and challenges them to explain what happened during the experiment.
There are a number of lessons that the student can take away from this brief, practical introduction to strategic behavior. First and foremost, the student is introduced to tactical calculation and learns how two-party cleavages developed in a SMD and plurality-winner electoral system. Given two-party system in the United States, strategic voting is likely to be a foreign concept to most American students. But both cases from the literature and from “real life” (e.g., Britain, Canada, and American primaries) can be used to illustrate that strategic voting does actually occur in SMD electoral systems. Likewise, our simulation demonstrates to the student that two-alternative races produce sincere voters, but that, once the number of alternatives goes beyond two, strategic behavior is a natural phenomenon. In all of our classroom experiments, strategic voting occurred in races in which there were more than two candidates.
Our first-past-the-post simulation can also be used to illustrate Duverger's law. In nearly every case, the number of viable parties was reduced to two by the time the final election was held. From an instructor's point of view, it is interesting to watch students begin to think and act strategically as the electorate becomes quite fluid. It is also quite easy to adapt this simulation to illustrate how different electoral rules change the outcome of elections. For instance, toward the end of one classroom simulation we switched from a single-member plurality election to proportional representation. Strategic voting vanished.
Finally, our simulation illustrates the power of information and the role of the media in modern elections. It was clear in our simulations that strategic voting occurs once information on electoral viability is obtained. Because people know how their preferred candidate is doing in the polls, it teaches the voter when to act to cut their losses. This finding can naturally lead into a discussion about the role of the media in politics and elections and the political questions that surround this role.
LESSONS WE LEARNED
We also gained some valuable insights from the election simulation experience. We remain surprised at the incidence of tactical changes for the second poll. Participants seem to signal about acceptable second-choice alternatives when there is no clear instrumental reason to do so. Participants quickly abandon alternatives with little public support. We did not expect strategic misrepresentation of preferences by many participants at such as early stage.Footnote 7
Moreover, in an electoral environment with three or more viable alternatives, we frequently observed a collapse of the political center. In a multicandidate context, we see no particular reason why moderate voters should abandon the center more quickly than ideologues surrender the extreme (in the simulation, the incentives are the same for each). Yet we observed what were by definition proximity voters (Enelow and Hinich Reference Enelow and Hinich1984) act in a manner consistent with directional voting (Rabinowitz and Macdonald Reference Rabinowitz and Macdonald1989) when viewed from an external perspective.
Finally we observed strategic behavior in a simulated electorate. Revealed preferences were not explained by campaign rhetoric, the first justification that occurs to a survey respondent, personality factors, political bias, or post-hoc rationalizations. Information on viability, the likelihood of winning, altered participants' voting decisions.
The voting simulation described above is a useful election simulation that we, and our students, have found to be both informative and entertaining. Illustrating strategic behavior through a participatory exercise, this simulation teaches how information, even impartial information, influences decisions and actions. It also confirms the power of Duverger's law and of the influence the electoral system may have on outcomes.