INTRODUCTION
Records of past glacial behavior offer a unique window into the paleoclimate of mountainous areas. In particular, reconstructed paleoglacier histories across southern South America are necessary to provide the decadal- to centennial-scale paleoclimatic context that complements our growing understanding of contemporary climate variability and ascertain whether glacial responses represented regional or hemispheric patterns. However, the remoteness of southernmost South America (42°S–56°S) has resulted in fewer detailed paleoglacier investigations there relative to large swaths of the Northern Hemisphere.
Across southern South America, the southern westerly winds (hereafter the westerlies) and associated atmospheric behavior dominate the climate and strongly influence zonal and meridional variations in temperature and precipitation (Garreaud et al., Reference Garreaud, Lopez, Minvielle and Rojas2013). Paleoclimate reconstructions in Patagonia (defined herein as South America 42°S–53°S) frequently invoke changes in the strength, N-S width, or latitudinal position of the strongest westerlies to explain changes in regional paleoclimate (Lamy et al., Reference Lamy, Kilian, Arz, Francois, Kaiser, Prange and Steinke2010; Villa-Martínez et al., Reference Villalba, Lara, Masiokas, Urrutia, Luckman, Marshall and Mundo2012; Boex et al., Reference Boex, Fogwill, Harrison, Glasser, Hein, Schnabel and Xu2013; Van Daele et al., Reference Stuiver, Reimer and Reimer2016; Moreno et al., Reference Moreno, Vilanova, Villa-Martínez, Dunbar, Mucciarone, Kaplan and Garreaud2018; Sagredo et al., Reference Sagredo, Kaplan, Araya, Lowell, Aravena, Moreno, Kelly and Schaefer2018). Given the westerlies serve as a rough boundary between warmer and colder air to the north and south, respectively, latitudinal displacements influence glacial to interglacial as well as Holocene climate change. Moreover, broadly speaking, stronger westerlies correlate with wetter conditions in western Patagonia and drier conditions in eastern Patagonia, reducing the amplitude of the seasonal temperature cycle across both western and eastern Patagonia; the opposite shifts are true under weaker westerlies (Garreaud et al., Reference Garreaud, Lopez, Minvielle and Rojas2013; Agosta et al., Reference Agosta, Compagnucci and Ariztegui2015). For example, a southerly intensification of mean westerly circulation since the 1960s has been accompanied by broad warming across the region and an increase in precipitation south of 50°S (Garreaud et al., Reference Garreaud, Lopez, Minvielle and Rojas2013), documenting that westerly variations have at least decadal consequences for the present and future climate of the region.
In this study, we focus on the paleoclimate of Isla Grande de Tierra del Fuego (53°S–55°S; hereafter Tierra del Fuego), which hosts a large concentration of glaciers in the mountainous Cordillera Darwin. Located at the southernmost tip of the continent, it is ideally positioned to document far southward shifts and/or changes in intensity of westerly variations, especially when compared with more northern paleoclimate-record counterparts. The relative inaccessibility of much of the Cordillera Darwin has—until recently—resulted in few published studies of its paleoglacier history (e.g., Kuylenstierna et al., Reference Kuylenstierna, Rosqvist and Holmlund1996; Strelin et al., Reference Strelin, Casassa, Rosqvist and Holmlund2008; Hall et al., Reference Hall, Porter, Denton, Lowell and Bromley2013, Reference Hall, Lowell, Bromley, Denton and Putnam2019; Menounos et al., Reference Menounos, Clague, Osborn, Davis, Ponce, Goehring, Maurer, Rabassa, Coronato and Marr2013, Reference Menounos, Maurer, Clague and Osborn2020; Meier et al., Reference Meier, Aravena, Grießinger, Hochreuther, Soto-Rogel, Zhu, Pol-Holz, Schneider and Braun2019). Yet additional paleoclimate records are justified for several reasons. First, records of paleoglacier activity in Cordillera Darwin could provide insights to solve apparent differences regarding the magnitude/timing of glacial fluctuations during the Antarctic Cold Reversal (ACR; 14.5–12.9 ka; e.g., McCulloch et al., Reference McCulloch, Fogwill, Sugden, Bentley and Kubik2005b; Hall et al., Reference Hall, Porter, Denton, Lowell and Bromley2013, Reference Hall, Lowell, Bromley, Denton and Putnam2019; Menounos et al., Reference Menounos, Clague, Osborn, Davis, Ponce, Goehring, Maurer, Rabassa, Coronato and Marr2013; Fernández et al., Reference Fernández, Gulick, Rodrigo, Domack and Leventer2017; Davies et al., Reference Davies, Darvill, Lovell, Bendle, Dowdeswell, Fabel and García2020). Second, a detailed understanding of the Holocene glacier history of this region is lacking in general with exceptions (e.g., Strelin et al., Reference Strelin, Casassa, Rosqvist and Holmlund2008; Menounos et al., Reference Menounos, Clague, Osborn, Davis, Ponce, Goehring, Maurer, Rabassa, Coronato and Marr2013, Reference Menounos, Maurer, Clague and Osborn2020; Hall et al., Reference Hall, Lowell, Bromley, Denton and Putnam2019).
Glacial histories in Cordillera Darwin could also help better identify differences in their behavior at variable time scales. The recent trend of ice mass loss across the Cordillera Darwin generally follows net long-term regional warming since the beginning or middle (1950s) of the twentieth century (Miller, Reference Miller and Schwerdtfeger1976; Rosenblüth et al., Reference Rosenblüth, Fuenzalida and Aceituno1997; Rignot et al., Reference Rignot, Rivera and Casassa2003; Villalba et al., Reference Vanneste, De Vleeschouwer, Bertrand, Martínez-Cortizas, Vanderstraeten, Mattielli and Coronato2003; Rasmussen et al., Reference Rasmussen, Conway and Raymond2007; Sagredo and Lowell, Reference Sagredo and Lowell2012; Bown et al., Reference Bown, Rivera, Zenteno, Bravo, Cawkwell, Kargel, Leonard, Bishop, Kääb and Raup2014). However, individual glaciers have experienced variable rates of change (López et al., Reference López, Chevallier, Favier, Pouyaud, Ordenes and Oerlemans2010), and the contemporary behavior of Fuegian glaciers appears to differ on decadal or subdecadal time scales, with some glaciers experiencing accelerated retreat or, in some cases, slight advance over the past 50 yr (Holmlund and Fuenzalida, Reference Holmlund and Fuenzalida1995; López et al., Reference López, Chevallier, Favier, Pouyaud, Ordenes and Oerlemans2010; Bown et al., Reference Bown, Rivera, Zenteno, Bravo, Cawkwell, Kargel, Leonard, Bishop, Kääb and Raup2014). Detailed studies of glacial mass balance in Tierra del Fuego and the nearby Gran Campo Nevado (52°S) show diverging trends in the elevational distribution of glacial mass loss and accumulation, with accelerated mass loss in the ablation area being partially compensated for by enhanced mass gain at higher elevations (Möller et al., Reference Möller, Schneider and Kilian2007; Melkonian et al., Reference Melkonian, Willis, Pritchard, Rivera, Bown and Bernstein2013). On the other hand, from 1945 to 2003, the tidewater Marinelli glacier has retreated an exceptional 15 km from its midcentury ice margin (Porter and Santana, Reference Porter and Santana2003). Paleoglacier records can thus help provide insight into the spatial and temporal variability of individual glacier behavior in the past across Cordillera Darwin.
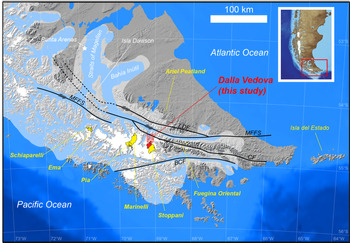
To this end, we set out to document the paleoglacial history of the Dalla Vedova glacier in the northeastern Cordillera Darwin (Fig. 1). Our record spans the late glacial and Holocene and was constructed using a combination of cosmogenic surface exposure dating, radiocarbon dating, and dendrochronologic constraints. The new record allows comparison with late-glacial to Holocene advances observed farther north in mainland South America and elsewhere in Darwin (e.g., Strelin et al., Reference Strelin, Casassa, Rosqvist and Holmlund2008; Hall et al., Reference Hall, Lowell, Bromley, Denton and Putnam2019; Menounos et al., Reference Menounos, Maurer, Clague and Osborn2020), revealing some key similarities and differences that contribute to a more complete understanding of past glacial response to climate changes in Tierra del Fuego.
Regional context and details of the study area overlain on a shaded relief map, with inset showing location within southern South America. The Dalla Vedova glacier is highlighted in red, while the study area is demarcated by a red box. Paleoglacier systems and other studies mentioned in the text are indicated in yellow. Approximate last glacial maximum ice extent is indicated by the shaded white polygon. Major named faults in the region are illustrated by thick black lines (after Sue and Ghiglione, 2016). LDF, Lago Deseado Fault; MFFS, Magallanes-Fagnano Fault System; CF, Carbajal valley Fault; BCF, Beagle Channel Fault. Sense of motion is indicated on fault systems with known Holocene activity (after Sandoval and De Pascale, Reference Sandoval and De Pascale2020). Note the proximity of the CF to the study area.

STUDY AREA
Geographic setting
The interior of Cordillera Darwin is mantled by more than 2000 km2 of ice (Bown et al., Reference Bown, Rivera, Zenteno, Bravo, Cawkwell, Kargel, Leonard, Bishop, Kääb and Raup2014) and is often referred to as an ice field. Modern equilibrium-line altitudes in the Darwin region range from 650 to 1100 m, gradually rising to the east (Strelin and Iturraspe, Reference Strelin and Iturraspe2007; Bown et al., Reference Bown, Rivera, Zenteno, Bravo, Cawkwell, Kargel, Leonard, Bishop, Kääb and Raup2014). The Dalla Vedova glacier covers an area of ~55 km2 and is located at the northeastern terminus of the Cordillera Darwin (Fig. 1), at the far eastern end of Seno Almirantazgo, and is adjacent to the Stoppani glacier to the east (Menounos et al., Reference Menounos, Maurer, Clague and Osborn2020), the Cuevas glacier to the south, and the Nueva Zelandia glacier to the west. Dalla Vedova, like most of Darwin's glaciers, has undergone generalized net retreat since the mid-1950s.
The regional geologic setting plays a considerable role in the evolution of the physical geography of the region. The island of Tierra del Fuego is bisected from west to east by the left-lateral Magallanes-Fagnano Fault System (MFFS; Fig. 1), which separates the Scotia plate to the south from the South American plate to the north. The Cordillera Darwin forms the mountainous core of Tierra del Fuego immediately to the south of the MFFS. In the study area, the local bedrock is composed primarily of metasediments of the Cordillera Darwin metamorphic complex and postmetamorphic granitic intrusives of the Beagle granite suite (Hervé et al., Reference Hervé, Fanning, Pankhurst, Mpodozis, Klepeis, Calderón and Thomson2010). Eocene apatite fission track closure ages for Darwin suggest the high topography of the range is in part inherited from Paleogene–Neogene uplift events (Nelson, Reference Nelson1982). In addition, raised marine terraces and paleo-shorelines indicate localized uplift of up to 30 m during the Holocene within and beyond Cordillera Darwin (Bentley and McCulloch, Reference Bentley and McCulloch2005; Bujalesky, Reference Bujalesky2007). A significant glacial-isostatic component contributes to this sum (Porter et al., Reference Porter, Stuiver and Heusser1984; Ivins and James, Reference Ivins and James2004; Mendoza et al., Reference Mendoza, Perdomo, Hormaechea, Cogliano, Fritsche, Richter and Dietrich2011), although neotectonic uplift related to the active faults throughout the region also may play a locally important role (Bujalesky, Reference Bujalesky2007; Sandoval and De Pascale, Reference Sandoval and De Pascale2020).
Regional paleoglacier chronologies
Erratic boulders from the Cordillera Darwin have been found at Bahía Inútil, >100 km to the north (Evenson et al., Reference Evenson, Burkhart, Gosse, Baker, Jackofsky, Meglioli, Dalziel, Kraus, Alley and Berti2009). These boulders have been termed “Darwin's boulders” and their association with glacial landforms dating to the last glacial maximum (LGM; 26.5–19 ka; Clark et al., Reference Clark, Dyke, Shakun, Carlson, Clark, Wohlfarth, Mitrovica, Hostetler and McCabe2009) implies the existence of an extensive, conjoined ice sheet at this time that extended from the Cordillera Darwin to the upper Strait of Magellan (Rabassa et al., Reference Rabassa, Coronato, Bujalesky, Salemme, Roig, Meglioli and Heusser2000; McCulloch et al., Reference McCulloch, Fogwill, Sugden, Bentley and Kubik2005b; Kaplan et al., Reference Kaplan, Coronato, Hulton, Rabassa, Kubik and Freeman2007; Evenson et al., Reference Evenson, Burkhart, Gosse, Baker, Jackofsky, Meglioli, Dalziel, Kraus, Alley and Berti2009; Darvill et al., Reference Darvill, Stokes, Bentley and Lovell2014, Reference Darvill, Bentley and Stokes2015; Soteres et al., Reference Soteres, Peltier, Kaplan and Sagredo2020; Peltier et al., Reference Peltier, Kaplan, Birkel, Soteres, Sagredo, Aravena, Araos, Moreno, Schwartz and Schaefer2021; Fig. 1). The collapse of this massive ice body started around or soon after 18 ka (McCulloch et al., Reference McCulloch, Fogwill, Sugden, Bentley and Kubik2005b; Kaplan et al., Reference Kaplan, Fogwill, Sugden, Hulton, Kubik and Freeman2008; Hall et al., Reference Hall, Porter, Denton, Lowell and Bromley2013; Peltier et al., Reference Peltier, Kaplan, Birkel, Soteres, Sagredo, Aravena, Araos, Moreno, Schwartz and Schaefer2021). Based on stratigraphic evidence, it has been suggested that the deglaciation was interrupted by a major glacial advance during the ACR that reached as far north as Isla Dawson at the head of the Strait of Magellan (McCulloch et al., Reference McCulloch, Bentley, Tipping and Clapperton2005a; Fig. 1). However, more recent studies have shown that the initial ice retreat from LGM limits was rapid and profound, with the remnants of the former ice sheet seemingly restricted to Cordillera Darwin since or soon after 17 ka (Hall et al., Reference Hall, Porter, Denton, Lowell and Bromley2013, Reference Hall, Lowell, Bromley, Denton and Putnam2019; Fernández et al., Reference Fernández, Gulick, Rodrigo, Domack and Leventer2017; this study). Direct evidence obtained thus far of glacial fluctuations during the ACR in or close to Cordillera Darwin indicates that any advance was restricted to a few kilometers form the headwalls (Menounos et al., Reference Menounos, Clague, Osborn, Davis, Ponce, Goehring, Maurer, Rabassa, Coronato and Marr2013).
During the Holocene, glacial extent within the Cordillera Darwin reached an apparent maximum only during the late part of the epoch, although in the nearby Cordillera Fueguina Oriental, evidence exists for an early Holocene advance slightly outboard (ice-distal) of the latest Holocene ice limit (Menounos et al., Reference Menounos, Clague, Osborn, Davis, Ponce, Goehring, Maurer, Rabassa, Coronato and Marr2013). The Schiaparelli and Ema glaciers in western Cordillera Darwin reached their apparent maximum extent in the eighteenth century after a series of less-extensive late Holocene advances (Strelin et al., Reference Strelin, Casassa, Rosqvist and Holmlund2008; Meier et al., Reference Meier, Aravena, Grießinger, Hochreuther, Soto-Rogel, Zhu, Pol-Holz, Schneider and Braun2019), as did Stoppani glacier in eastern Darwin (Menounos et al., Reference Menounos, Maurer, Clague and Osborn2020). In south-central Cordillera Darwin, the late Holocene maximum was reached earlier, between 900–730 and 650–560 cal yr BP (roughly AD 1100 to AD 1400; Kuylenstierna et al., Reference Kuylenstierna, Rosqvist and Holmlund1996) at Bahía Pía, while the tidewater Marinelli glacier may have reached its maximum earlier still, from 1350–1180 to 1180–980 cal yr BP (Hall et al., Reference Hall, Lowell, Bromley, Denton and Putnam2019). We highlight that the glacial records just mentioned have relied mainly on the 14C-dated stratigraphic record, that is, terrestrial organic matter buried by advancing glaciers. In addition, we note that sedimentary-based proxies in nearby areas, distal to glacial fronts, have been used to infer glacial fluctuations throughout the late Holocene (Vanneste et al., Reference Van Daele, Bertrand, Meyer, Moernaut, Vandoorne, Siani and Tanghe2016; Bertrand et al., Reference Bertrand, Lange, Pantoja, Hughen, Van Tornhout and Wellner2017).
Regional climatology
Climate across the southernmost tip of South America is difficult to evaluate comprehensively given the paucity of long-term meteorological records in the region, although general spatial patterns are understood. Climate is cold-maritime, dominated by interactions between strong and persistent westerly atmospheric flow and the topographic barrier imposed by the Andes (Miller, Reference Miller and Schwerdtfeger1976; Schneider et al., Reference Schneider, Glaser, Kilian, Santana, Butorovic and Casassa2003). A strong orographic effect produces a pronounced W-E precipitation gradient, with precipitation of up to 2000 mm/yr concentrated on the hyperhumid western (windward) slopes of Tierra del Fuego, dropping to 300–400 mm/yr on the eastern steppe. Precipitation west of the topographic divide scales directly with zonal wind, while heightened wind corresponds to lower precipitation east of the divide (Garreaud et al., Reference Garreaud, Lopez, Minvielle and Rojas2013). Conversely, decreased westerly wind intensity may lead to increased precipitation in the southeastern sector of Patagonia east of the Andes (Moreno et al., Reference Moreno, Vilanova, Villa-Martínez, Dunbar, Mucciarone, Kaplan and Garreaud2018).
Regionally averaged temperature records derived from tree rings demonstrate that the twentieth century of southernmost South America has been anomalously warm with respect to the last 400 yr (Villalba et al., Reference Vanneste, De Vleeschouwer, Bertrand, Martínez-Cortizas, Vanderstraeten, Mattielli and Coronato2003). Since the 1960s, a stepwise warming trend at Punta Arenas (~200 km to the northwest of the study area) of 0.15°C–0.21°C per decade since the 1960s is discernable from station data (Rosenblüth et al., Reference Rosenblüth, Fuenzalida and Aceituno1997; Carrasco et al., Reference Carrasco, Casassa, Rivera, Casassa, Sepúlveda and Sinclair2002). This warming is particularly pronounced in the winter months and is associated with a local decline in snow cover (Aguirre et al., Reference Aguirre, Carrasco, Sauter, Schneider, Gaete, Garín, Adaros, Butorovic, Jaña and Casassa2018).
Over the same time period, precipitation has increased over southwestern (windward) Patagonia and Tierra del Fuego, while decreasing over southeastern (leeward) Patagonia and Tierra del Fuego (Aravena and Luckman, Reference Aravena and Luckman2009; Garreaud et al., Reference Garreaud, Lopez, Minvielle and Rojas2013, González-Reyes et al., Reference González-Reyes, Aravena, Muñoz, Soto-Rogel, Aguilera-Betti and Toledo-Guerrero2017). These changes in temperature and precipitation have been variably attributed to the 1976/1977 climate shift in the tropical Pacific or a multidecadal trend toward more frequent positive phases of the Southern Annular Mode (SAM), the latter of which has also been most pronounced since the late 1970s (Marshall, Reference Marshall2003; Yuan et al., Reference Xia, Yu and Loisel2018; Fogt and Marshall, Reference Fogt and Marshall2020).
METHODS
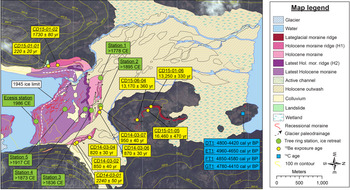
We constructed a geomorphologic map of the study area based on aerial photographs and two campaigns of field mapping (November 2014 and April 2015) (Figs. 2 and 3). Detailed mapping reveals a relative chronology of glacial and paraglacial events in the region (Fig. 3). We use cosmogenic surface exposure dating, dendrochronology, and radiocarbon dating to reconstruct the study area's deglacial and Holocene glacier history (Fig. 2).
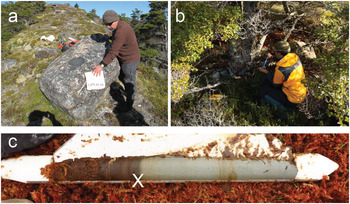
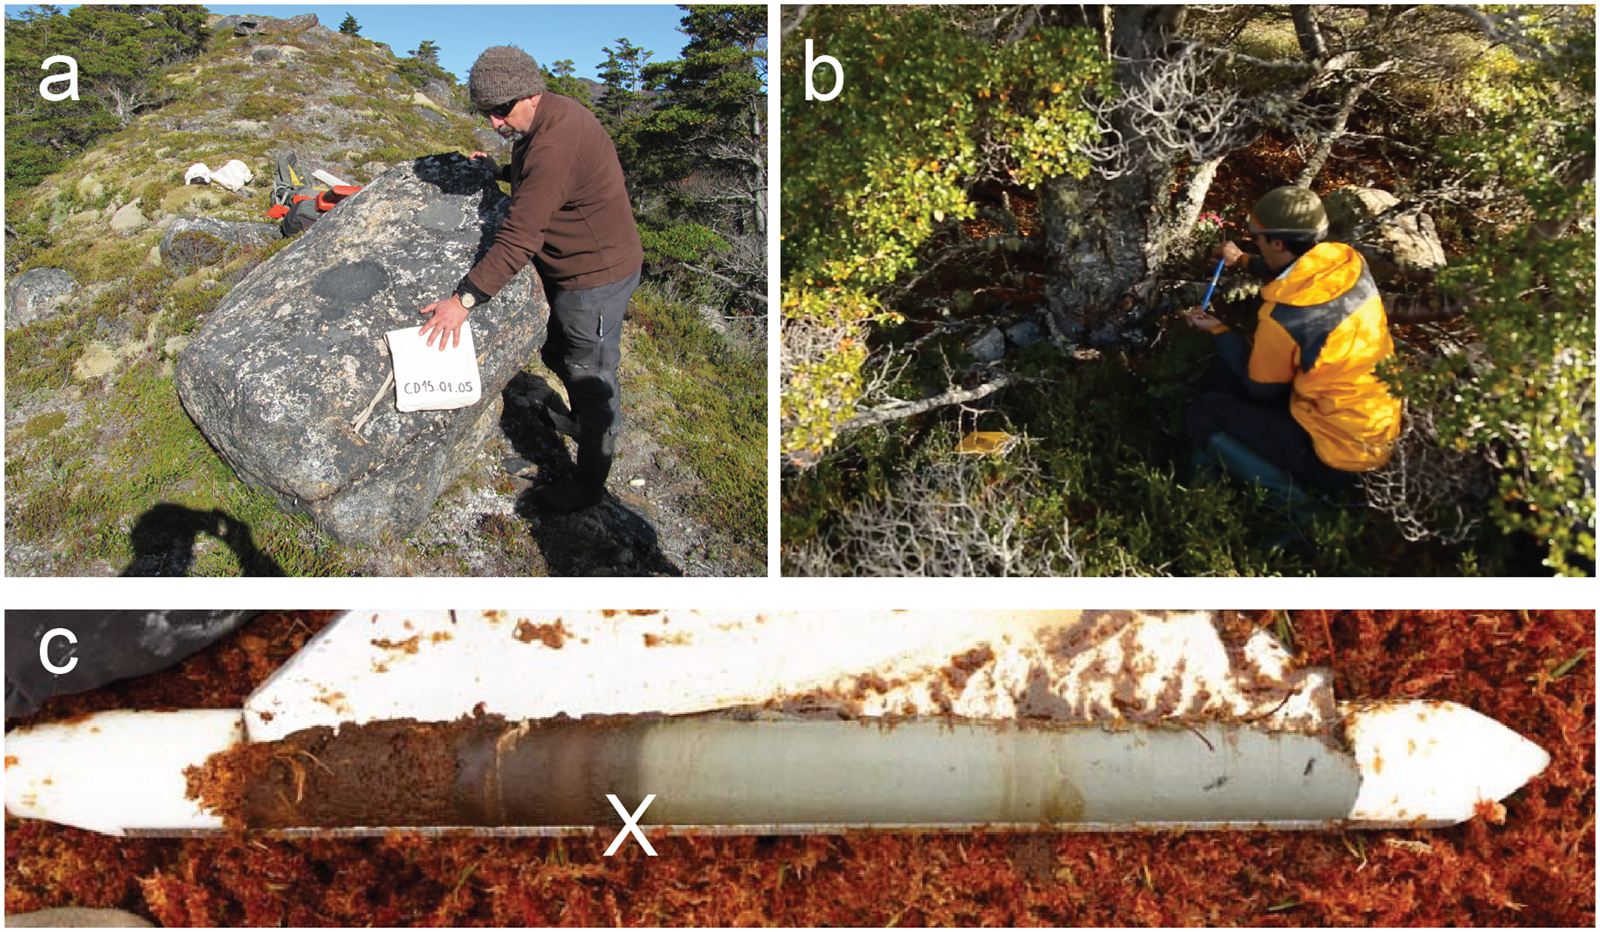
Photos of samples from the study area. (a) Sample CD15-01-05 was taken from a 1.5 × 1.5 × 1 m granitic boulder on a sharp-crested moraine fragment, which is located on a topographic high ~160 m asl approximately 3 km from the modern ice margin. (b) Obtaining a tree core from Nothofagus betuloides at dendrochronological Station 4 (see Table 3). (c) Core CD14-03-01-CT8, which at a depth of 425–475 cm preserves the transition from peat to gray clay.
Geomorphologic map of the study area with results of the paleoglacier chronology. Contours are based upon the Shuttle Radar Tomography Mission 1 arc-second digital elevation model. 10Be ages in italics are designated as outliers (Table 2). Tree-ring dates represent minimum ages for ice-free conditions, calculated by applying a 41-yr ecesis correction to the oldest sampled tree at each station (Table 3). Note that north is to the right.

10Be surface exposure dating
Moraines unambiguously mark former glacial limits, which we directly dated using the 10Be cosmogenic nuclide. We sampled large (>1 m3) boulders rooted in the crests of moraine ridges (Fig. 2a) for 10Be analyses. Total boulder quartz content varied from 5% to 35%, with sample lithology split between rhyodacite and granodiorite. We preferentially sampled boulders >0.5 m tall to avoid possible burial effects; erosion is assumed to be negligent due to the young age of the samples and generally good condition of the boulder surfaces that we sampled. We sampled the top 1–4 cm of planar to gently curved non-vegetated surfaces using a drill and explosive charges as per Kelly (Reference Kelly2003). We recorded topographic skyline, as well as surficial strike and dip measurements, using a handheld transit and clinometer. Coordinates and altitude are evaluated relative to the WGS 1984 datum, using a handheld commercial GPS with an assumed uncertainty of <10 m. We do not correct for shielding effects of snow or vegetation. Given the sampled boulders sit atop the landform, we infer 10Be ages record the near-final construction and stabilization of the moraine, near the climatic inflection point when the glacier in question begins to retreat. Hence, we infer these ages represent close limiting ages of the culmination of a glacial advance.
Initial rock crushing took place at the Pontificia Universidad Católica de Chile; mineral separation and final sample preparation occurred at the Cosmogenic Nuclide Laboratory at Lamont-Doherty Earth Observatory (LDEO) following standard geochemical protocols (e.g., Schaefer et al., Reference Schaefer, Denton, Kaplan, Putnam, Finkel, Barrell and Andersen2009; Kaplan et al., Reference Kaplan, Strelin, Schaefer, Denton, Finkel, Schwartz, Putnam, Vandergoes, Goehring and Travis2011). Sample measurement was carried out at the Center of Accelerator Mass Spectrometry at Lawrence Livermore National Laboratory. We calculate ages (Table 1) based on the “Lm” scaling scheme and the online CRONUS calculator v. 3 (Balco et al., Reference Balco, Stone, Lifton and Dunai2008) using the regional production rate for southern Patagonia at ~50°S (Kaplan et al., Reference Kaplan, Strelin, Schaefer, Denton, Finkel, Schwartz, Putnam, Vandergoes, Goehring and Travis2011). Choice of scaling scheme has no effect on our conclusions given differences in ages are statistically identical at ±1σ uncertainty (Table 2).
Geographic and analytical data for 10Be analyses, sorted by moraine (Fig. 3).

a We assume a sample density of 2.7 g/cm3 and make no corrections for boulder erosion or shielding by sediment, snow, or vegetation. Carrier concentrations used are 1043 ppm (*) and 1044 ppm for all others.
b Accelerator mass spectrometry ratios are presented as boron-corrected values measured against the 07KNSTD3110 standard material (10Be/9Be = 2.85 × 10⁻¹²; Nishiizumi et al., Reference Nishiizumi, Imamura, Caffee, Southon, Finkel and McAninch2007).
c The 10Be concentrations are corrected for background 10Be in procedural blanks associated with each sample set, the ratios of which ranged from 3.4656 × 10⁻¹⁶ to 5.0787 × 10⁻¹⁶.
All 10Be ages calculated using CRONUS v. 3 (Balco et al., Reference Balco, Stone, Lifton and Dunai2008) and are reported with 1σ internal (analytical error).a

a St is the scaling scheme of Lal (Reference Lal1991)/Stone (Reference Stone2000); Lm, the time-dependent version of the scaling scheme of Lal/Stone; LSD, the time-dependent version of the Lifton et al. (Reference Lifton, Sato and Dunai2014) scaling scheme. We use the Lm scaling scheme, but this choice does not change our conclusions given overlap at 1σ. All ages were calculated using a 10Be production rate measured at Lago Argentino, south Patagonia (50°S) (Kaplan et al., Reference Kaplan, Strelin, Schaefer, Denton, Finkel, Schwartz, Putnam, Vandergoes, Goehring and Travis2011). Mean moraine age shown with standard deviation (SD) and SD plus a 3% error propagated in quadrature for the production rate uncertainty (Kaplan et al., Reference Kaplan, Strelin, Schaefer, Denton, Finkel, Schwartz, Putnam, Vandergoes, Goehring and Travis2011). The H1 right lateral-frontal mean moraine age is calculated by excluding one outlier (CD15-01-02), which is more than 3σ different than the other nearby boulders (see text). Data in italics are inferred outliers (see text).
Dendroglaciology
To constrain further the most recent glacial history of Dalla Vedova, we conducted dendroglaciological dating of trees growing in the glacial forefield, following a transect from the ice-distal to ice-proximal sector of the recently formed moraines. The age of the oldest tree growing on a deglaciated surface will give a minimum-limiting age of glacial retreat (Sigafoos and Hendricks, Reference Sigafoos and Hendricks1969; Luckman, Reference Luckman2000). We collected 95 increment cores of Nothofagus betuloides from five stations in the study area. All samples were taken following standard procedure from 10 to 50 cm above the surface, as close to the root collar as was feasible, to minimize height–age error (McCarthy et al., Reference McCarthy, Luckman and Kelly1991). The samples were prepared following standard procedures at the Instituto de la Patagonia, Universidad de Magallanes (Stokes, Reference Stokes1996); ring counting took place at the Instituto de Geografía, Pontificia Universidad Católica de Chile. We make no additional corrections for ring height nor rotted piths.
Aerial photography from a U.S. Air Force trimetrogon survey in 1945 establishes that the Dalla Vedova glacier terminated on land, on the northern side of the subsequently formed lake (dashed white line in Fig. 3). We collected five sawn basal disks at 5 cm height from saplings within this ice limit to obtain an estimate of local ecesis. The oldest age of this population yielded an age of 29 yr, suggesting an approximate ecesis value of 41 yr. This value is comparable to ecesis values estimated from the Gran Campo Nevado at 53°S (Koch and Kilian, Reference Koch and Kilian2005) and Bahía Pía in the Cordillera Darwin at 55°S (Holmlund and Fuenzalida, Reference Holmlund and Fuenzalida1995). We henceforth apply an ecesis correction of 41 yr to all tree-ring counts to obtain minimum ages of germination and thus constrain ice-free conditions on a surface.
Radiocarbon dating
From the distal northeastern part of the study area, we obtained four sediment cores from an ombrotrophic bog with the intent to constrain the minimum age of ice retreat (square icons on Fig. 3). We carried out two orthogonal depth transects with a steel probe to identify the deepest section of the bog. Using a D-section Russian corer, we retrieved complete sections (i.e., to basal sediments) from this site. Field descriptions of core composition and texture were compiled for the complete sections, which all contained a transition from relatively organic to relatively inorganic sedimentation at approximately 4–5 m depth (Figs. 2c and 4). In the field, we collected 15 cm sections encompassing the organic/inorganic transition near the bottom for further analysis. On these 15 cm sections, loss-on-ignition burns for 2 hours at 550°C and 4 hours at 950°C allow us to determine the organic, siliciclastic, and carbonate fractions at 1 cm intervals (Heiri et al., Reference Heiri, Lotter and Lemcke2001). For accelerator mass spectrometry 14C dating, we collected plant macrofossils from within 1 cm above the loss-on-ignition defined break between predominantly inorganic and organic sediments. Samples were processed and analyzed at Beta Analytic. Finally, we convert all 14C ages to cal yr BP using CALIB v. 8.2 (Stuiver et al., Reference Stuiver, Reimer and Reimer2021), with the SHCal20 Southern Hemisphere calibration curve of Hogg et al. (Reference Hogg, Heaton, Hua, Palmer, Turney, Southon, Bayliss, Blackwell, Boswijk, Bronk Ramsey, Pearson, Petchey, Reimer, Reimer and Wacker2020). Calibrated 14C ages are reported as ranges with 2σ error.
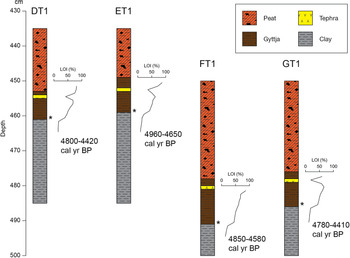
Sediment cores dated in this study. Loss-on-ignition profiles are displayed to the right of each core. Stars indicate macrofossil sample locations for radiocarbon dating.

RESULTS
Glacial geomorphology
At present, a relatively small, ~300 m section of the nearly 2000-m-long glacial terminus of Dalla Vedova calves into a proglacial lake (Fig. 3). Just distal to the proglacial lake is a distinct hummocky morainal belt that defines the glacial forefield. Atop this hummocky unit we found numerous (n > 30) low-relief, discontinuous ridges composed of diamicton, some of which are quasi-parallel or orthogonal to the modern ice terminus (Fig. 3); these are interpreted as recessional moraines that possibly record annual moraine-building events (see Beedle et al., Reference Beedle, Menounos, Luckman and Wheate2009). Trimetrogon imagery from 1945 indicates that at this time the glacier was at or near these moraines and the modern proglacial lake had not yet formed.
Outboard of these innermost recessional moraines, several closed depressions currently hold water, whereas others are broken by dry canals interpreted as paleochannels. These are interpreted as paleolake beds, formed by ponding of water between a receding ice margin and the prominent moraines outboard. The prominent moraines, approximately 2 km from the modern ice margin, form a pair of well-defined, continuous, sharp-crested latero-frontal ice-marginal landforms between 5 and 60 m in height (Fig. 3). The outer and inner moraines are dubbed “H1” and “H2,” respectively. Maximum height is achieved on the western H1 lateral; the eastern lateral rises to approximately 20 m, and the frontal moraines do not rise above 10 m. These moraines are cut in several parts by multiple generations of paleochannels, as well as the modern drainage. These channels, along with boulder-sized outwash deposits and hummocky topography, separate the two moraine ridges. Samples for 10Be surface exposure dating were collected from the outer H1 moraine, while dendrochronologic stations were positioned to constrain the age of the landforms ice-proximal to H1 (Figs. 2b and 3).
An extensive outwash plain leads from two breaches in the outer moraine ridge to the ocean, ~3.5 km to the north. Outwash in the study area is defined morphologically as continuous low-angle surfaces with evidence of channelization, and compositionally as moderately sorted deposits of subrounded to rounded clasts ranging in size from coarse sand to boulders <1 m in diameter. Several generations of outwash are defined by vegetation development and morphostratigraphic relations. The 1945 imagery additionally reveals that a prominent abandoned channel to the east was active at that time, although the current drainage channel of the lake was also active. The contemporary active channel forms a pronounced knickpoint as it passes through the outer moraine and cuts an older outwash surface consisting of imbricated boulders of up to 1 m in diameter; based on these characteristics, we suggest that the breaching of the outer moraine before 1945 resulted in a glacial lake outburst flood.
The outwash plain skirts a ~175-m-tall bedrock promontory on the east side of the valley. On top of this topographic feature, two distinct ridges are found at different elevations, from which three 10Be samples were collected (Fig. 3). The higher ridge, dubbed “L1,” forms an approximately 150 × 150 m L-shaped angle, which is on the top of the bedrock knob, and is composed of sediment with scattered boulders on top. The discontinuous lower ridge, “L2,” is approximately 10 m below the high ridge and has a similar composition. L2 can be followed to the north as it progressively loses elevation, terminating at approximately 20 m above mean sea level (m amsl), 10 m above the modern outwash surface. Both the L1 and L2 ridges are interpreted as latero-frontal moraines from an extensive advance of the Dalla Vedova glacier well beyond the H1 and H2 moraine ridges; no evidence is observed of corresponding lateral moraines on the heavily forested western or eastern valley walls.
Approximately 5.5 km from the modern ice margin, close to the bay, a low-relief (max. 20 m) bedrock promontory forms part of the modern coastline, above the outwash surface. The interior of the promontory is mantled by a mixture of mature Nothofagus forest and raised bog; a fragmented crest composed of diamicton is interpreted as a glacial till of indeterminate age. The sediment cores described in the subsection Radiocarbon dating were taken from a raised bog at an elevation of ~15 m amsl in the interior of this bedrock outcrop.
Low-lying parts of the study area are covered by shallow (depth 1–2 m) lakes and wetlands. These are associated with damming activity of nonnative beavers (Castor canadensis) since their introduction to the region in 1946 (Lizarralde et al., Reference Lizarralde, Escobar and Deferrari2004) and are therefore not considered an intrinsic part of the pre-historical geomorphology of the region.
Dating
Results of the cosmogenic dating of glacial moraines are presented in Tables 1 and 2. Ages show good stratigraphic agreement in that more distal/higher moraines yield older ages than those more proximal to the modern ice limit. These moraine ages can be defined as representing late-glacial and Holocene advances and are discussed in the following sections.
Late-glacial moraines
Three boulders were sampled from the two moraine ridges (L1 and L2) preserved atop the bedrock promontory, well above the modern outwash. A single sample from a boulder atop the L1 moraine fragment, topographically above all other moraines in the study area, yielded an exposure age of 16,500 ± 470 yr. The L2 moraine forms a discontinuous moraine crest of variable height (max. 10 m) that is discernable directly inboard (ice-proximal) of this moraine fragment. Two samples from boulders on top of the L2 ridge crest give exposure ages of 13,260 ± 330 and 13,170 ± 360 yr. Further age constraint was not possible due to the scarcity of boulders on top of these crests, and no further evidence of moraines was observed on the steep valley walls bounding the Dalla Vedova valley.
Holocene moraines
We dated seven boulders from the outermost moraines found on both the right and left sides of the valley (Fig. 3). The most prominent continuous moraine (H1) in the field area is a right latero-frontal moraine system: on this landform, four out of five exposure ages overlap statistically and form a coherent population with a mean age and standard deviation of 870 ± 60 yr and a mean age with standard error of the mean of 870 ± 40 yr (850 ± 40, 820 ± 30, 870 ± 30, 950 ± 30 yr; Tables 1 and 2). One age outlier is excluded from a boulder on the highest part of the right lateral moraine farthest upflow (2240 ± 50 yr).
On the southwestern side of the valley, two samples were collected far up the highest outermost left lateral moraine mapped (H1?); these afforded two ages of 1730 ± 780 and 220 ± 20 yr. These two ages do not overlap with each other or with the ages of the H1 right latero-frontal moraine. It is not clear how the outermost left and right lateral moraines relate (Fig. 4). Nonetheless, we note that the 1730 ± 80 and 220 ± 20 boulders, along with the one outlier age on the east side of the valley (2240 ± 50 yr) come from boulders positioned farthest up the right and left laterals. Due to a lack of appropriate boulders, we could not provide cosmogenic age constraints for the inboard H2 moraine.
The H1 moraine complex is included in our dendrochronological transect. Stations 1 and 2 (Table 3), located on H1 (Fig. 3), yield minimum ages of ice retreat from this moraine, as occurring before AD 1778 and AD 1895, respectively. Stations 3 and 4, established on the proximal and distal sides of moraine H2, yield minimum ages of ice retreat before AD 1836 and AD 1873. Station 5, within the belt of recessional moraines, yields a minimum age of ice retreat before AD 1917.
Dendroglaciological data for the study area.a

a The oldest trees at each station are used to determine the minimum dates of landform stabilization. The minimum date of landform stabilization is given in years (Age max. [of tree]) AD, determined by adding a 41-yr ecesis correction to the oldest tree age from each station (see text for details).
Radiocarbon dating
We dated plant macrofossils and bulk organic sediment samples from four bog cores taken from the top of a 15-m-tall bedrock platform near the coast, at the extreme northern side of the study area (Figs. 3 and 4). Cores were composed exclusively of peat and gyttja within the top 4 m, but starting at depths of 4–5 m, we encountered down-core a substantial change in composition, from peat to dark brown gyttja and finally bluish-gray clay (Fig. 4). Organic loss-on-ignition profiles identified this visual transition as reflecting a change from predominantly inorganic to organic sediments up section. A notable feature was a yellowish, sandy, silicic band of no more than 0.5 cm thickness found between 5 and 10 cm above the visual organic–inorganic transition, interpreted as a tephra. Radiocarbon dating of the inorganic clay–organic silt transition yielded ages spanning 4960 to 4410 cal yr BP (4310 ± 30 to 4060 ± 30 14C yr; Table 4).
Analytical data for radiocarbon samples from the bog in the northern section of the study area.

a Ages calibrated using CALIB 8.2 and the SHCal20 curve (Hogg et al. Reference Hogg, Heaton, Hua, Palmer, Turney, Southon, Bayliss, Blackwell, Boswijk, Bronk Ramsey, Pearson, Petchey, Reimer, Reimer and Wacker2020) and in the last column they are reported as the 2-σ range.
DISCUSSION
To constrain the paleoglacial history of Dalla Vedova glacier, we use multiple approaches and encompass results from cosmogenic surface exposure dating, dendroglaciology, radiocarbon dating, and historical photo analysis tied to the geomorphic mapping. Noteworthy results that arise from reconstructing the paleoglacier record at Dalla Vedova glacier include at least: (1) evidence for a late-glacial event in Cordillera Darwin, overlapping in time with the ACR, with the extent limited to the valley; (2) after the late-glacial period, an expansion of the Dalla Vedova glacier at 870 ± 60 yr ago, which appears to be the Holocene maximum expansion; and (3) later glacial advances during the last couple centuries, with general net recession since the late nineteenth century.
Pre-Holocene events in the Cordillera Darwin
A10Be age of 16,460 ± 470 yr for the outermost L1 moraine (Fig. 3) offers tantalizing evidence of substantial and relatively rapid ice recession at the end of the LGM from limits in outer Bahia Inútil and Magallanes (~18 ka). Albeit a single age, it is consistent with the oldest minimum-limiting 14C ages for deglaciation of the northern Cordillera Darwin, by ~17 cal ka (Hall et al., Reference Hall, Porter, Denton, Lowell and Bromley2013, Reference Hall, Lowell, Bromley, Denton and Putnam2019; Fernández et al., Reference Fernández, Gulick, Rodrigo, Domack and Leventer2017). Furthermore, the age in Hall et al. (Reference Hall, Lowell, Bromley, Denton and Putnam2019) reflects initial deglaciation, whereas the Dalla Vedova 10Be age is on a moraine; that is, after deglaciation, an expanded glacier or recessional position. Additional chronology is needed from northeastern Darwin to obtain a more detailed deglacial chronology.
Subsequently, the L2 moraine formed, and two samples date to 13,250 ± 330 and 13,170 ± 360 yr. Albeit only two ages, they are identical within error and parallel evidence for an ACR glacial advance in the adjacent Cordillera Fueguina Oriental to the east (Menounos et al., Reference Menounos, Clague, Osborn, Davis, Ponce, Goehring, Maurer, Rabassa, Coronato and Marr2013). Hence, in both northeastern Darwin and Fueguina Oriental, observations demonstrate that local alpine glacier expansions were limited to the valleys. Such a finding is difficult to reconcile with a hypothesized major readvance of the Cordillera Darwin ice sheet to Isla Dawson during the ACR and instead is concordant with other studies demonstrating limited ACR ice extent relative to the LGM (Boyd et al., Reference Boyd, Anderson, Wellner and Fernández2008; Hall et al., Reference Hall, Porter, Denton, Lowell and Bromley2013; Bertrand et al., Reference Bertrand, Lange, Pantoja, Hughen, Van Tornhout and Wellner2017; Fernández et al., Reference Fernández, Gulick, Rodrigo, Domack and Leventer2017). An expanded glacier at ca. 13,200 yr ago coincides with relatively cool conditions of the ACR recorded in diverse climate proxies across South America and the Southern Hemisphere midlatitudes (e.g., Strelin et al., Reference Strelin, Denton, Vandergoes, Ninnemann and Putnam2011; Pedro et al., Reference Pedro, Bostock, Bitz, He, Vandergoes, Steig and Chase2016; Sagredo et al., Reference Sagredo, Kaplan, Araya, Lowell, Aravena, Moreno, Kelly and Schaefer2018; Reynhout et al., Reference Reynhout, Sagredo, Kaplan, Aravena, Martini, Moreno, Rojas, Schwartz and Schaefer2019; Mendelová et al., Reference Mendelová, Hein, Rodés and Xu2020).
Late Holocene glacier maximum
After late-glacial expansion, the next major moraine building event we observe is at 870 ± 60 yr, although some outlying 10Be dates may suggest earlier activity. There are no preserved frontal moraines between ACR time and the last millennium. With respect to our apparent outliers, which are farthest up the right and left lateral moraines, perhaps the highest samples comprise part of a compound moraine representing more than one expansion or the older samples were subject to 10Be inheritance (including reworking of older boulders). In addition, the left lateral may be actually older than the two discordant 10Be ages and the boulders may have been influenced by paraglacial or postglacial erosion or rockfall from the western valley side. Therefore, while there is equivocal evidence from the H1 lateral moraines for a glacial advance ca. 2200–1700 yr (Fig. 3), the frontal samples of H1 provide robust evidence of expansion culminating at 870 ± 40 yr.
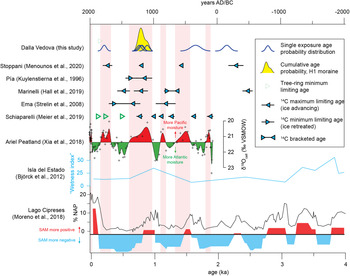
Within uncertainties, the timing of the 870 ± 60 event may overlap with glacial advances radiocarbon dated (ages relative to 1950, hence ~65 yr is subtracted from the Della Vedova record) in other sites in Cordillera Darwin (Fig. 5): Stoppani glacier, to the south (between 790 and 680 cal yr BP; Menounos et al., Reference Menounos, Maurer, Clague and Osborn2020) and Bahía Pía to the southwest, (between 950–680 and 710–520 cal yr BP; Kuylenstierna et al., Reference Kuylenstierna, Rosqvist and Holmlund1996). The Marinelli glacier immediately to the west registers advancing ice at 770–670 cal yr BP, which overlaps within error with the Dalla Vedova advance (Hall et al., Reference Hall, Lowell, Bromley, Denton and Putnam2019). In the eastern Cordillera Darwin, therefore, there appears to be considerable evidence for widespread glacial advances culminating at approximately 800 cal yr BP (ca. AD 1150). Differences between individual glaciers—most notably in terms of hypsometry, aspect, and how these elements interact with incident solar radiation and prevailing winds—might introduce local variability that could affect the specific response and/or magnitude of individual glacier expansions. This may include, for example, the precise timing for the start and end of the advances as recorded by the chronometers used in different respective studies and their uncertainties (i.e., centennial versus decadal)
Comparison of glacial records in the Cordillera Darwin (Kuylenstierna et al., Reference Kuylenstierna, Rosqvist and Holmlund1996; Strelin et al., Reference Strelin, Casassa, Rosqvist and Holmlund2008; Hall et al., Reference Hall, Lowell, Bromley, Denton and Putnam2019; Meier et al., Reference Meier, Aravena, Grießinger, Hochreuther, Soto-Rogel, Zhu, Pol-Holz, Schneider and Braun2019; Menounos et al., Reference Menounos, Maurer, Clague and Osborn2020), along with a reconstruction of moisture provenance in Tierra del Fuego using sphagnum cellulose δ18O (Xia et al., Reference Villa-Martínez, Moreno and Valenzuela2018), a precipitation reconstruction farther east from Isla del Estado (54.8°S, 64.4°W; Björck et al., Reference Björck, Rundgren, Ljung, Unkel and Wallin2012), and a southern Patagonian record of nonarboreal pollen slightly farther north at ~50°S, a proposed proxy for varying Holocene Southern Annular Mode (SAM)-like conditions (Moreno et al., Reference Moreno, Vilanova, Villa-Martínez, Dunbar, Mucciarone, Kaplan and Garreaud2018). Periods of inferred westerly intensification over Tierra del Fuego, per Xia et al. (Reference Villa-Martínez, Moreno and Valenzuela2018), are indicated by vertical pink shading. 10Be ages are also plotted, including inferred outliers.

On the other hand, available glacial records in the western Cordillera Darwin do not show evidence of glacial advance at this time (Strelin et al., Reference Strelin, Casassa, Rosqvist and Holmlund2008; Meier et al., Reference Meier, Aravena, Grießinger, Hochreuther, Soto-Rogel, Zhu, Pol-Holz, Schneider and Braun2019). It is important to note that most other studies in the Cordillera Darwin have utilized stratigraphic methods that date glacial advance and/or abandonment, whereas direct dating of moraines (as was conducted in our study) yields data about the culminations of glacial advances. Hence, it is possible these records are not inconsistent with one another.
Subsequently, the new dendroglaciological constraints for the age of the H2 moraine place formation before AD 1836 (~185 yr ago). Tentatively, we infer the H2 moraine in our study area may reflect an expanded glacier similar in time to the widespread eighteenth-century glacial advance observed at the nearby Stoppani glacier (Menounos et al. Reference Menounos, Maurer, Clague and Osborn2020) and in the western Cordillera Darwin (Strelin et al., Reference Strelin, Casassa, Rosqvist and Holmlund2008; Meier et al., Reference Meier, Aravena, Grießinger, Hochreuther, Soto-Rogel, Zhu, Pol-Holz, Schneider and Braun2019).
The late Holocene advance, 870 ± 60 yr ago, of the Dalla Vedova glacier appears to be its maximum Holocene extent. Holocene glacier maxima during the last millennium are a common feature of glaciers in Tierra del Fuego, although the timing may differ. For example, in the western Cordillera Darwin, the Ema glacier achieved its Holocene maximum at ca. 350 cal yr BP (Strelin et al., Reference Strelin, Casassa, Rosqvist and Holmlund2008); dendroglaciological constraints at the adjacent Schiaparelli glacier suggest its Holocene maximum extent was reached ca. AD 1750 (Meier et al., Reference Meier, Aravena, Grießinger, Hochreuther, Soto-Rogel, Zhu, Pol-Holz, Schneider and Braun2019). Stoppani glacier in the eastern Cordillera Darwin also reached its apparent maximum between 200 and 300 cal yr BP (Menounos et al., Reference Menounos, Maurer, Clague and Osborn2020). On the other hand, the tidewater Marinelli and Pia glacier systems reached their maxima somewhat earlier, at ca. 800 cal yr BP (Fig. 5; Kuylenstierna et al., Reference Kuylenstierna, Rosqvist and Holmlund1996; Hall et al., Reference Hall, Lowell, Bromley, Denton and Putnam2019). Only in the adjacent Cordón Martial to the east is evidence preserved of a mid-Holocene glacier maximum between ~7000 and 5000 cal yr BP (Menounos et al., Reference Menounos, Clague, Osborn, Davis, Ponce, Goehring, Maurer, Rabassa, Coronato and Marr2013). While a lack of preservation of moraines and other features of more-extensive pre–last millennium advances may be an issue, the ubiquity of maximum Holocene expansions after ca. 1000 yr across the Cordillera Darwin suggests that this is a defining pattern of glacial behavior within the region.
In our moraine chronology in Della Vedova, we do not find other evidence for other Holocene glacier advances that are identified in Darwin/Tierra del Fuego (Strelin et al., Reference Strelin, Casassa, Rosqvist and Holmlund2008; Hall et al., Reference Hall, Lowell, Bromley, Denton and Putnam2019; Meier et al., Reference Meier, Aravena, Grießinger, Hochreuther, Soto-Rogel, Zhu, Pol-Holz, Schneider and Braun2019; Menounos et al., Reference Menounos, Clague, Osborn, Davis, Ponce, Goehring, Maurer, Rabassa, Coronato and Marr2013, 2020). It is possible these events, often documented in stratigraphy elsewhere (except for Menounos et al., Reference Menounos, Clague, Osborn, Davis, Ponce, Goehring, Maurer, Rabassa, Coronato and Marr2013), may have occurred in the Dalla Vedova valley but are not well preserved in the moraine record (Fig. 4). Evidence for older Holocene advances might also be indirectly reflected in two of the 10Be age outliers on the far upper-left and upper-right laterals, especially if these moraines represent composite landforms. Boulder CD14-03-01 (exposure age: 2240 ± 50 yr) on the right lateral may correlate with advances ca. 2400–2000 cal yr BP at the nearby Stoppani and Marinelli glaciers (Hall et al., Reference Hall, Lowell, Bromley, Denton and Putnam2019; Menounos et al., Reference Menounos, Maurer, Clague and Osborn2020), while left lateral boulder CD15-01-02 (exposure age: 1730 ± 80 yr) may conform to the youngest age of population of trees killed by advancing ice at Schiaparelli glacier (Meier et al., Reference Meier, Aravena, Grießinger, Hochreuther, Soto-Rogel, Zhu, Pol-Holz, Schneider and Braun2019). However, such comparisons need additional data to confirm that the two age outliers are not coincidence.
The last millennium and dendroglaciology
The dendroglaciologic age constraint on abandonment of the H1 moraine (~200 yr, or earlier than AD 1778) considerably underestimates the age of the moraine as determined by 10Be dating (~870 ± 60 yr, or approximately AD 1150). This result is perhaps unsurprising, given that the maximum life span of an individual of N. betuloides in Tierra del Fuego has been estimated to be ~450 yr (Rebertus and Veblen, Reference Rebertus and Veblen1993); current forest growth appears to represent secondary or tertiary colonization. Furthermore, the age constraint on the H1 moraine crest (Station 2; AD 1895) is younger than the age constraint on H1 ground moraine further west (Station 1; AD 1778). This age “inversion” suggests that other factors, such as substrate, may influence apparent colonization ages in newly deglaciated settings, and caution must be used when applying ecesis values universally across geomorphically diverse landscapes.
The comparison between tree-ring and 10Be analyses has important implications for the use of dendrochronologic methods to time ice retreat. First, this is the second study from southernmost South America to utilize 10Be cross-dating of Nothofagus-dated surfaces to demonstrate significant underestimation of abandonment ages using dendrochronology. Reynhout et al. (Reference Reynhout, Sagredo, Kaplan, Aravena, Martini, Moreno, Rojas, Schwartz and Schaefer2019) showed that moraines dated to the seventeenth century based on Nothofagus tree-ring counts were several thousand years old; notably, a ca. 500-yr-old moraine was completely barren of tree growth. One possible interpretation is that contemporary ecesis values do not adequately represent past ecesis times in former climate conditions that may have been unfavorable to tree establishment (e.g., colder). Alternatively, as no evidence for prior generations of tree growth were observed in our study area (snags, numerous downed logs, etc.), all growth was assumed to be first generation. Our results may suggest that tree decay in the Cordillera Darwin can occur on a fast enough time scale to erase evidence for earlier generations, making field determination of forest generation challenging—indeed, the absence of evident first-generation growth is in accord with experimentally derived half-lives (<70 yr) of decimeter-scale boles of Nothofagus pumilio in Tierra del Fuego (Frangi et al., Reference Frangi, Richter, Barrera and Aloggia1997).
Finally, current growth may represent forest response to non-geologic events. For instance, farther west, the oldest samples of N. betuloides near the Schiaparelli glacier (ca. AD 1750; Meier et al., Reference Meier, Aravena, Grießinger, Hochreuther, Soto-Rogel, Zhu, Pol-Holz, Schneider and Braun2019) parallel the oldest germination date found in our study area (ca. AD 1820). While it is possible that these ages more closely bracket the actual ages of glacial retreat than in our area, it is also possible that trees across the region have grown synchronously in response to biological or climatic constraints, independent of glacial activity. Our results suggest that the approximate age constraints obtained by dendroglaciological techniques at Schiaparelli may not closely bracket the true age of these moraines, and caution is demanded when using this method for dating ice-marginal positions that may be older than 200 yr using Nothofagus species.
Closer to the present glacial margin, dendroglaciological constraints on the H2 (youngest Holocene in Fig. 3) moraines are also interpreted as minimum ages for the timing of ice retreat. In the case of the youngest tree colony that is inboard of H2 (established ca. AD 1986), colonization closely postdated ice abandonment, which using aerial photographic constraints from 1945 occurred not more than ~40 yr before initial tree growth (Fig. 3). Hence, using an ecesis value of 41 yr, this suggests the Dalla Vedova glacier may have receded from its latest Holocene position (H2) after AD 1873 (Station 4; inboard ages of H2) and certainly no later than AD 1836 (outwash immediately outboard of H2). We do, however, acknowledge that retreat may have occurred up to hundreds of years earlier from the H2 position, given the uncertainties raised with the H1 moraine.
Since approximately AD 1836, the dendrochronologic results provide information on the pace of glacial retreat over approximately the last two centuries. Multiple terminal moraines are marked over several hundred meters (Fig. 3). From not later than AD 1836 to not later than AD 1917, the glacial margin retreated about ~500 m, and at approximately AD 1917 stood roughly halfway between the early nineteenth century and the modern limit. Then, about 200–300 m of retreat occurred from the pre-AD 1917 to the AD 1945 limit, which is documented with an aerial photo. Since approximately AD 1945, the location of the present ice front has retreated <1000 to ~2500 m, the exact amount depending on placement along the margin.
Possible cause of a late Holocene expansion ~900 to ~800 yr ago
An advance between ~900 and ~800 yr ago is unusual compared with other evidence for southern South American glacier behavior. Across Patagonia, evidence is generally lacking for any glacial advance during this interval (Masiokas et al., Reference Masiokas, Rivera, Espizua, Villalba, Delgado and Aravena2009; Aniya Reference Aniya2013). At the head of Lago Argentino, the Upsala glacier at Lago Pearson may have been expanded until close to 1000 yr ago, given one sample age of ~960 ± 30 (Kaplan et al., Reference Kaplan, Schaefer, Strelin, Denton, Anderson, Vandergoes and Finkel2016). Regardless, in general, Patagonian glaciers reached their maximum Holocene positions earlier, during the middle or early Holocene (Aniya, Reference Aniya2013; Kaplan et al., Reference Kaplan, Schaefer, Strelin, Denton, Anderson, Vandergoes and Finkel2016; Reynhout et al., Reference Reynhout, Sagredo, Kaplan, Aravena, Martini, Moreno, Rojas, Schwartz and Schaefer2019); the advances of the last millennium started around or after ~700 yr ago (Strelin et al., Reference Strelin, Kaplan, Vandergoes, Denton and Schaefer2014; García et al., Reference García, Hall, Kaplan, Gómez, De Pol-Holz, García, Schaefer and Schwartz2020).
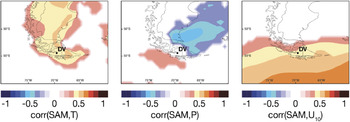
What drove this seemingly anomalous glacial advance at the southernmost tip of South America around 900–800 yr ago? We speculate that a southward shift or enhanced westerly flow over the Cordillera Darwin during this time may have positively affected the mass balance of Dalla Vedova glacier, resulting in an advance (Fig. 6) that is not observed farther north in the rest of Patagonia. Independent paleoclimate proxies provide evidence for enhanced westerly flow and Pacific-derived moisture over Tierra del Fuego from ~1000 to ~700 yr ago (Xia et al., Reference Villa-Martínez, Moreno and Valenzuela2018; Fig. 5), as well as wetter conditions in eastern Tierra del Fuego (Björck et al., Reference Björck, Rundgren, Ljung, Unkel and Wallin2012). The period from ~1100 to ~800 yr ago is associated with generally persistent positive SAM-like conditions (Abram et al., Reference Abram, Mulvaney, Vimeux, Phipps, Turner and England2014; Moreno et al., Reference Moreno, Vilanova, Villa-Martínez, Dunbar, Mucciarone, Kaplan and Garreaud2018; Fig. 5). In instrumental climate reanalyses, a pattern of enhanced westerly circulation shifted southward over Tierra del Fuego, coincident with more frequent episodes of positive SAM, is observed (Garreaud et al., Reference Garreaud, Lopez, Minvielle and Rojas2013), perhaps providing a modern analog for our 10Be-dated event at 900–800 and past decadal to centennial shifts in the winds (Moreno et al., Reference Moreno, Vilanova, Villa-Martínez, Dunbar, Mucciarone, Kaplan and Garreaud2018).
Correlations (corr) at the 95th percentile between annual temperature (T), precipitation (P), and 10-m zonal wind (U10) from ERA-Interim and the Marshall (Reference Marshall2003) instrumental index of the Southern Annular Mode (SAM). DV, Dalla Vedova glacier. Graphics produced by the University of Maine Climate Reanalyzer (https://climatereanalyzer.org).

In this hypothesized scenario, positive SAM-like conditions were associated with a southward shift of the zone of most intense westerlies. Similar to the modern condition (Villalba et al., Reference Villalba, Lara, Boninsegna, Masiokas, Delgado, Aravena, Roig, Schmelter, Wolodarsky and Ripalta2012; Moreno et al., Reference Moreno, Vilanova, Villa-Martínez, Dunbar, Mucciarone, Kaplan and Garreaud2018), a shift towards persistently positive SAM would have resulted in warm and dry conditions over most of Patagonia, except at the southern tip of South America, where the southerly shift of the core of the westerlies resulted in increased cloudiness and precipitation (Fig. 6). Within eastern Cordillera Darwin, the enhanced accumulation and reduced ablation (e.g., less ablation when it is snowing or increased cloudiness in general) might have been sufficient to drive localized glacial advances at Dalla Vedova and possibly in other nearby areas of Tierra del Fuego such as Bahía Pía (Fig. 5). At present, the summer westerlies are focused around ~50°S–52°S. Glacial advances during the interval AD 800 to AD 1100 may imply the core was closer to ~55°S, affecting Pia and Dalla Vedova (Xia et al., Reference Villa-Martínez, Moreno and Valenzuela2018; Fig. 6). A possible weakness in this explanation is that it does not sufficiently explain the lack of advances in the western side of Darwin from ~1000 to 800 yr ago, unless sharp west to east climatic gradients are assumed. Regardless of the cause, our findings highlight that additional records are needed to elucidate the spatial variability in glacial expansion and retreat across southernmost South America during the last millennium and prior.
Interpreting basal radiocarbon ages
The sediment cores extracted from the northern part of the study area bear visual similarities to the “transition zone” from glacial clay to lacustrine silt defined by Hall et al. (Reference Hall, Porter, Denton, Lowell and Bromley2013), including a thin tephra stratigraphically above the transition. However, our coherent ages differ from those in Hall et al. (Reference Hall, Porter, Denton, Lowell and Bromley2013), and yield four statistically overlapping mid-Holocene ages for the transition in four respective cores (Fig. 4). The chronology suggests the tephra observed in our cores is not the Reclus tephra, but rather the MB2 tephra from Mount Burney (5290-3240 cal yr BP; Stern, Reference Stern2008) and challenges our initial interpretation (in the field) of the sedimentary record as representing the age of deglaciation from the valley.
We favor the interpretation that this core transition marks a shift from a nearshore lagoonal environment to a terrestrial bog, marking a relative sea-level regression between 4.8 and 4.5 ka. This interpretation corresponds with the regional relative sea-level history (Porter et al., Reference Porter, Stuiver and Heusser1984) and nearby (~50 km away) observations in the Beagle Channel of raised shorelines dating to the middle Holocene (Gordillo et al., Reference Gordillo, Bujalesky, Pirazzoli, Rabassa and Saliège1992; Bujalesky Reference Bujalesky2007). Storms at high tide may have further contributed to creating a brackish lagoon setting. As the present bog surface lies at approximately 15 m amsl, a sample depth of approximately 5 m implies at least 10 m of local sea-level regression over the last 4500 yr; this equates to an uplift rate of >2.2 mm/yr. This is similar to, but slightly higher than the maximum uplift rates of 1.5–2.0 mm/yr estimated from nearby raised Holocene beaches in the Beagle Channel (Bujalesky, Reference Bujalesky2007). Higher rates of coastal uplift adjacent to Seno Almirantazgo could also be explained, however, by increased isostatic rebound closer to the core of the former ice sheet over Cordillera Darwin and/or uplift due to neotectonic influence from the Carbajal Valley Fault, which crosses just north of the field area (CF on Fig. 1). Supporting this assertion is a 16,000-yr-old bog core from Punta Esperanza in Hall et al. (Reference Hall, Porter, Denton, Lowell and Bromley2013); at a surface height of 11 m asl, the core shows no evidence of marine sedimentation, suggesting our core preserves the local marine regression.
Another interpretation of these cores could be that the inorganic-to-organic transition marks a transition from glaciolacustrine clay to a terrestrial bog, similar to Hall et al. (Reference Hall, Porter, Denton, Lowell and Bromley2013). With this interpretation, the basal ages should provide a minimum date for Holocene ice retreat from the northern margin of our study area. The transition from inorganic to organic sedimentation does, sensu strictu, define a minimum age of deglaciation in the zone. However, no other evidence for extensive middle Holocene ice exists in this valley. Additionally, such a scenario would need to be reconciled with the geomorphologic position of the ACR-age L2 moraine ~1 km upvalley, where it extends down to an elevation similar to that of the core site. While it is conceivable that the blue-gray clay at the bottom of the core represents a proglacial facies associated with late-glacial advances of the Dalla Vedova glacier, this would then demand a depositional hiatus of more than 8000 yr in what is a wet environment favorable for organic sedimentation.
Summary and conclusions
10Be and 14C dating, dendrochronology, and historical observations were used to document and understand the glacial history of the Dalla Vedova valley from deglacial time up until the last few decades. After deglacial ice recession before ~16.5 ka (albeit, n = 1), two coherent 10Be ages on the same moraine crest provide evidence for the ACR impacting the climate and glaciers of the Cordillera Darwin. Notably, the geomorphology at Dalla Vedova supports an ACR alpine glacier advance limited in extent to its valley, which is similar to that observed at Marinelli glacier (Boyd et al., Reference Boyd, Anderson, Wellner and Fernández2008; Hall et al., Reference Hall, Lowell, Bromley, Denton and Putnam2019); both sites—at or near sea level—suggest that in the southernmost part of the continent, the deglacial collapse of the Patagonian Ice Sheet was not followed by an extensive ice sheet–sized glacial readvance during the ACR. After the late-glacial advance, the area may record evidence of a mid-Holocene relative sea-level regression. The next recorded glacial expansion at Dalla Vedova was 870 ± 60 yr ago (approximately AD 1150) and was land-terminating. Then, minimum dendrochonologic results document an expanded glacier soon before AD 1836, with several less-extensive moraine-building events punctuating a generalized retreat up until the present day.
Our finding adds to an apparently coherent pattern throughout the Cordillera Darwin of maximum Holocene expansions during the last ~1000 yr (e.g., Kuylenstierna et al., Reference Kuylenstierna, Rosqvist and Holmlund1996; Strelin et al., Reference Strelin, Casassa, Rosqvist and Holmlund2008; Hall et al., Reference Hall, Lowell, Bromley, Denton and Putnam2019) that differs from the pattern of progressively less-extensive Holocene glacier advances to the north in Patagonia (Kaplan et al., Reference Kaplan, Schaefer, Strelin, Denton, Anderson, Vandergoes and Finkel2016; Reynhout et al., Reference Reynhout, Sagredo, Kaplan, Aravena, Martini, Moreno, Rojas, Schwartz and Schaefer2019), and to the south on James Ross Island (Kaplan et al., Reference Kaplan, Strelin, Schaefer, Peltier, Martini, Flores, Winckler and Schwartz2020). That is, any mid- to early Holocene expansions in Darwin were less extensive than glacial advances during the last millennium, although we note that a mid- to early moraine is dated in the Darwin-adjacent Cordón Martial (Menounos et al., Reference Menounos, Clague, Osborn, Davis, Ponce, Goehring, Maurer, Rabassa, Coronato and Marr2013). The timing of the advance at 870 ± 70 yr ago (approximately AD 1150) may also suggest a different pattern of glacial advances in the Darwin region when compared with the rest of Patagonia (Menounos et al., Reference Menounos, Clague, Osborn, Davis, Ponce, Goehring, Maurer, Rabassa, Coronato and Marr2013; Hall et al., Reference Hall, Lowell, Bromley, Denton and Putnam2019). While glaciers at Bahía Pía in the eastern Cordillera Darwin may have advanced at a similar time, we are aware of no glaciers in continental Patagonia that left robust evidence (i.e., obtained so far) of expansions around ~900 to ~800 yr ago (Kuylenstierna et al., Reference Kuylenstierna, Rosqvist and Holmlund1996; Masiokas et al., Reference Masiokas, Rivera, Espizua, Villalba, Delgado and Aravena2009; Fig. 6).
We hypothesize a southward shift of the westerlies over the southernmost tip of the continent from ~900 to ~800 yr ago. The shift or change in intensity may have been associated with a persistently-positive phase of SAM-like conditions. By this mechanism, some glaciers could advance locally during what is generally considered an otherwise warm period to the north in Patagonia (Fig. 2). We offer two ways to test this hypothesis. First, additional paleoecological records from throughout Darwin could discern increased precipitation and cooler summers (Xia et al., Reference Villa-Martínez, Moreno and Valenzuela2018) during this interval. Second, in a continental-wide study, Sagredo et al. (Reference Sagredo, Rupper and Lowell2014) found different glacial sensitivities to climate changes between Patagonia and Tierra del Fuego, which may be evident in past glacier reconstructions. In the present day, certain glaciers in the Darwin exhibit seemingly anomalous behavior, at least on decadal time scales. Some glaciers have arrested their multidecadal trend of retreat or have gained mass in recent years (López et al., Reference López, Chevallier, Favier, Pouyaud, Ordenes and Oerlemans2010; Melkonian et al., Reference Melkonian, Willis, Pritchard, Rivera, Bown and Bernstein2013). Possibly, by analogy, there has been a recent multidecadal increase in westerly wind intensity and precipitation over extreme southwestern South America (Aravena and Luckman, Reference Aravena and Luckman2009) that may explain in part such behaviors. Hence, improved insight into recent glacial behavior over the last few decades (e.g., Holmlund and Fuenzalida, Reference Holmlund and Fuenzalida1995) may lead to causal understanding of past patterns in the paleo-record at the southern tip of the continent.
Acknowledgments
We thank N. Saffie, I. Dussaillant, E. Fercovic, and G. Ossa for their assistance in the field and media outreach and J. Hanley for laboratory assistance.
Financial Support
This project was supported by the ANID Millennium Science Initiative/Millennium Nucleus Paleoclimate NCN17_079; CONICYT Colaboración Internacional USA2130035; and FONDECYT 1180717. SAR is a recipient of a CONICYT-PCHA Beca de Doctorado Nacional (year 2015); JMS acknowledges support by NSF-1853705 and NSF-1853881 and the Vetlesen Foundation; and MRK and JMS acknowledge support by NSF-1804816.