
I. INTRODUCTION
5052 Al alloy is a typical 5xxx Al–Mg alloy in industrial applications and has been widely used due to its high specific strength, excellent corrosion resistance, and good formability. However, its relatively low strength limits its application. Reference Liu, Ohotnicky, Adams, Rohrer and Hyland1 Severe plastic deformation (SPD) techniques, Reference Valiev, Islamgaliev and Alexandrov2–Reference Valiev, Estrin, Horita, Langdon, Zehetbauer and Zhu4 such as accumulative roll bonding (ARB), Reference Tsuji, Saito, Utsunomiya and Tanigawa5,Reference Pirgazi, Akbarzadeh, Petrov and Kestens6 equal channel angular pressing (ECAP), Reference Zhu and Lowe7–Reference Tsai, Sun, Kao and Chang11 and high pressure torsion (HPT), Reference Liu, Roven, Liu, Murashkin, Valiev, Ungar and Balogh12,Reference Cao, Wang, Figueiredo, Chang, Liao, Kawasaki, Zheng, Ringer, Langdon and Zhu13 have been extensively used to process metals, including Al and Al alloys with ultrafine grains (UFGs, grain size below 1000 nm). Reference Valiev, Estrin, Horita, Langdon, Zehetbauer and Zhu14 The strength of these SPD-processed materials can be improved significantly by grain refinement and/or by introducing some specific structures such as nanotwins, stack faults, and non-equilibrium grain boundaries. Reference Zhu, Liao and Wu15,Reference Jian, Cheng, Xu, Yuan, Tsai, Wang, Koch, Zhu and Mathaudhu16 For the 5052 Al alloy, microstructures formed during the SPD processes Reference Tsai, Sun, Kao and Chang11,Reference Ko17–Reference Chen, Huang, Chang and Kao23 mainly consist of elongated and equiaxed UFGs, dislocation cells, and dislocation tangles. Nano-grains were formed in HPT-processed 5052 Al alloy and were attributed to the high strain-induced dislocation activities. Reference Liu, Roven, Liu, Murashkin, Valiev, Ungar and Balogh12
Low ductility is a bottleneck for the application of SPD-processed UFG materials, which is attributed to insufficient strain hardening ability of the materials. Reference Zhu and Liao24,Reference Meyers, Mishra and Benson25 Extensive efforts have been devoted to improve the ductility of UFG materials. Reference Lu26 Very recently, gradient structured (GS) materials, that is, a spatial gradient in grain size of a metal from nanostructures in the top surface to the coarse grains in the center, have attracted extensive attention due to their unique microstructures and mechanical properties, especially a good strength–ductility synergy. Reference Fang, Li, Tao and Lu27–Reference Wu, Jiang, Chen and Zhu30 Widely used techniques for preparing gradient materials include surface mechanical attrition treatment (SMAT), Reference Lu and Lu31,Reference Lu and Lu32 surface mechanical grinding treatment (SMGT), Reference Li, Tao and Lu33,Reference Liu, Zhang and Lu34 and newly developed rotationally accelerated shot peening (RASP). Reference Wang, Li, Zhang, Zhao and Zhu35 The RASP is a variant of SMAT but has a wider range of shot-ball diameter, and the impact velocity can be easily adjusted according to the materials processing requirement.
The effect of high strain rate deformation on the microstructural evolutions of 5052 Al alloys is still unclear, and the mechanical properties of 5052 Al alloys with gradient structures have not been fully investigated. Therefore, the objective of the present work is to study the microstructural evolution and the grain refinement mechanism of a 5052 Al alloy subjected to RASP treatment. The mechanical properties of the resultant bulk 5052 Al alloy with gradient structures will be studied.
II. EXPERIMENTAL
Commercial 5052 Al alloy sheets with a chemical composition of 2.5Mg, 0.4Fe, 0.3Cr, 0.25Si, 0.10Mn, 0.10Cu, 0.10Zn, 0.2 others, and the balance Al in wt% were used as the model material for processing by RASP. The 5052 Al alloy sheets with a dimension of 120 × 90 × 4 mm3 (4 mm in thickness) were homogenized at 823 K for 30 min and furnace cooled to obtain coarse-grained (CG) structure prior to RASP treatment. The details of the RASP setup and processing have been described previously. Reference Wang, Li, Zhang, Zhao and Zhu35 In brief, 2 mm-diameter steel balls were accelerated to a high speed by the centrifugal force and to impact the metal surface. During the RASP process, the 5052 Al alloy samples were rotated at a speed of 15 rpm; therefore, both sides of the samples were processed, forming a sandwich of two GS layers and a CG center layer. To process 5052 Al alloy sheets with different microstructures and mechanical properties, several RASP treatment durations and ball velocities were chosen. A 5052 Al alloy sample subjected to RASP treatment with a ball velocity of 50 m/s and a duration of 5 min (referred as 50 m/s-5 min hereafter) was chosen as a representative material for microstructure characterization and mechanical testing.
An optical microscope (OM; Axio Vert A1, Carl Zeiss AG, Oberkochen, Germany) was used to observe the holistic microstructure of the deformed 5052 Al alloy. For OM observations, the samples were prepared by mechanical grinding and polishing followed by anodic coating. Anodic oxidation was carried out in a solution of 40% fluorine boric acid at the voltage of 18 V for 5 min. The detailed microstructures and quantitative microstructure statistics of the samples were characterized by means of transmission electron microscopy (TEM), performed on an FEI Tecnai G2 20 TEM (FEI, Hillsboro, Oregon) at an operation voltage of 200 kV. Cross-sectional thin foils for TEM observations were prepared in the following steps: (i) carefully mechanically grinding foils to less than 40 μm thickness; (ii) punching the ∼40 μm foil into semicircles with a diameter of 3 mm with the treated surface in the middle; (iii) sticking the two semicircles on a brass ring with a diameter of 3 mm using AB glue, with the RASP treated sides lie in the center of the ring; and (iv) ion thinning the specimen at room temperature with an accelerating voltage of 3 kV. Electron backscatter diffraction (EBSD) analysis was performed on a FEI Quant 250 FEG scanning electron microscope (SEMFEI, Hillsboro, Oregon), and the samples for EBSD analysis were obtained by mechanical grinding and polishing followed by electro-polishing at room temperature. EBSD analysis was carried out with 12 kV applied voltage and a scanning step size of 0.5 μm.
Microhardness measurements were carried out on a Shimadzu microhardness tester (Shimadzu Corp., Kyoto, Japan) with a load of 25 g and a loading time of 15 s for each indent. The hardness value obtained was averaged from at least 20 indentations for each sample. Uniaxial tensile tests were performed on a Walter + bai LFM20 KN tensile test machine (walter+bai ag Testing Machines, Löhningen, Switzerland) with a strain rate of 6.7 × 10⁻⁴ s−1 at room temperature. A contactless laser extensometer was used to measure the sample strain upon loading. The gauge section of the dog-bone-shaped tensile specimens was 25 mm in length and 2 mm in width. More than four tensile tests were performed on each sample to guarantee the reliability of the data.
III. RESULTS AND DISCUSSION
A. OM/EBSD observations
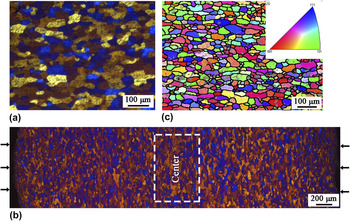
Figures 1(a) and 1(b) show cross-sectional OM micrographs of the annealed and 50 m/s-5 min RASP-processed 5052 Al alloy samples, respectively. Equiaxed grains with an average size of 70 μm were observed in the annealed sample [Fig. 1(a)]. Apparently, the equiaxed coarse grains were deformed into elongated grains perpendicular to the RASP direction [Fig. 1(b)], where the left and right sides are the outermost layers of the RASP-processed sample (the black arrows refer to the RASP direction). Note that the RASP imposed deformation penetrated through the whole 4 mm-thickness of the sample, which indicates high deformation energy of RASP processing. The surface of the RASP-processed sample is rough, together with the obvious contrast difference, showing the severe local inhomogeneity of the deformation structures.
OM micrographs of (a) an annealed 5052 Al alloy and (b) 50 m/s-5 min RASP-processed 5052 Al alloy; (c) an EBSD image of the center microstructures enlarged from (b). The black arrows in (b) give the loading direction of RASP processing.

Figure 1(c) shows a typical EBSD image of the microstructures in the center region marked with a white rectangle in Fig. 1(b). It can be seen that the grains are elongated perpendicularly to the RASP direction, and the mean transverse grain size (short axis) is 25 μm, which is much finer than that of ∼70 μm in the CG sample, indicating an obvious grain refinement even in the center region. Moreover, color and contrast variation caused by grain orientation variations exist in the grain interiors, indicating the formation of subgrains and dislocation cells formed by dislocation activities that may include interaction, accumulation, annihilation, and recovery.
Statistical measurements of the longitudinal (D L, perpendicular to RASP loading direction) and transverse grain sizes (D T, parallel to RASP loading direction) indicated that the average aspect ratio, D L/D T, decreases with the increase of depth to the surface. For instance, the average aspect ratio is 4.0 at the depth of 200 μm and 2.2 at the center (2000 μm). On the contrary, the average D T increased with the increase of depth to the surface. The mean values for D T at depths of 200 μm, 500 μm, 1000 μm, and 2000 μm are 11 μm, 16 μm, 22 μm, and 25 μm, respectively.
B. TEM characterization
RASP-processed samples at various depths were characterized using cross-sectional TEM observations to reveal the microstructural characteristics at different levels of strain and strain rate, and thereby to uncover the underlying grain refinement mechanism. Two different grain refinement mechanisms can be noticed: in the deformation layer (>40 μm depth), grain refinement was primarily achieved by dislocation activities, while in the top layer (<40 μm depth), dynamic recrystallization (DRX) played a primary role. In the following sections, the two grain refinement mechanisms will be described in detail.
1. Grain refinement via dislocation activities (depth > 40 μm)
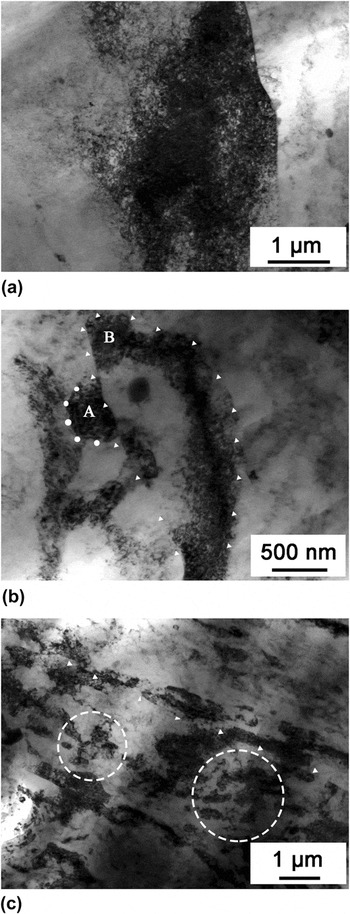
In the depth range of 200–2000 μm (center), the microstructures mainly consist of dislocation debris and dislocation entanglement. Figures 2(a)–2(c) show the typical TEM micrographs obtained from the region of 200 μm, 100 μm, and 60 μm below the surface, respectively. High density of dislocation was found in 200 μm depth and dislocation entanglements were formed near a grain boundary, as shown in Fig. 2(a). In the depth of 100 μm [Fig. 2(b)], grain boundaries of an elongated grain (marked by white triangles) can be seen. In addition to dislocation entanglements and dislocation walls, there are small subgrains present at the elongated grain boundary. The internal contrast of subgrains formed near the grain boundaries is not uniform, which is caused by internal defects, mainly dislocations. For instance, the boundary shared between subgrain A and the elongated grain is sharp, while the boundary formed with dislocation walls is wavy and not well delineated (marked by white circles), which is a typical grain boundary morphology caused by SPD. Reference Horita, Smith, Nemoto, Valiev and Langdon36–Reference Cao, Wang, An, Liao, Kawasaki, Ringer, Langdon and Zhu38 High density of dislocation was found in subgrain B whose boundary is poorly defined. It is believed that with increasing deformation strain, more dislocations will accumulate at the boundaries of subgrains A and B, and high-angle grain boundaries will be developed. Reference Valiev, Islamgaliev and Alexandrov2,Reference Kawasaki, Horita and Langdon9 A typical TEM micrograph taken from the region where is ∼60 μm below the treated surface is shown in Fig. 2(c). The microstructure mainly consists of elongated subgrains and dislocation cells. Grain boundaries of the subgrains are not sharp because of large deformation. The grain boundaries of the original large grains gradually become curved and fuzzy (marked by white triangles). White dotted circles mark some subgrains aggregations.
Typical TEM micrographs obtained from the region of (a) 200 μm; (b) 100 μm; and (c) 60 μm beneath the treated surface.

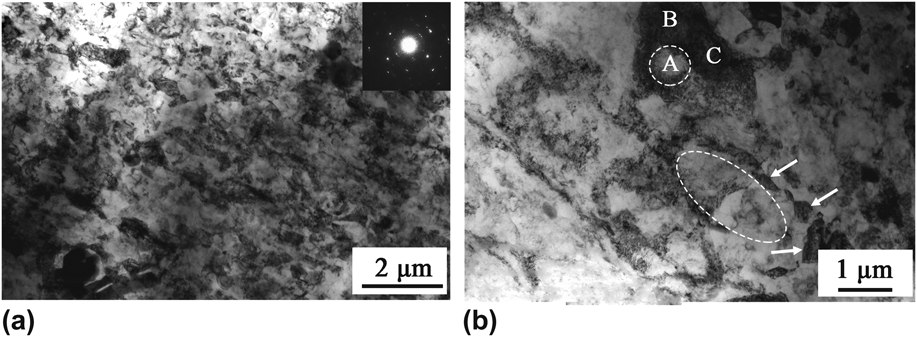
Figure 3 shows typical TEM images at 40 μm beneath the surface in an RASP-processed sample. The microstructures shown in Figs. 3(a) and 3(b) are distinctly different, indicating the inhomogeneous nature of the high strain rate RASP deformation. Microstructures in Fig. 3(a) consist of many small subgrains with poorly defined boundaries. The sizes of the subgrains are in the range of several hundred nanometers. Dislocation density is high both at interior and at grain boundaries. Selected area electron diffraction (SAED; 600 nm in diameter) pattern shows elongated spots, which indicate polycrystals with small misorientations between these subgrains. Figure 3(b) shows typical dislocation morphology with a high density of dislocation walls, dislocation cells, and dislocation entanglements. With increasing strain, some big dislocation cells evolve into subgrains with smaller dislocation cells formed in their interior, such as dislocation cells A, B, and C. The dislocation cells are low energy dislocation structures typically formed during the deformation of metals with medium- to high-stacking fault energies. For the subgrain that generate dislocation cells A, B, and C, the dislocations accumulate further with increasing deformation strain, and the dislocations slip to form new dislocation cells to reduce the total energy. Dislocation cells typically have low dislocation densities at interiors. This phenomenon is similar to what has been observed in different-speed-rolling-processed 5052 Al alloy. Reference Ko17 Unlike the dislocation cell A, the dislocation densities are relatively high in both the interior and dislocation walls for cells B and C. The subgrains marked by white arrows in Fig. 3(b) have certain regularity and maybe formed along some grain boundary, which agrees with the phenomenon that dislocation cells and subgrains are preferentially formed at grain boundaries.
Typical TEM micrographs obtained from the region of 40 μm beneath the treated surface.

2. Grain refinement via DRX (depth < 40 μm)
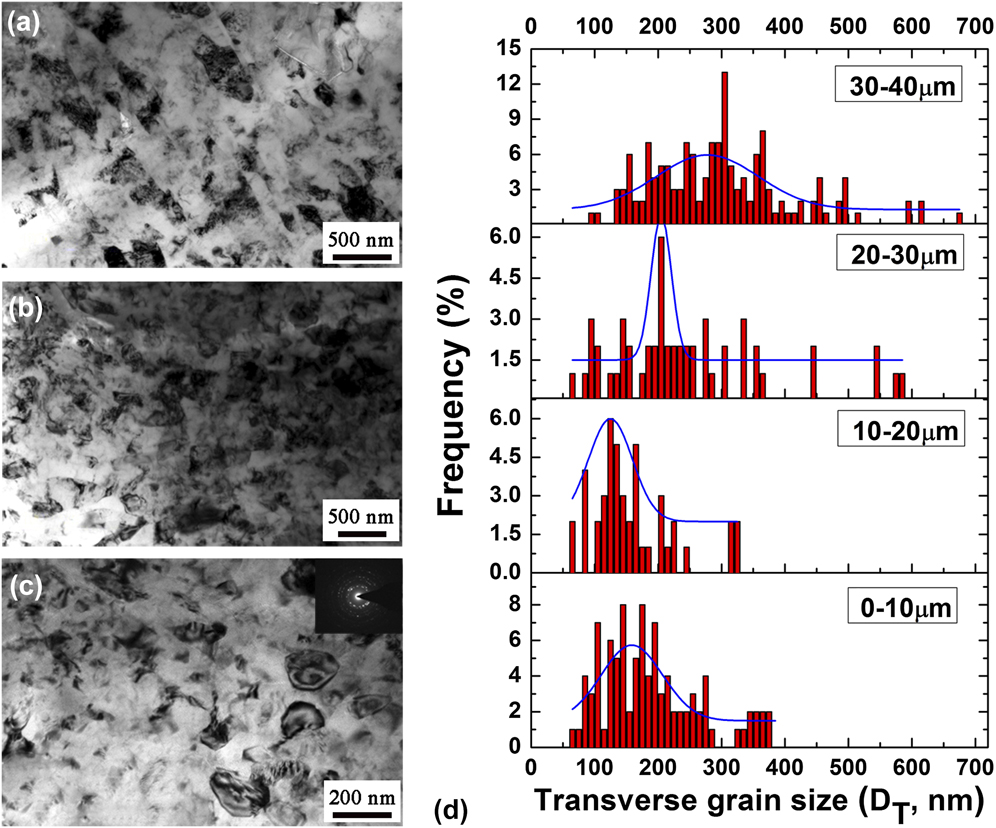
Figures 4(a)–4(c) show typical TEM micrographs of the RASP-processed 5052 Al alloy sample at the depth of 20 μm, 10 μm, and 0 μm (topmost) from the surface, respectively. With increasing deformation strain, transverse boundaries within elongated subgrains were formed, which results in the reduction of the aspect ratios of subgrains. It has been proved that the smaller aspect ratio in UFG will affect mechanical properties of materials by inhibiting the formation of dislocation cells during tensile deformation. Reference Park and Shin39 Similar to that of 5052 Al alloy processed by ECAP, Reference Tsai, Sun, Kao and Chang11 the microstructures at 20 μm depth mainly consist of elongated/equiaxed subgrains, and the dislocation density is lower than that at the depth >40 μm, implying dynamic recovery that is probably due to the temperature rise induced by the RASP treatment. Parallel, long black and gray bands known as banded-contrast image (BCI) were also observed in Fig. 4(a). It was believed that this phenomenon was formed from strain fields of high density dislocations. Reference Zhu, Huang, Gubicza, Ungar, Wang, Ma and Valiev40 For dislocations that are approximately parallel to each other or even with the same Burgers vector, it will generate BCI when they are oriented to a certain angle to the strain field. The elongated subgrains in other reports always have high dislocation densities within well-defined boundaries. Reference Tsai, Sun, Kao and Chang11,Reference Lee, Shin and Nam19,Reference Song, Kim and Nam41
Typical TEM micrographs obtained from the region of (a) 20 μm, (b) 10 μm beneath the treated surface, and (c) the topmost surface; (d) the grain size distributions at different regions as indicated, and the blue lines represent mathematical fittings.

The microstructures at 10 μm depth show randomly oriented UFGs [Fig. 4(b)]. The grain boundaries are distinguishable but not very sharp and have a strong spread in terms of thickness extinction contours, implying large internal stress and lattice distortions. Figure 4(c) gives the microstructures at the topmost layer, all of which are basically equiaxed grains with sharp grain boundaries. The inserted SAED pattern taken from an area with a diameter of 600 nm contains well-defined rings demonstrating the formation of fine grains with random misorientations.
Systematic TEM observations showed that the transverse sizes of subgrain/grain vary with the depths. Figure 4(d) gives the transverse grain sizes (D T) at the depth range of 30–40, 20–30, 10–20, and 0–10 μm. The grain sizes in these different depth ranges are nearly normally distributed. In the depth range of 30–40 μm, the average grain size is ∼300 nm with very few grains having sizes less than 100 nm. With decreasing depth, the grain size distribution curves move leftward, and the average grain size in 10–20 μm depth region is the smallest (∼160 nm). Some grains with sizes less than 100 nm were found in the depth of 0–30 μm, which indicates that RASP treatment is effective for the grain refinement of 5052 Al alloy.
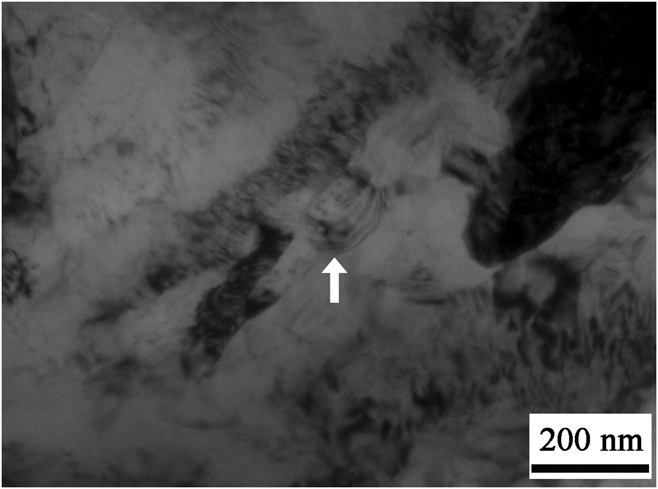
It is difficult for pure Al and Al alloy to be refined to nano-regime because of their high stacking fault energies (SFEs) and low melting temperature. In the 40 μm depth from surface, DRX is believed to play an important role. It is well known that DRX occurs in materials subjected to severe deformation above certain temperatures. In the RASP process, shots with a large kinetic energy hit the surface of the sample sheets. In addition to the very high plastic strain, an obvious temperature rise is also expected. The estimated transient temperature within shear bands in Cu during plastic deformation at ambient temperature is about 500 K, and such a high thermal pulse might induce grain coarsening or dynamic recovery/recrystallization in pure Cu. Reference Mishra, Kad, Gregori and Meyers42 For high-strain-rate cryogenic deformed Cu, nano-grains were found in adiabatic shear band, which was attributed to DRX process. Reference Li, Tao and Lu43 A similar phenomenon was also reported in SMAT-processed Mg alloy, where nano-sized grains of about 30 nm were formed via the DRX mechanism. Reference Sun, Shi, Zhang and Lu44 In the present work, heat dissipation is very difficult since the strain rate of RASP is very high Reference Wang, Li, Zhang, Zhao and Zhu35 and the deformation is approximately adiabatic. In addition, inhomogeneous deformation makes the temperature distribution localized. Moreover, Al alloy has a low melting point and therefore a low recrystallization temperature. All of these factors favor DRX in the top surface of the RASP-processed 5052 Al alloy. As an evidence, Fig. 5 shows a “clean” nanometer grain (white arrow) formed in a highly deformed subgrain with high density of dislocation arrays. This “clean” nanometer grain implies that it is strain free even though there is high strain in the surrounding area. The only possible way to generate such clean nanoscale grains within a highly deformed area is DRX.
A strain-free nanometer grain formed in a heavily deformed area.

The effect of solute elements such as Mg on the grain refinement of 5052 Al alloy cannot be neglected. A minimum grain size of 150 nm in pure Al and 20–50 nm in the A356 Al–Si alloy processed by SMAT were observed because Si particles can stabilize fine grains. Reference Chang, Kelly, Shi and Zhang45 The average subgrain size in HPT Al–Mg alloys decreased considerably from 120 to 55 nm as the Mg content increased from 0.5 to 4.1 wt%, which was primarily attributed to the stabilization effect of Mg solute on fine grains. Reference Liu, Roven, Liu, Murashkin, Valiev, Ungar and Balogh12 Mg in 5052 Al alloy may play the same role and contribute to the nano-grain formation in the surface of the sample, and this is beyond the scope of this work and will be further investigated.
C. Mechanical properties
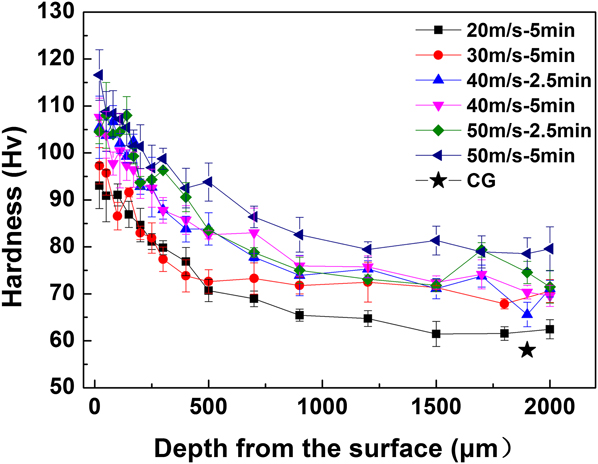
Figure 6 shows the variation of microhardness along the depth from the treated surface in the RASP 5052 Al alloy samples with different RASP processing conditions and the depth in 2000 μm corresponding to the “center” location, as shown in Fig. 1(b). Three features can be clearly seen from the figure: Firstly, microhardness gradient was observed for all of the RASP-processed samples. In the top surface layer, hardness in the 50 m/s-5 min RASP-processed samples reached a value as high as 116 HV, which is about twice that of its CG counterpart. In all RASP-processed samples, the microhardness decreases with increasing depth from the surface. Secondly, microhardness becomes higher with increasing RASP duration and/or ball velocity. For instance, the microhardness in the 50 m/s-5 min RASP-processed sample shows the highest hardness almost in the whole hardness curve. This means that increasing RASP duration and ball velocity can amplify the strain hardening effect. However, small cracks were occasionally found in the 50 m/s-5 min RASP-processed samples. Hence, no RASP processing was performed using ball velocity higher than 50 m/s. Thirdly, all of the RASP-processed samples show an obvious microhardness improvement even in the center over that of the CG sample, indicating that RASP deformation penetrated the whole thickness of Al alloy samples, which is consistent with OM observation shown in Fig. 1(b).
Variation of microhardness distribution in RASP 5052 Al alloys as a function of depth from the surface.

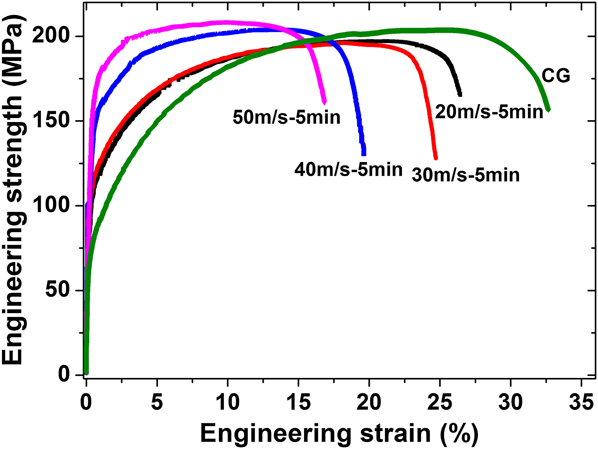
Figure 7 shows the tensile engineering strength–strain curves of the RASP-processed 5052 Al alloy samples with deformation conditions at 20 m/s-5 min, 30 m/s-5 min, 40 m/s-5 min, and 50 m/s-5 min. Enhanced yield strength (YS) was found in each deformed sample. Both YS and ultimate tensile strength of the 50 m/s-5 min deformed samples are higher than those deformed at 20 m/s-5 min, 30 m/s-5 min, and 40 m/s-5 min, consistent with the microhardness measurements shown in Fig. 6. Meanwhile, these deformed samples with gradient structures show a good ductility; therefore, a good strength–ductility combination is realized. For instance, the YS of 50 m/s-5 min RASP-processed 5052 Al alloy is 168 MPa, which is more than twice that of CG samples (70 MPa), while the uniform elongation keeps a decent 12.6%.
Typical tensile engineering strength–strain curves of the RASP-processed 5052 Al alloy samples with different deformation conditions as indicated, in comparison with those of the CG samples.

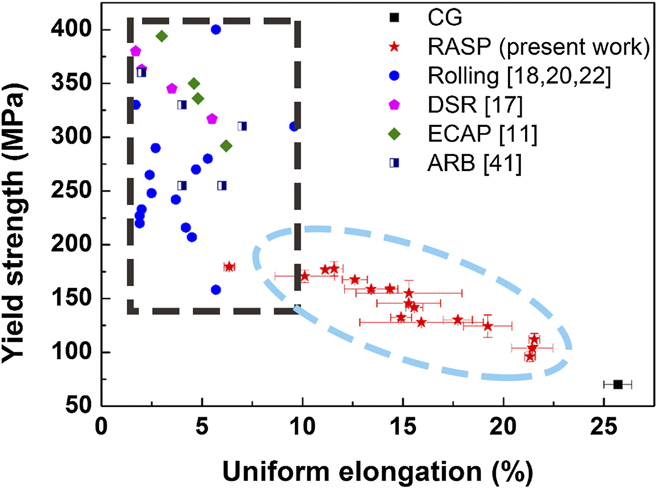
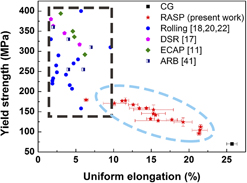
A set of tensile property data of 5052 Al alloys processed by rolling, ECAP, ARB, and differential speed rolling (DSR) were extracted from literature, Reference Tsai, Sun, Kao and Chang11,Reference Ko17,Reference Gang, Lee and Jono18,Reference Wang, Chen, Pan, Mao and Fang20,Reference Shi, Hou, Ma, Zuo, Cui, Zhuang and Zhang22,Reference Song, Kim and Nam41 and the YS–uniform elongation (εu) data were plotted in Fig. 8. The mechanical property data of the RASP-processed 5052 Al alloy in the present work were also plotted in the figure. It can be seen that the YS and εu of rolling, DSR, ECAP, and ARB samples are mainly distributed in the high strength–low ductility (<10%) region (dark rectangle area): that is, the YSs of the samples induced by these methods were improved at the expense of significant ductility reduction. On the contrary, mechanical properties of RASP-processed 5052 Al alloy is mainly distributed in the middle strength–high ductility region (blue ellipse area), which means that the YSs of the RASP-processed 5052 Al alloy samples were 1.4–2.6 times than those of CG counterparts, while retaining a decent ductility (25–84% that of CG counterparts). Good strength–ductility synergy have been found in gradient structured Cu, which was attributed to the strain hardening in deformed CG and grain-boundary migration-induced softening in nano-grains in the gradient structure. Reference Fang, Li, Tao and Lu27 A good combination of strength and ductility was found in gradient structured interstitial-free (IF) steel, and its good mechanical properties came from extraordinary strain hardening introduced by back-stress strengthening and back-stress work hardening due to incompatible deformation along the gradient depth. Reference Wu, Jiang, Chen, Yuan and Zhu28,Reference Wu, Jiang, Chen and Zhu30 It was also found recently that the gradient structured IF steel has very high back-stress strengthening and back-stress work hardening to improve the strength and ductility. Reference Yang, Pan, Yuan, Zhu and Wu46 It is likely that the back stress also played a major role in producing the superior mechanical properties in the gradient 5052 Al alloy.
A plot of YS versus uniform elongation for 5052 Al alloy samples; data were extracted from the tensile curves in literature and the RASP processed samples in the present work.

IV. CONCLUSIONS
Microstructural evolution of a 5052 Al alloy induced by RASP was investigated systematically. The effect of RASP treatment on the mechanical properties of the 5052 Al alloy sample is also studied. Major conclusions are as follows:
-
(1) A deformation layer of ∼2 mm was formed by RASP treatment, indicating the effectiveness and high energy of RASP processing in introducing plastic deformation.
-
(2) Different dislocation configurations, elongated subgrains, equiaxed subgrains, and nano-sized grains were found along the depth from the sample surface. DRX was primarily responsible for the nano-grain formation.
-
(3) Microhardness gradient was observed along depth from the surface. The microhardness increased with increasing RASP treatment duration and ball velocity. The microhardness in the top surface of 50 m/s-5 min RASP-processed sample is twice that of its CG counterpart. The YSs of the RASP-processed 5052 Al alloy samples were 1.4–2.6 times than those of CG counterparts, while retaining a decent ductility (25–84% that of CG counterparts). The good combination of strength and ductility is expected to help with the application of the 5052 Al alloy as a structural material.
ACKNOWLEDGMENTS
Financial supports from the National Key R&D Program of China (Grant No. 2017YFA0204403), National Natural Science Foundation of China (Grant Nos. 51301092, 51501092, and 51601094), Nanjing University of Science and Technology (Grant No. AE89991), Pangu Foundation, and the Jiangsu Key Laboratory of Advanced Micro&Nano Materials and Technology are acknowledged.