I. INTRODUCTION
Nickel-based superalloys have been widely used in the aeronautical, chemical, nuclear, petrochemical, and marine applications due to their excellent mechanical, physical, and anticorrosion properties. Reference Zhang, Zhang, Lu, Zhao and Yang1,Reference Zhang, Zhu, Hu, Wang, Chen and Qin2 However, the microstructure evolution of these alloys is very complex during hot deformation, and control of microstructure is of great importance for optimizing the final properties of products. Reference Zhang, Hu, Ding, Zhu and Qin3 In these alloys, the occurrence of dynamic recrystallization (DRX) during hot deformation can play a significant role in grain refinement, which is beneficial for the properties of the alloys. Reference Wang, Brünger and Gottstein4 Refined grain structures induced by DRX can be obtained through hot working, and the DRX process is significantly affected by the deformation temperatures. Reference Zhang, Zhang, Zhou, Lu, Zhao and Yang5 New grains are formed accompanied with the formation of abundant annealing twins, resulting in highly-twinned grain structure. On the other hand, it has been reported that the evolution of twinning can also play an important role during the DRX process in materials with low stacking fault energy, which is closely related to the deforming temperatures. Reference Randle and Brown6,Reference Gottstein and Kocks7 An understanding of the effect of deformation temperature on the microstructure evolution is of significance to realize the microstructure control for nickel-based superalloys.
It is well known that the grain boundaries have an important effect on the properties of polycrystalline materials. Reference Tan and Allen8 In particular, the special boundaries can significantly affect the alloy properties, such as the resistance to creep, corrosion, and cracking. Improved resistance to these attacks has been reported in the nickel-based superalloys with high fractions of special boundaries. Reference Lehockey, Brennenstuhl and Thompson9–Reference Lin, Palumbo, Erb and Aust11 Twin boundaries are a kind of special boundaries, which can be easily formed in the nickel-based superalloys during hot deformation. Reference Randle12 On the other hand, the ‘coincidence site lattice’ (CSL) model has been widely used to characterize grain boundaries, which is based on the superlattice consisting of coincidence sites, i.e., lattice sites corresponding to mutually misoriented and interpenetrating lattices of adjacent crystals. Reference Randle13 Moreover, the CSL boundaries are characterized by the specific misorientation values, and the reciprocal density of coinciding sites is defined as Σ. Formation of twins accompanies the CSL boundaries, such as primary twins (Σ3) and higher order twins (Σ9, Σ27). Meanwhile, the Σ3 twin boundaries can be classified as coherent and incoherent Σ3 boundaries, the properties of which are markedly different (e.g., coherent twins are immobile, incoherent twins are very mobile). It is important to differentiate between coherent and incoherent Σ3 boundaries, due to the fact that the coherent ones, lying in dense planes, have much lower energy. Reference Randle14 Moreover, it should be mentioned that Σ3 boundary is considered as an important contributor to improve material properties due to its potentials for structural order in the boundary plane. Reference Brandon15 At present, some studies have been carried out on twin evolution during hot deformation for different alloys. Sun et al. Reference Sun, Zhou, Man and Xiao16 studied the effect of deformation parameters on Σ3 n grain boundaries of a new stainless steel. The results revealed that the Σ3 n grain boundaries first increased and then reduced with the increasing strain and strain rates. Cao et al. Reference Cao, Di, Misra, Yi, Zhang and Ma17 reported that the most dominant CSL boundary is the Σ3 twin boundary in AISI 420 stainless steel, and the fraction of Σ3 boundaries remains constant after the DRX process. Song et al. Reference Song, Chun and Hwang18 proposed that the repetitive thermomechanical processing was an effective method for increasing the fraction of Σ3 boundaries in a Pb-base alloy.
In recent years, the electron backscattered diffraction (EBSD) technique has been widely used to study the microstructure evolution of nickel-based superalloys by more and more researchers. Wang et al. Reference Wang, Shao, Zhen and Zhang19 investigated the role of continuous DRX at the higher and lower temperatures for superalloy 718 by using EBSD technique. Cao et al. Reference Cao, Di, Zhang, Zhang, Ma and Misra20 studied the nucleation mechanism of DRX and the role of Σ3 n boundaries during the DRX process in Alloy 800H by using EBSD technique. Stefan Mitsche et al. Reference Mitsche, Sommitsch, Huber, Stockinger and Poelt21 evaluated the effect of the different deforming parameters on the dynamic softening processes of nickel-based superalloy Allvac® 718Plus™. Tan et al. Reference Tan, Sridharan and Allen22 studied the effect of thermomechanical processing on grain boundary character distribution of a nickel-based superalloy. In addition, further studies are still needed on the microstructure evolution of nickel-based superalloys by using EBSD technique.
In this paper, the EBSD technique was used to evaluate the effect of deformation temperature on microstructure evolution of a typical nickel-based superalloy during hot deformation. The alloy is a kind of nickel-based superalloy with low stacking fault energy, which has been widely used in gas turbines and combustion systems due to its excellent strength at high temperature. It should be mentioned that the highest service temperature of the alloy can reach about 1000 °C. Reference Zhang, Zhang, Zhou, Lu, Zhao and Yang5 In the alloy, γ′ phase (Ni3AlTi) is the main strengthening phase, and the most fraction of γ′ phase can reach about 20 wt%. The grain orientation spread (GOS) method was used to study the DRX progress of the studied alloy under various deformation temperatures. In particular, an analysis of twin boundaries evolution and twin density was carried out for the alloy.
II. EXPERIMENTAL PROCEDURES
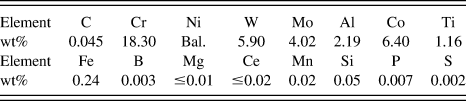
The chemical composition (wt%) of the alloy used in this investigation is listed in Table I. Cylindrical specimens of 8 mm diameter and 12 mm height were machined from an as-received forging bar. Before compression tests, the specimens were solution-treated at 1100 °C for 30 min, and then air-cooled to room temperature. A Gleeble-1500D thermomechanical simulator (DSI Company, Poestenkill, New York) was used for compression testing and temperature was controlled by the thermocouple fixed on the test specimen's surface. The isothermal compression tests were carried out in the temperature range of 960–1160 °C. It should be noted that the high strain rate can lead to adiabatic temperature rise during hot deformation. Reference Cao, Di, Zhang, Zhang, Ma and Misra20 In the authors' previous publication, Reference Zhang, Zhang, Zhou, Lu, Zhao and Yang5 it had been reported that the adiabatic temperature rise had a great effect on the microstructure evolution of the studied alloy at high strain rates. To avoid the effect of adiabatic temperature rise on the experimental results, the strain rate was selected to be 0.001 s−1 in our research. Before loading, all the solution-treated specimens were heated to the experimental temperatures at 10 °C/s, and held for 3 min to eliminate the temperature gradient in specimens. The experimental temperatures were controlled to ±2 °C. During isothermal compression, the specimens were compressed to a true strain of 0.7, and the load–stroke curves were converted into the true stress–true strain curves using standard equations. After compression tests, the specimens were quenched to room temperature by water with minimum delay. And then, the specimens were cut along the compression axis for microstructure observation. The foils for transmission electron microscope (TEM) examination were prepared by hand grinding to a thickness of 70 µm. After that, the foils were thinned by the method of twin-jet electropolishing with a solution of 10% perchloric acid in ethanol. TEM examination was conducted with Tecnai G2 F30 microscope operated at 300 kV (FEI Company, Hillsboro, Oregon). The EBSD measurements were carried out by using Tex Sem Laboratorie (TSL) system attached to a Quanta 200FEG scanning electron microscope (FEI Company). The samples for EBSD investigation were electropolished with a solution of 10% perchloric acid in ethanol at 20–30 V for 30 s at room temperature. EBSD maps were obtained with a step size of 0.25–1 µm depending on the grain size, and they were analyzed by using OIM™ 5 software. Based on CSL model, twins can be characterized by Σ3 n (n = 1, 2, 3) boundaries, which can be precisely recognized by OIM™ 5 software. Moreover, the Brandon criterion has been widely used to classify CSL boundaries, Reference Yamaura, Igarashi, Tsurekawa and Watanabe23 and it can be expressed as:
 $${v_{\rm{m}}} = {v_0}{\sum \nolimits ^{ - {1 \mathord{\left/ {\vphantom {1 2}} \right. \kern-\nulldelimiterspace} 2}}}\quad ,$$
where v m is the maximum angular deviation and the value of v 0 is 15°.
The chemical composition of the alloy (wt%).

III. RESULTS AND DISCUSSION
A. Initial microstructure
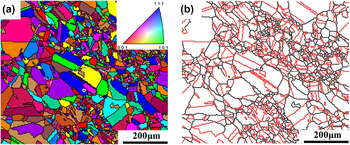
The initial microstructure of the alloy is shown in Fig. 1. Figure 1(a) shows the unique grain color map, in which the high angle boundaries (HAGBs) with misorientation angles higher than 15° are represented by black lines and the low angle boundaries (LAGBs) with misorientation angles lower than 10° are represented by gray lines. Furthermore, the grain boundaries with misorientation angles between 10° and 15° are represented by white lines, which are defined as the medium angle boundaries (MAGBs) here. As shown in Fig. 1(a), it can be found that the initial microstructure consists of many large grains with some small grains, indicating an inhomogeneous microstructure. In addition, some twins can be seen in Fig. 1(a). Figure 1(b) shows the OIM map, in which the HAGBs and Σ3 boundaries are represented by black and red lines. It can be found that there are many Σ3 boundaries in the initial microstructure of the alloy, the fraction of which is about 42.9%.
The initial microstructure of the alloy: (a) unique grain color map, (b) OIM map.

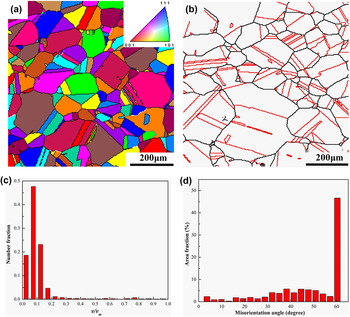
Figure 2 shows the microstructure of the alloy after solution treatment. As shown in Fig. 2(a), the microstructure of the alloy after solution treatment is composed of equiaxed grains and a few annealing twins. From Fig. 2(b), it can be found that there are also many Σ3 boundaries in the alloy after solution treatment, and the fraction of Σ3 boundaries is about 51.2%, which is higher than that of the initial microstructure. Such phenomenon is mainly caused by the formation of Σ3 boundaries during grain growth. Reference Fullman and Fisher24 In addition, it is well known that Σ3 boundaries include coherent Σ3 and incoherent Σ3 boundaries, Reference Mandal, Bhaduri and Sarma25 which have the different interfacial plane and properties. Reference Randle26 Coherent Σ3 boundary is featured by the morphology of straight line, the interface energy of which is very low due to its perfect arrangement of grain boundary atoms. Therefore, most of Σ3 boundaries are coherent Σ3 boundaries, due to the fact that the morphology of them is straight and parallel.
The microstructure of the alloy after solution treatment: (a) unique grain color map, (b) OIM map, (c) relative deviation distribution of Σ3 boundaries and (d) misorientation angle distribution.

It has been widely accepted that measurement of the relative deviation (v/v m) can provide an estimate of the plane type and the energy of boundary, especially for Σ3 boundary. Reference Randle and Davies27 In other words, the type of Σ3 boundary can be distinguished by the value of v/v m, in which v is the deviation from the ideal twin orientation. It should be noted that the relative deviation of coherent Σ3 boundary is less than 0.2, and that of incoherent Σ3 boundary is higher. Reference Mandal, Bhaduri and Sarma25 Figure 2(c) shows the relative deviation distribution of Σ3 boundaries. It can be found that most of v/v m is less than 0.2, indicating that majority of the Σ3 boundaries are coherent Σ3 boundaries. Moreover, Fig. 2(d) shows the misorientation angle distribution. It can be found that most of the misorientation angle is larger than 15°, indicating that most of the grain boundaries are HAGBs. In other words, the fraction of LAGBs is relatively low in the alloy after solution treatment.
B. Flow behavior
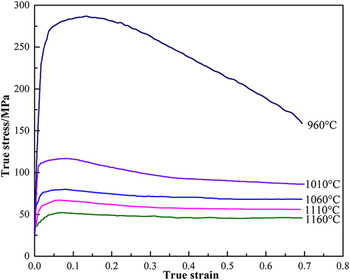
Figure 3 shows the true stress–strain curves of the alloy compressed to a 0.7 true strain at 0.001 s−1 with the temperatures ranging from 960 °C to 1160 °C. It can be found that these curves exhibit an obvious work hardening stage at the strain less than 0.2, followed by a flow softening stage and then sometimes a steady stage at high strain. Such flow behaviors have been reported in many nickel-based superalloys with low stacking fault energy, indicating the occurrence of DRX during hot deformation. Reference Doherty, Hughes, Humphreys, Jonas, Jensen, Kassner, King, McNelley, McQueen and Rollett28,Reference Guo, Li, Guo, Peng and Hu29 The initial increase of flow stress is related to the increase of dislocation density and the formation of poorly developed subgrain boundaries. Reference Guo, Li, Guo, Peng and Hu29 With the increase of strain, the effect of work hardening can be partially neutralized by dynamic softening, resulting in the decrease of flow stress. As the work hardening and dynamic softening reach a dynamic equilibrium, the flow stress reaches a steady stage. Moreover, it can be found that the peak stress decreases with the increasing deformation temperature, which is consistent with the results reported in other nickel-based superalloys. Reference Wang, Shao, Zhen and Zhang19,Reference Rollett, Humphreys, Rohrer and Hatherly30 Such phenomenon is caused by the higher mobility of dislocation, vacancy, and grain boundaries at the higher deformation temperature. Reference Chen, Lin, Wen, Zhang and He31
True stress–true strain curves of the alloy deformed at different temperatures with the strain rate of 0.001 s−1.

C. Effect of deformation temperature on the microstructure evolution
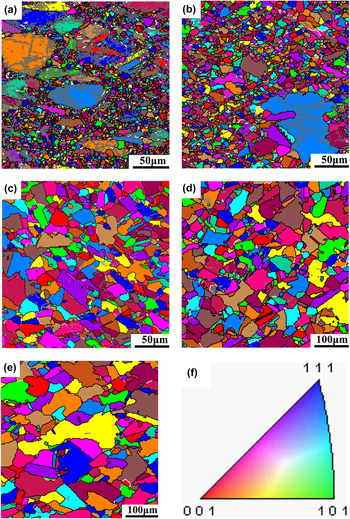
Figure 4 shows the unique grain color maps of the alloy deformed at 0.001 s−1 with different temperatures, in which the HAGBs are represented by black lines and the LAGBs are represented by gray lines. Furthermore, the MAGBs are represented by white lines. From Fig. 4, it can be found that the microstructure evolution depended closely on the deformation temperature, and the prior microstructures had been replaced partially or completely by the DRX grains. In other words, the deformation temperature had an important effect on the DRX grain size and volume fraction of DRX grains. At 960 °C, the microstructure consisted of the original large grains, some elongated grains, and a lot of small DRX grains, indicating the occurrence of partial DRX, as shown in Fig. 4(a). With the increase of temperature, the initial large grains gradually disappeared and more DRX grains were formed, as shown in Figs. 4(b) and 4(c). As the temperature was above 1110 °C, a nearly full DRX microstructure was obtained, and the coarsening of DRX grains became more and more obvious, as shown in Figs. 4(d) and 4(e).
Unique grain color maps of the alloy deformed at 0.001 s−1 with different temperatures: (a) 960 °C, (b) 1010 °C, (c) 1060 °C, (d) 1110 °C, (e) 1160 °C and (f) color coding map.

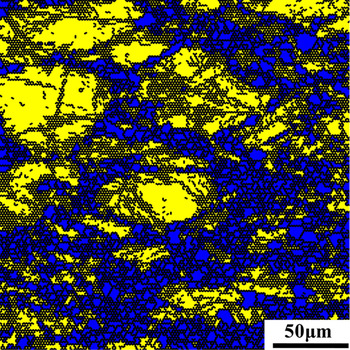
To further study the effect of deformation temperature on DRX evolution, the DRX grains have to be distinguished precisely from the deformed grains. It has been reported that the GOS value is an effective method to recognize DRX grains. Reference Field, Bradford, Nowell and Lillo32 GOS is the average difference in orientation between the average grain orientation and all measurements within a single grain. Moreover, the GOS value of the DRX grains is lower than that of deformed grains. In the authors' previous publication, Reference Zhang, Zhang, Zhou, Lu, Zhao and Yang5 it has been reported that a GOS ‘cut off’ of 2° is a suitable criterion to partition DRX grains from deformed matrix for the studied alloy. Based on the criterion, the grains with GOS value less than 2° are considered as DRX grains. Figure 5 shows the microstructure of the alloy deformed at 960 °C with the strain rate of 0.001 s−1, where the DRX grains are featured by blue color. It can be found that the DRX grains have been separated successfully from the deformed grains, and the volume fraction of DRX grains is about 45%.
Microstructure of the alloy deformed at 960 °C with the strain rate of 0.001 s–1.

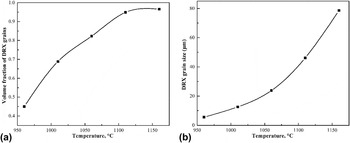
On basis of the GOS approach, the volume fractions of DRX grains at different deformation temperatures were evaluated and shown in Fig. 6(a). Obviously, it can be found that the volume fraction of DRX grains increased with the increasing deformation temperature, indicating that the DRX process was accelerated at the higher deformation temperature. Such phenomenon was mainly caused by the lower driving force and higher mobility of grain boundaries at the higher deformation temperature. Reference Imbert and McQueen33 On the other hand, Fig. 6(b) shows the variation of DRX grain size with deformation temperature, which can be obtained accurately by using the software of TSL OIM analysis. It also can be found that the DRX grain size increased with the increasing deformation temperature, which was due to the higher mobility of grain boundaries at the higher deformation temperature. Reference Li, Guo, Guo, Peng and Wu34 When the temperature rose to 1160 °C, the mean size of DRX grains reached about 79.6 µm.
Volume fractions of DRX grains at different temperatures (a) and DRX grain size at different temperatures (b).

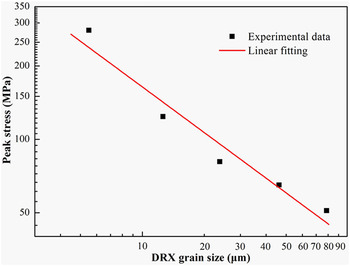
It has been widely accepted that a flow softening stage following by a peak stress is mainly caused by DRX, and the DRX grain size (D R) increases monotonically with the decreasing stress. Meanwhile, there must be a dynamic balance between the nucleation of DRX grains and the migration of the boundaries of the previously nucleated grains for a steady state to occur. Reference Humphreys and Hatherly35 In other words, the flow stress is highly dependent on the DRX process. Experimental observations generally show that the DRX grain size is a strong function of the peak stress. Reference Guo, Li, Guo, Peng and Hu29 Figure 7 shows the relationship between the peak stress (σp) and the DRX grain size. Obviously, there exists a power exponent relationship between σp and D R for the alloy, which agrees well with the empirical relationship expressed by the following equation Reference Rollett, Humphreys, Rohrer and Hatherly30 :
 $${{\rm{\sigma }}_{\rm{p}}} = K{\left( {{D_{\rm{R}}}} \right)^{ - m}}\quad ,$$
where m < 1 and K is an experimental constant. The values of grain size exponent (m) and K were calculated to be 0.6 and 630.9 in Fig. 7. The grain size exponent of −0.6 is similar with that of Inconel 625 superalloy, which was −0.53. Reference Guo, Li, Guo, Peng and Hu29 It has been reported that the value of grain size exponent can reflect the variation of the DRX nucleation mechanism. Reference Wusatowska-Sarnek, Miura and Sakai36 Furthermore, it is significant to predict the DRX grain size and deformation resistance precisely by using the relationships between flow stress and DRX grain size.
Relationship between peak stress and DRX grain size evolved at different deformation temperatures with a strain rate of 0.001 s–1.

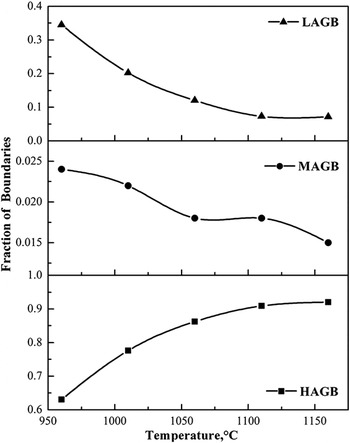
Figure 8 shows the fractions of grain boundaries with different misorientation angles at different deformation temperatures, which were calculated from the EBSD results. It can be found that the fraction of LAGBs decreased with the increasing deformation temperature, while the fraction of HAGBs exhibited the opposite tendency. Such phenomenon was mainly due to the transformation from LAGBs to HAGBs at the higher deformation temperature. Reference Zhang, Zhang, Jiang, Zhou, Zhao and Yang37 In addition, it should be noted that MAGBs are considered as the transition zone from LAGBs to HAGBs, which can contribute to the DRX nucleation mechanism through progressive subgrain rotation. Reference Rollett, Humphreys, Rohrer and Hatherly30 However, the fraction of MAGBs is less than 3% for the alloy deformed at different temperatures, indicating the weak effect of progressive subgrain rotation during hot deformation.
The fractions of grain boundaries with different misorientation angles at different deformation temperatures.

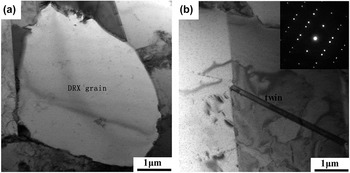
Figure 9 shows the TEM images of the alloy deformed at 1010 °C and 1110 °C with the strain rate of 0.001 s−1. As shown in Fig. 9(a) and 9(b) a newly formed DRX grain can be clearly observed, and it is almost free of dislocations. It can be confirmed that the occurrence of DRX rapidly eliminates the dislocations, which is consistent with the previous research. Reference Zong, Shan, Lü and Guo38 In addition, the twins can be clearly observed in Fig. 9(b). It is well known that twins can play an important role in nucleation process during DRX in materials with low stacking fault energy. Reference Gottstein and Kocks7,Reference Sample, Fitzsimons and DeArdo39 The nucleation of twins was mainly caused by the high grain boundary mobility, which occurred through the dissociation of an initial migrating grain boundary into an immobile coherent twin part, mobile incoherent twin segment and a LAGB. Reference Mahajan, Pande, Imam and Rath40 Furthermore, the twins can accelerate the bulging and separation of bulged parts from the original grains. Reference Wang, Shao, Zhen, Yang and Zhang41 To investigate the effect of deformation temperature on the evolution of twin boundaries, the EBSD technique was used to identify twin boundaries in the alloy.
TEM images of the alloy deformed at (a) 1010 °C/0.001 s−1 and (b) 1110 °C/0.001 s−1.

D. Effect of deformation temperature on the evolution of Σ3 boundaries
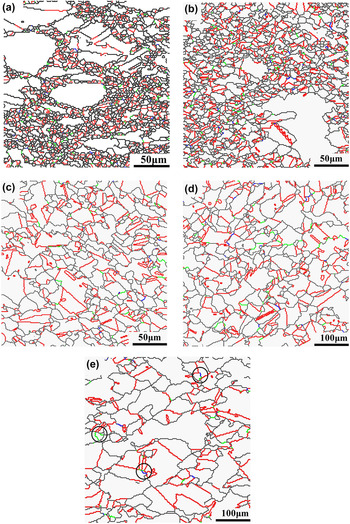
Figure 10 shows the OIM maps of the alloy deformed to a 0.7 true strain at different temperatures with a strain rate of 0.001 s−1, in which Σ3, Σ9, and Σ27 boundaries are represented by red, green, and blue lines, respectively. Obviously, it can be seen that the deformation temperature has a significant effect on the evolution of Σ3 boundaries. As shown in Figs. 10(a) and 10(b), the Σ3 boundaries are rarely seen in the deformed grains, indicating that most of the original Σ3 boundaries lost their twin characteristics and transformed into considerable mobile boundaries during hot deformation. Reference Mahajan, Pande, Imam and Rath40 Such phenomenon was mainly caused by the crystal rotations during hot deformation, which could rotate the orientation of twins. Reference Zhang, Zhang, Jiang, Zhou, Zhao and Yang37 On the other hand, there are profuse Σ3 boundaries in the DRX grains, which were newly formed during the DRX process. It is well known that the formation of Σ3 boundaries is a result of stacking error at the migrating grain boundaries, Reference Li, Zhang, Sun, Sun and Shan42 and there are two ways for the generation of Σ3 boundaries. The first one is the growth accidents during the DRX process, and the other one is the interactions between Σ3 n boundaries through the migration of grain boundary. Reference Mandal, Bhaduri and Sarma43 The interactions are governed by the following rules Reference Randle14 :
 $$\sum A + \sum B \to \sum \left( {A \times B} \right),\quad \sum A + \sum B \to \sum \left( {{A \mathord{\left/ {\vphantom {A B}} \right. \kern-\nulldelimiterspace} B}} \right)\quad .$$
OIM maps of the alloy deformed to a 0.7 true strain at different temperatures with a strain rate of 0.001 s–1: (a) 960 °C, (b) 1010 °C, (c) 1060 °C, (d) 1110 °C and (e) 1160 °C.

According to the CSL rule, interaction between a Σ9 boundary and a Σ3 boundary can result in the formation of a new Σ3 boundary or a new Σ27 boundary. As a Σ27 boundary encounters a Σ9 boundary, a new Σ3 boundary may be generated.
With the increase of temperature, the distribution of Σ3 n boundaries becomes more and more uniform due to the higher volume fraction of DRX grains, as shown in Figs. 10(c)–10(e). Moreover, it can be seen that almost all Σ9 and Σ27 boundaries are connected with Σ3 boundaries. As shown in Fig. 10(e), the interactions between Σ3 n boundaries can be clearly observed in the regions marked by circles. In addition, the fraction of Σ3 boundary seems to be much larger than that of Σ9 and Σ27 boundaries. Such phenomenon is due to that the interfacial energy of Σ9 and Σ27 boundaries is greater than that of Σ3 boundary. Reference Olmsted, Foiles and Holm44 Hence, the transformation from Σ9 and Σ27 boundaries to Σ3 boundary is energetically favorable.
1. Effect of deformation temperature on the fraction of Σ3 boundaries
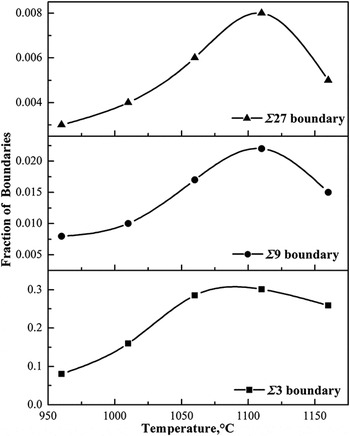
At present, there are two main methods to quantitatively characterize twin amount, i.e., twin fraction and twin density. Figure 11 shows the variations of Σ3 n (n = 1, 2, 3) boundary fractions with deformation temperature. Obviously, it can be found that the variations of Σ9 and Σ27 boundaries are similar with that of Σ3 boundary, which was caused by the interactions between Σ3 n boundaries, as mentioned above. However, comparing with the fraction of Σ3 boundary, the fractions of Σ9 and Σ27 boundaries are below 0.025%, indicating that the interactions between Σ3 n boundaries did not happen frequently. Hence, due to the insignificant fractions of Σ9 and Σ27 boundaries, it can be inferred that the formation of Σ3 boundaries was mainly through growth accidents during the DRX process.
Variations of Σ3 n (n = 1, 2, 3) boundary fractions with deformation temperature.

From Fig. 11, it also can be found that, when the temperature was lower than 1110 °C, the fraction of Σ3 boundary increased with the increasing temperature. This was mainly caused by the higher grain boundary mobility at the higher temperature. Reference Zhang, Zhang, Jiang, Zhou, Zhao and Yang37 The faster migration velocity of grain boundary can promote growth accidents during the DRX process, leading to the larger fraction of Σ3 boundaries. However, the fraction of Σ3 boundary decreased again as the deformation temperature increased to 1160 °C. There are three possible reasons for such phenomenon. Firstly, both twinning and grain growth can reduce the total interfacial energy of the system. However, the fast grain growth can drastically reduce the interfacial energy by decreasing the total grain boundary area. Reference Horton, Thomson and Randle45 In other words, twinning is a less energetically favorable mechanism at the faster migration rate of grain boundary. As shown in Fig. 4(e), the most obvious grain growth can be clearly observed in the alloy deformed at 1160 °C, which is the least favorable for the occurrence of twinning. The second reason is that the lower velocity grain boundaries can also be consumed by the higher velocity grain boundaries during grain growth, leading to a decrease in the fraction of Σ3 boundary. Reference Sutton and Balluffi46 The third reason is that, the small DRX grains containing several Σ3 boundaries were consumed by large DRX grains during grain growth at the higher deformation temperature, which grew without producing new Σ3 boundaries. Such microstructure evolution is energetically favorable.
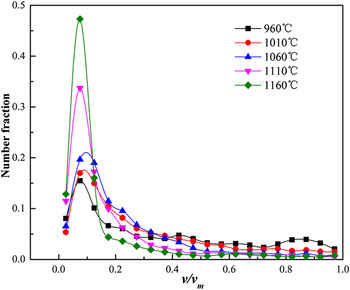
Figure 12 shows v/v m distribution of Σ3 boundary for the alloy deformed at different temperatures. It can be found that there is a peak in the region with v/v m less than 0.2 for all the specimens, and the intensities of these peaks increase with the increasing deformation temperature. Such phenomenon indicated that the fraction of coherent Σ3 boundary increased with the increasing deformation temperature. It has been reported that the grain boundary fraction and energy have an inverse correlation i.e., lower energy boundary has higher fraction. Reference Rohrer47 Meanwhile, the coherent Σ3 boundary has low mobility and ideal structures, which is virtually immune to intergranular attack. Reference Randle and Davies27 Consequently, coherent Σ3 boundary was easier to form at the higher deformation temperature during hot deformation, due to its lower boundary energy and stable structure. In other words, even if the amount of incoherent Σ3 boundary increased as well, the fraction of incoherent Σ3 boundary was reduced. On the other hand, the free energy of the boundary correlates with v/v m, an increase of which implies a higher density of dislocations. Reference Wolf and Jaszczak48 From Fig. 12, it also can be found that the average values of v/v m increased with the decreasing deformation temperature, indicating a higher dislocation density at the lower temperature.
v/v m distribution of Σ3 boundary for the alloy deformed at different temperatures.

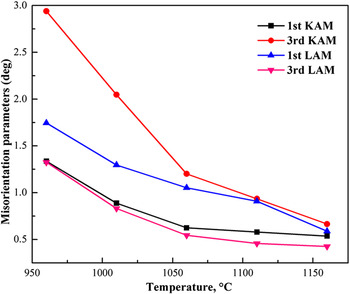
Kernel average misorientation (KAM) and local average misorientation (LAM) can also give an evidence of the dislocation density in the deformed microstructure of the alloy. The higher KAM and LAM values indicate the higher dislocation density. Reference Mandal, Jayalakshmi, Bhaduri and Sarma49 It should be noticed that the KAM and LAM values (KAM is the misorientation between a grain at the center of the kernel and all points at the perimeter of the kernel, and LAM is the average misorientations between all neighboring points within the kernel area) can be obtained accurately by using the software of TSL OIM analysis, which is a part of TSL system. Figure 13 shows the KAM and LAM values of the alloy deformed at different deformation temperatures, which were measured on the basis of the first and third nearest neighbor with a maximum misorientation angle of 5°. It can be seen that the KAM and LAM values decreased with the increasing deformation temperature, indicating that the dislocation density was higher in the alloy deformed at the lower deformation temperature. Moreover, it is well known that the incoherent Σ3 boundary shifts from the ideal structures by dislocation accumulation during hot deformation. Reference Randle14 Due to the lower dislocation density at the higher deformation temperature, the formation of incoherent Σ3 boundary was inhibited. Furthermore, the length of incoherent Σ3 boundary was easier to reduce because of their faster mobility comparing to the coherent Σ3 boundary.
KAM and LAM values of the alloy deformed at different deformation temperatures.

2. Effect of deformation temperature on the Σ3 boundary density
As mentioned above, most of the Σ3 boundary existed in the DRX domain. To study the twinning during DRX process, the twin density (ρ) in the DRX domain was calculated. Twin density is defined as the number of twin boundary intercepts per unit length, and it can be calculated using the following equation, Reference Jin, Bernacki, Rohrer, Rollett, Lin and Bozzolo50
 $${\rm{\rho }} = {{{L_{{\rm{tb}}}}} \over S}{2 \over {\rm{\pi }}}\quad ,$$
where L tb is the twin boundary length in all the DRX grains and S is the entire DRX area. Moreover, it should be noticed that all Σ3 boundaries are included whether they are coherent or incoherent Σ3 boundaries.
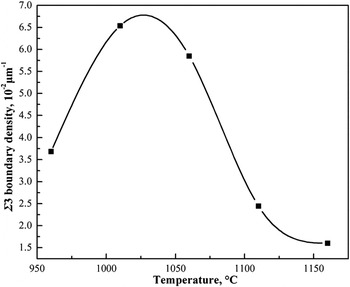
Σ3 boundary density of the alloy deformed at different deformation temperatures is shown in Fig. 14. It can be found that the Σ3 boundary density increased with the deformation temperature firstly. Such phenomenon was mainly caused by the generation of new annealing twins in the newly formed DRX grains. However, it can be found that the twin density decreased again when the deformation temperature was above 1060 °C. Horton et al. Reference Horton, Thomson and Randle45 also reported a lower twin density in pure nickel at the higher temperature. The decreasing Σ3 boundary density was closely related to the decreasing fraction of Σ3 boundary at the higher deformation temperature, the reason of which had been mentioned as above. However, the Σ3 boundary density decreased again as the deformation temperature was above 1060 °C, while the fraction of Σ3 boundary decreased again as the deformation temperature was above 1110 °C. In other words, the variation of Σ3 boundary density with deformation temperature is faster than that of the Σ3 boundary fraction. Hence, there are other factors which can affect the Σ3 boundary density as well as temperatures.
Σ3 boundary density of the alloy deformed at different deformation temperatures.

It has been reported that migration velocity of grain boundary and the migration distance are considered as the two key factors for the development of Σ3 boundary at high temperature. Reference Mahajan, Pande, Imam and Rath40,Reference Pande, Imam and Rath51 Some recent studies suggest that the twin density is closely related to grain size. Reference Booth, Randle and Owen52,Reference Bozzolo, Souaï and Logé53 The general tendency is that the twin density decreases with the increase of grain size, while the trend is inverted for the small grains. The faster variation of Σ3 boundary density with deformation temperature in our study should be related to the obvious grain growth at the higher deformation temperature, as shown in Fig. 4. Pande et al. Reference Pande, Imam and Rath51 proposed an analytical model for predicting the twin density, which fits very well with a large number of experimental results reported for various metals. Pande's model is derived from the following assumption:
 $${\rm{\Delta }}N \,\propto\, {\rm{\Delta }}DF\quad ,$$
where ΔN is the increasing number of twin boundary per grain, F is the driving force of grain boundary migration, and ΔD is the increment of grain size. Since the twin density is equal to N/D, the twin density decreases when the twins number per grain (N) increases less rapidly than the grain size (D).
Assuming that the driving force only depends on the average curvature of grain boundary, the twin density was obtained as a function of the arithmetic mean of grain size:
 $$P = {1 \over D}K\gamma \,{\rm{ln}}{D \over {{D_0}}}\quad ,$$
where γ is the grain boundary energy, D 0 is the critical grain size below which no twin forms, and K is a constant. It can be used to fit the experimental data with the original version of Pande's model. By using γ = 0.994 J m−2, Reference Jin, Lin, Bernacki, Rohrer, Rollett and Bozzolo54 parameters K and D 0 could be identified mathematically by an inverse method: K = 0.40 m3 J−1 and D 0 = 2.06 µm. The value of D 0 for the studied alloy is smaller than that of pure nickel, Reference Jin, Lin, Bernacki, Rohrer, Rollett and Bozzolo54 which is 2.5 µm.
IV. CONCLUSIONS
In this work, the microstructure evolution of a typical nickel-based superalloy was studied by using EBSD technique in the temperature range of 960–1160 °C with the strain rate of 0.001 s−1. From the above study, the following results can be concluded:
-
(1) Based on the GOS method, the DRX grains were distinguished from the deformed grains. The results revealed that the volume fraction and size of DRX grains increased with the increasing deformation temperature. The relationship between the peak stress and the DRX grain size can be expressed by a power law function with an exponent value of −0.6.
-
(2) The fraction of LAGBs decreased with the increasing deformation temperature, while the fraction of HAGBs shown the opposite trend due to the transformation from LAGBs to HAGBs at the higher deformation temperature. The fraction of MAGBs was less than 3% for the alloy deformed at the different temperatures, indicating the weak effect of progressive subgrain rotation during hot deformation.
-
(3) Most of the original Σ3 boundaries lost their twin characteristics due to crystal rotations during hot deformation. Meanwhile, lots of new Σ3 boundaries were formed in DRX grains mainly by growth accidents. The fraction of Σ3 boundaries increased with the increasing deformation temperature until 1110 °C, then the fraction of Σ3 boundaries decreased again. In addition, the coherent Σ3 boundaries were easier to form at the higher deformation temperature due to lower boundary energy compared to incoherent Σ3 boundaries.
-
(4) The twin density in DRX domain increased firstly with the increasing deformation temperature until 1060 °C, then the fraction of Σ3 boundaries decreased again. Twin density as a function of grain size was analyzed, and the critical grain size below which no twin forms was calculated to be 2.06 µm.
ACKNOWLEDGMENTS
This work has been supported by A Project of Shandong Province Higher Educational Science and Technology Program (No. J12LB03), and the National Natural Science Foundation of China (No. 51505256).