
Few political events elicited the level of scholarly attention and debate that followed the 1934 congressional delegation of tariff-setting authority to the US president. Congress rarely has given up its branch prerogatives; even more rarely has government reorganization been credited with good policy. Scholars, in turn, filled pages of journals with explanations of the why and how of this delegation. Some authors focused on the role played by the association between the Great Depression, Smoot-Hawley, and the rise of the US presence in the world,Footnote 1 others on the democratic realignment that gave unchecked power to the Democrats,Footnote 2 and still others on the fact that after Smoot-Hawley, tariffs became a “hot potato” issue.Footnote 3 While the explanations for the impetus for delegation vary widely, the effect is less contested. All analysts agree that granting tariff-setting authority to the president was a requisite for the opening of the US economy. The 1934 act is said to have insulated Congress from proprotection interest groups, either by mobilizing a counterweight exporter lobby or more simply, by undermining social actors' ability to get access to the locus of decision making.Footnote 4
Given this degree of scholarly attention, it is surprising that there has been no detailed analysis of how and which products protected predelegation became subject to tariff reductions postdelegation. What data have been offered have been highly aggregated, making it difficult to differentiate among the multiple tariff lines in industry groupings. Given the level of attention international relations (IR) scholars have paid to the rise of US power in the post–World War II years, and the pride of place given to the expansion of the Executive Office of the president in that explanation, understanding how the United States opened up may be as important as the fact that the market did ultimately open up.
We address this lacunae through a detailed analysis of US tariff levels between 1928 and 1964. We examine data at the level of the tariff product, providing information on what products were reduced, when, and with whom. We focus on a subset of products, those that were highly protected, since these were both the logical focus of tariff reductions and the producer groups previously most successful in gaining tariff protection. Our analysis leads us to reconsider the conventional wisdom on the effects of delegation and the political foundations of US market liberalization.
First, we find that industries that were most protected before, and in the Smoot-Hawley tariff retained their high tariffs afterward. If we believe that delegation insulated Congress from having to heed the needs of powerful industries, we should expect, at minimum, to see tariff reductions on highly protected industries at least as deep as those on other products. We do not find this. Instead, the bulk of tariff concessions were made from industries that had relatively lower tariffs and presumably less clout in Congress. Given this finding, it does not appear that the 1934 trade act fundamentally transformed the traditional relationship between Congress and producer groups.
Second, although we find that delegation did not insulate Congress from societal pressure, it did change the politics of tariff setting, less because of congressional abdication than because of a new ability of presidents to structure congressional choice. Postdelegation, Congress remained as active in setting trade policy as predelegation, repeatedly requiring presidents to ask for a renewal of tariff-setting authority. After 1934, however, the Executive Office had agenda control, allowing presidents to finesse congressional constraints by choosing when, with whom, and what products would be subject to a trade treaty. Presidents understood that domestic interest groups incur costs for a sustained campaign to influence Congress; given the deleterious effect these groups had on the Executive Office's foreign policy agenda, presidents preferred, ceteris paribus, concessions that limited this mobilization. Strategic presidents did not ignore Congress but instead, used their authority to ensure enough support to continually renew the trade agreements program.
Our explanation of the opening of the US market focuses on how forward-looking presidents were able to undermine the creation of a majority in Congress opposed to continued delegation and thus trade liberalization. Our emphasis is less on delegation itself and instead, on the rules that Congress mandated for the form of liberalization. Congress constrained the president to reduce tariffs through reciprocal agreements with other nations focusing only on those products that each partner was the principal supplier of to the other. The logic was to limit tariff negotiations to products on which foreign governments would be willing to offer a significant concession. In preparation, Congress had demanded and received a listing of the principal importer of products in their districts.
In line with this mandate, presidents serially pursued treaty partners. At any one moment, only a subset of representatives needed to be wary of the effect of an agreement on their constituents. Further, even if a treaty could have affected products in their district, individual congressional representatives did not know the exact makeup of the reciprocal treaty. In essence, the form of tariff setting granted presidents significant latitude to choose both, among the set of principally supplied products and between possible treaty partners, understanding not only what products would be subject to competition but in whose district the products were produced most intensely. Highly sensitive products were strategically excluded from negotiation; countries importing such products were not sought as treaty partners.
Presidents succeeded in opening up the US market because this form of tariff setting changed interest group incentives to organize against liberalization. The effect of the rule was to create certainty for those members of Congress whose products were not principally supplied by the negotiating partner and uncertainty among the group of members of Congress whose products were in the product group. As a result, presidents could undermine the protectionist logroll that had existed in the past. Previous studies have focused on the collective action issues that groups faced post 1934; we turn attention to Congress and suggest that presidents sought to undermine collective action in the legislature as well, thereby ensuring continued support for their trade authority.
Theoretical Background
From the perspective of economics, a nation with open trade borders is neither problematic nor interesting—economic theory suggests that a country maximizes welfare under a free trade regime. Tariffs and other barriers to trade are inefficient and so famously, more than one thousand economists petitioned Congress against passage of what mandated the highest tariffs of the twentieth century, the Smoot-Hawley legislation. Accordingly, international agreements are unnecessary because nations have a unilateral incentive to keep barriers to trade low. There are exceptions, however. In some cases, trade policy can be a “second best” mechanism for redistribution, and economists understand that rent-seeking groups may capture and distort government policy. Even more problematic, large nations who can affect the world price of an imported product have an incentive to shift some of the cost of a tariff onto foreign producers and garner extra government revenue. Trade treaties in both cases may be necessary, either to constrain the provision of “pork” or to allow price-setting nations to engage in reciprocal agreements that constrain policies oriented toward improving their terms of trade.Footnote 5
Political scientists are far less sanguine that governments will favor open trade borders and much attention has focused on the US case where there has been significant variation in commercial policy. Some have argued that openness after World War II should be associated, either as cause or effect, with rising US power. In a classic paper, Krasner suggests that it is in a hegemonic nation's interest to facilitate world trade because they reap the majority of the economic and security gain.Footnote 6 Others have focused on the role of international institutions, which can facilitate free-trade deals by lowering the transaction costs of making cooperative agreements.Footnote 7 In these accounts, nations are interested in open markets, either because of some national welfare function that governments maximize or because of the structure of international power.
Other scholars, however, find the notion of an aggregated “interest” difficult to reconcile with domestic politics. Instead, those who study US government have traditionally emphasized the importance of groups, regions, and institutional structures as explanations for government policy. For these scholars, trade policy is the quintessential example of such a political process. Interest groups, mostly on the producer side, are often powerful supporters of elected officials and have been able to ensure a trade policy to their liking. Whatever the party in control, the specific benefits of the tariff outweigh its diffuse costs, especially in Congress where districts are relatively small. Voting rules, district size, and electoral competition are argued to be better predictors of tariffs than is either economic or national interests.Footnote 8
Given the long history of producer involvement in US tariff setting, it is not surprising that the opening of the US market after 1934 became a research puzzle for scholars. While most analysts agree that delegation of congressional authority to set tariffs to the executive branch facilitated trade liberalization, there is less agreement about why that occurred, the extent of congressional oversight, and the role of international treaties and/or delegation, in this process. Unpacking causality is difficult because a large party majority, delegation, and a change in tariff-setting processes occurred simultaneously. Scholars vary on which of these changes was the most important. Gilligan, for example, focused attention on how export groups balanced the rent-seeking behavior of import-competing groups.Footnote 9 Bailey and colleagues argued that reciprocal treaties mobilized those exporters in particular congressional districts; Goldstein and Martin suggested that dispute settlement procedures in the General Agreement on Tariffs and Trade (GATT) were key to maintaining congressional support.Footnote 10 The debate has been lively and long lasting, in good part because adjudicating among competing explanations for how the United States shifted to an open trade policy is difficult.
We offer a new metric, legislated rates, to evaluate these theories and further clarify the political process that facilitated the opening of the American market. These theories fall into two categories. First, a number of scholars direct attention to the political effects of the 1934 delegation of tariff-setting authority. Here, theorists generally assume that limits to access were necessary to address the overrepresentation of proprotection groups. Given that the goal of delegation was to protect Congress from interest group pressures, a delegation-focused approach would expect that tariff cuts would begin with those products that had previously enjoyed the highest rates of protection. Further, products with relatively lower tariffs should be a less likely focus for tariff cuts, since cuts would generate smaller overall reductions in the tariff schedule and could potentially energize a large group of anti-free-trade producers. Second, a set of theories on US trade liberalization emphasize either the balance between market access for exporters and the costs on domestic import-competing groups or the importance of reciprocity. Here, the expectation is that product characteristics, such as import patterns, would be determinative of the likelihood of liberalization. Accordingly, economic fundamentals of the individual products should determine both the extent of liberalization and the degree to which export- and import-related interests are balanced.
We find that the data and these theories are often at odds. Our analysis of the tariff schedule shows that reductions occurred in a targeted manner, not ignoring but in line with congressional politics. Presidents needed to orchestrate tariff reductions in the shadow of congressional politics, even in periods of unified government. Further, although balancing export interests against import-competing groups may have occurred over the long term, import-competing industries continued to be the focus of trade policy making postdelegation. Finally, import volume does not predict the timing or extent of liberalization. In short, product characteristics were not as predictive a measure of tariff reductions as were the districts where they were produced.
This lack of congruence between theory and data motivates our analysis. In order to better understand the micro-foundations of this shift in US trade policy, we focus on the president's choice of products to be subject to a tariff cut. The Reciprocal Trade Agreements Act (RTAA) of 1934 authorized presidents to select treaty partners, products, and the amount of tariff reduction. The presidents' choices were constrained by two legislative mandates. First, they operated under a short time horizon because they needed to return regularly to Congress for a renewal of tariff reduction authority. Second, they could select products only if the treaty partner was the primary importer of that item. These constraints affected product choice in a counterintuitive way. First, the principal supplier rule enabled presidents to predict what tariff reductions, and thus what representatives, would be subject to interest group pressure in any particular treaty. Elected officials may have agreed that opening borders to trade was a collectively good policy but they still could not support the program in the face of particularistic pressures. Given this constraint, presidents chose treaty partners, products, and timed reductions to undermine collective action in Congress and ensure majority support at the time of renewal. Second, the negotiating rule allowed the president to quell potential congressional interference that could have undermined the liberalization process. While treaty selection alerted producers of possible reductions, being on a targeted list did not ensure a tariff cut: negotiators retained flexibility about what products, and to what degree, a specific tariff line would be reduced. Presidents could selectively target liberalization and thus reduce proprotection pressures on individual members of Congress. In sum, the same institutions designed to maintain congressional control over the liberalization process via explicit negotiating rules in 1934 empowered the president to sustain the trade reform program and a proliberalization coalition.
How Did Tariff Reduction Occur?
Although Congress passed high tariff legislation throughout the nineteenth century, the Smoot-Hawley tariff in 1930 was notorious, not only because it raised overall customs duties to above 50 percent ad valorem (an amount not uncommon in the previous century) but because of its timing. After passage of the income tax in 1913, tariff revenue had diminished in importance; after World War I, the US international footprint grew rapidly and governments increasingly adopted the dollar as a world currency. Thus, the decision to return to the previous era of high tariffs brought universal criticism and what many argue were retaliatory tariffs by trading partners causing, or at least aggravating, what would become the Great Depression. But the height of the tariff wall was not the only source of criticism. For the next generation of scholars and policy-makers, the process of passage became the epitome of how interest group involvement and congressional logrolling can undermine the policy process.
The onset of the depression led to new majorities in Congress and the relegislation of the tariff. The new act, however, changed the process of setting rates and not the rates themselves. Sidestepping Article 2 of the Constitution, the RTAA granted presidents new authority to lower rates by up to 50 percent if they received reciprocal reductions in a partner's tariff. The authority required no ex post congressional vote.Footnote 11 Between 1934 and 1947, when the GATT came into force, presidents used this authority to conclude thirty-two such agreements with twenty-eight countries. This authority required regular congressional renewal and both Democratic and Republican party majorities reauthorized the program.Footnote 12 When the GATT went into force on 1 January 1948, Congress continued to grant negotiating authority.Footnote 13 By 1962, trade was no longer a partisan issue and both parties had platforms that endorsed the trade liberalization program.Footnote 14
Trade policy-making throughout this period was regulated by essentially the same rules and procedures.Footnote 15 The 1934 act and subsequent renewals stipulated that the president needed to seek advice from the Tariff Commission, the Departments of State, Agriculture, and Commerce, and from all other appropriate sources before lowering a tariff. To accommodate this mandate a series of committees, the Trade Agreements Committee, country-specific committees, and the Committee for Reciprocity Information were assembled to give interested parties the opportunity to present views. They took briefs and held public hearings. Until 1937, a formal announcement of intent to negotiate was accompanied by a list of the principal producers who could potentially get a tariff cut; afterward, this was later replaced by the “public” list, which signaled all items that were under consideration in any negotiation.
The 1934 act also dictated the form of tariff setting. All agreements were bilateral with some foreign government and although treaties had only two signatories, their effect extended beyond the two nations. After 1923, the United States was bound by executive order to grant most favored nation (MFN) privileges to its trading partners. Once the United States lowered rates for one nation as part of a bilateral process, others with whom the nation had a MFN agreement benefited immediately from the lower rate. The treaty process in the GATT was multilateral in essentially the same way. Negotiations occurred between dyads but all members of the organization benefited because of the MFN agreement that accrued from signing onto the GATT itself.Footnote 16 Twenty-three nations, some of whom already had bilateral agreements with the United States, participated in the initial GATT negotiation.Footnote 17
The president was bound by law to negotiate reciprocal agreements, meaning that import access necessitated an immediate and monetarily equal export gain. Reciprocity extended to parties withdrawing from the treaty. When this occurred the nation that was losing access had the right to demand compensation, either in the form of a changed tariff in another product or an increase in their own tariff schedule up to the lost revenue. The products on which the reciprocal agreements were initially made were those to which the trading partner was the “principal supplier.” Governments initiated negotiations with a declaration of a set of products they sought access for in the foreign market. Each partner would look at the list of “demands” and make counter “offers.” The process thus focused reductions on products that represented considerable importance in their markets and would concentrate negotiations on the members with the most at stake. Even so, smaller producers could “free ride” on a tariff concession but they were never able to affect the change themselves, something that the developing world would complain about in ensuing years.Footnote 18
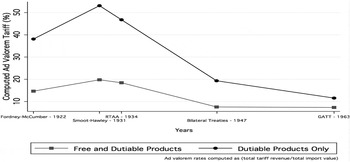
The downward effect on tariffs of these treaties is illustrated in Figure 1. The trend is evident if we measure duties on free and dutied products or only on products with a duty. There is an increase in tariffs in 1931 that declines after 1934. Following the literature, the data presented in this figure were computed from customs receipts.Footnote 19
US tariffs, 1922–1963

If we want to assess the process of liberalization, understood to be a function of policy change, a better measure of change in tariff policy is necessary since the measure is sensitive to a variety of economic events exogenous to the tariff rate and is highly aggregated.Footnote 20 The more logical measure of US policy is the tariff itself.Footnote 21 Thus, to better understand the liberalization process we collected legislated tariffs for the years between 1928 and 1963. These were transition years for US policy; it starts with the United States advocating high tariff barriers and ends with the United States offering free trade as part of a cohesive vision of anticommunism. Given the size of the tariff schedule and the number of industries that were on the “free list,” we focused data collection on industries that had obtained relatively high tariffs preliberalization. The act of reducing a tariff on a product with a low rate, already facing foreign competition, is far less difficult than for producers who have existed under a high tariff barrier. Our interest was in unpacking the data to analyze not all products but those that were privileged under the system in which Congress controlled the tariff schedule.
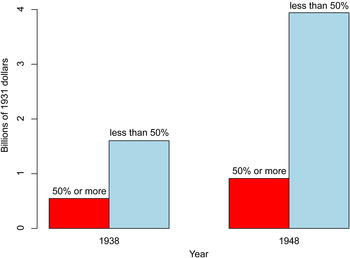
Our data set of highly protected products includes all products that had the equivalent of a 50 percent ad valorem tariff in the Smoot-Hawley Act. Although we used a computed ad valorem equivalent to select our products, we collected tariff levels as legislated, that is, as either a specific rate, an ad valorem rate, or as some combination. Once in the data set, we coded the tariff level on our products back to 1928 (pre-Smoot-Hawley level) and forward through the beginning of the Kennedy Round of trade negotiations (when the form of negotiation switched to the use of formulas).Footnote 22 In part a result of the liberalization process, our data set grew from the original 587 tariff product lines to more than 900 tariff lines because of splits in the tariff schedule of products into more specific categories. Our original products represented about 25 percent of all imports by value in 1938, not a marginal selection of products. As overall imports rose, and technology and tastes changed, their importance declined although the aggregate value of these imports rose (see Figure 2).
Highly protected imports by value, 1938 and 1948

Because we did not sample all industries, many of our conclusions are comparative between these products although we can compare this group with the overall customs revenue data. We chose these products, even given this sampling constraint, for a number of reasons. First, we thought that the general pattern of tariff reductions might overestimate the level of openness in the United States by averaging rates. Looking at the most-protected products, we have the “hardest” case for the liberalization of the US economy. Second, theories of interest group pressure would not inform cases in which products were not traditionally protected or producers were not interested in protection. Selecting highly protected industries allows us to assume that the producers overcame some collective action costs to gain protection. Third, by selecting all products with greater than a 50 percent tariff in Smoot-Hawley but collecting data on rates pre-1929, we were able to distinguish products that were “long term” protected from those whose tariffs rose in 1930 because of the idiosyncrasy of the passage of that act.Footnote 23 Given the political history of passage of the Smoot-Hawley Act, we assume that some industries were logrolled into the final bill that had not been traditionally well positioned in Congress.
What Happened to Highly Protected Products?
We measure tariff change in two ways. The first looks at breadth within an industry; the second at the depth of a particular tariff line. The implications of a change in each may be different. In the first, the issue is how products fared given that they often covered a number of different tariff categories. Since tariffs were negotiated as bundles of tariff lines, the number of lines covered in a treaty in any particular product classification can be a good measure of product-specific protectionism. The depth of cut is the alternative and more often used measure of tariff policy changes; however, in the absence of knowing demand elasticities, the effect of these cuts is difficult to assess. The number of products in a tariff bundle may be the better measure for interest group involvement.
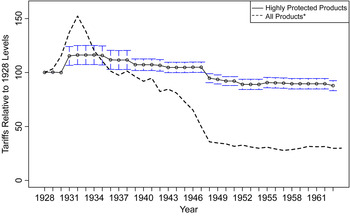
Although tariff rates, computed as an average of all rates, fell precipitously under the trade agreements program, tariffs on the products in our data set declined more slowly. If we use 1932 as the high point of US tariffs as measured by total duties collected (59 percent average tariff), US tariffs declined 57 percent under the RTAA program. From the rates starting in 1946, the GATT rounds reduced the average tariff by 54 percent, amounting to a total of an 80 percent reduction from the Smoot-Hawley high. These averages can be compared with the reduction in rates among the products in our data set that had some reduction in this period (see Table 1).
Rate of tariff reduction of highly protected products

Note: Products can appear more than one time since the count is of a reduction in either ad valorem or specific rates. If either occurred, they were counted; if both occurred, the product appears twice.
Although the tariff rates on our products declined slowly, and many products were excluded from reductions, many of our products did eventually become part of some tariff package. Including additional product lines created from tariff reclassifications, or splits, 41 percent of these products were part of a bilateral treaty and an additional 22 percent were reduced in the 1947 GATT. By the start of the Kennedy Round, 88 percent of the product lines had some reduction.Footnote 24 Of those products whose tariff rate in 1963 was the same as in 1930, 8 percent were never split or reduced and 48 products were created out of splits in which one of the new products retained a higher tariff rate. Since in total there were 164 products that were reclassified in these years, about one quarter of the time a product was split, that division left part of the tariff intact.Footnote 25
Figure 3 looks at the depth of cuts over time, illustrating significant variation between the rate of tariff reduction for highly protected US products and other products. Tariffs are indexed for comparison, allowing us to use both specific and ad valorem rate changes.Footnote 26
Indexed comparison of highly protected products with all imports, 1928–1963

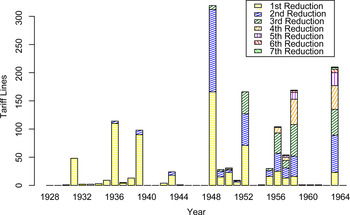
Much of the literature on international cooperation in trade emphasizes the shift from the period of bilateral agreements to that of the GATT. Our data, in opposition, suggest that the GATT was a continuation of a process that began earlier. To illustrate this, we divide our data into pre- and post-GATT years. Of those products with ad valorem rates, there were 216 pre-GATT product cuts and 268 post-GATT initial tariff cuts. Comparing these two groups, the initial cut for a product was almost identical: 20 percent in the bilateral years and 19 percent in the GATT years. For items with specific tariff rates, the average cut for the 124 lines negotiated during the RTAA bilateral treaties was 65 percent. For the 200 lines reduced during the initial GATT years, the average change was only 48 percent.Footnote 27 For products with specific duties, the bilateral treaty period was one of deeper initial cuts, in good part a reflection of price changes that resulted from the 1933 devaluation of the dollar. Figure 4 illustrates the history of reductions in our products. While the cuts were about the same in the two periods, we see that the GATT facilitated a process of repeated reductions of the same product, something we do not see in the bilateral years.
Tariff reduction frequency, 1928–1964

Comparing the bilateral and the GATT periods, they are more alike than different in terms of effectiveness in overall tariff reductions, and they appear to have focused on the same products. This is not surprising. Until the Kennedy Round moved to linear cuts, the GATT process was not different from that followed with RTAA treaties—both legislated dyadic item-by-item negotiations and results of each agreement universalized to nations with MFN status.Footnote 28 The principal supplier rule ensured that tariff reductions be limited to just those products exported by GATT members with valuable home markets.
Newly Protected Products
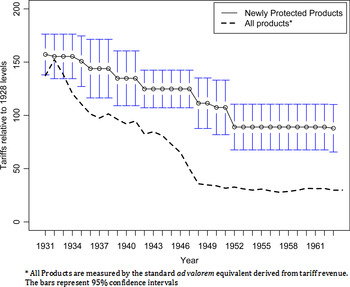
The Smoot-Hawley tariff act was infamous not only for its height but because of the level of logrolling that expanded the number of products highly protected. Logic suggests that the newly protected products would be less entrenched in Congress and given the change in party control, would be more likely to be reduced than those products not included as part of the logroll. To test this, Figure 5 shows the division of products by whether or not the tariff in 1931 was a result of the Smoot-Hawley logroll or reflected more long-standing tariff policy. We define the logrolled group as any product whose tariff increased 150 percent in the Smoot-Hawley bill. Although the sample of these “newly protected” products is limited, we can see that the decline among these products is less severe than the conventional measure of tariff liberalization.Footnote 29 Looking at each group, products that were “newly” protected in Smoot-Hawley saw their specific tariff rates decline about 21 percent before the GATT talks and then about 19 percent in the early GATT Rounds. Products that were highly protected before 1930 had a smaller, 10 percent reduction pre-GATT and a similar, 19 percent reduction post GATT.Footnote 30 This suggests that highly protected products that gained their protection recently had failed to consolidate their gains, and were early targets for reform.
Indexed comparison of tariff changes of newly protected products in 1930 with all tariffs, 1930–1963

Two patterns are now obvious from both the newly and traditionally protected products. First, much of the tariff changes we associate with this period occurred outside of products. What reductions occurred were more likely to have been made to the newly protected products. Second, there was no substantial change in tariff reduction trends with the creation of the GATT in 1948. Is this pattern of tariff changes better explained by traditional theories of interest group activity?
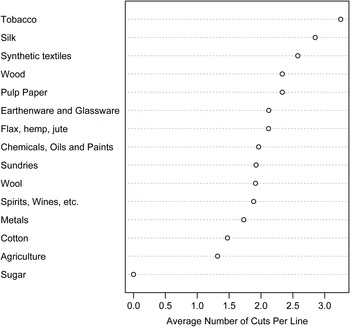
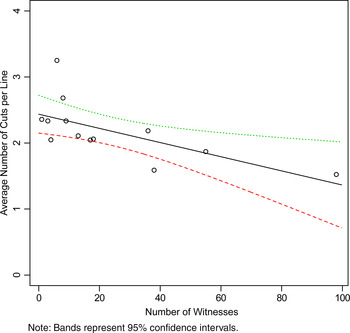
To assess the role of articulated interest, we aggregated products into fifteen tariff schedule categories to connect the process of liberalization with interest group activity.Footnote 31 Figure 6 organizes our products into those sectors and uses a count of the average number of reductions in each category. Cuts varied by sector. For example, silk and tobacco products were liberalized; sugar and metals less. Figure 7 then reports the test of whether or not testimony in Congress predicted tariff cuts. Each product representative who presented testimony was coded by sector and whether or not they supported renewal.
Mean frequency of reductions by industry, 1930–1964

Relationship between tariff reduction and congressional testimony

Somewhat surprising, we find a continuing relationship, postdelegation, between interest group activity in Congress and tariff rate, suggesting that interest group activity remained an important predictor of protectionism.Footnote 32 Thus, for example, consistent with what representatives stated to be industry interest in testimony, tobacco, the most affected by the program, was supportive of tariff cuts while sugar producers, barely touched by liberalization, uniformly fought any and all reductions.Footnote 33 We conclude that delegation in 1934 did not fundamentally undermine the pressure representatives felt from powerful producers; it was not a magic bullet that opened up trade in all products.Footnote 34
Explaining Liberalization
If the effect of delegation was not a more shielded Congress, what then explains tariff reductions? We begin by assuming that any explanation must take into account an activist Congress; interest groups continued to pressure representatives and Congress did regular and thorough oversight of the trade program. Further, if we look at legislative history, we find that the bilateral treaty format never strayed from the template set by Congress in the original 1934 authorization, even as the United States moved to negotiations in Geneva under GATT auspices after 1947.Footnote 35 As more nations negotiated under the GATT umbrella, they were constrained to use the item-by-item approach legislated in the original RTAA.Footnote 36 Congress forced the publication of, and public hearings on, products being considered for a tariff reduction. As the number of nations at trade talks grew, the published list of products went from the original three pages, to twenty, and eventually, most of the tariff schedule.Footnote 37
Given repeated congressional oversight (ten renewals before the Kennedy Round was complete), how did the president orchestrate the opening of the US border without endangering his renewal of negotiating authority? For a strategic president, the fear of interest group pressures on Congress remained a constant concern. He did, however, have agenda control: he could choose when to negotiate, who to negotiate with, and what products to place in a tariff bundle. We hypothesize that he used these “tools” to undermine congressional mobilization. We test this through a close examination of the timing, depth, and breadth of tariff cuts.Footnote 38
How Did Presidents Assure Congressional Renewal?
We would expect that presidents would be most worried about industry support at renewal time, especially when asking for additional tariff-cutting authority, as they did in 1945, 1958, and 1962. This could be manifest in a slowing down of treaty negotiations or a change in the type of products offered by negotiators. For example, presidents would probably not expand the number of products cut directly before an authorization because that would increase the possible members of a proprotection movement. On the other hand, presidents had something akin to a “hard” budget constraint, that is, they could reduce tariffs to only a specific level before asking Congress to reset the base of tariff reductions. They needed to use up the authority to justify more.
These observations lead us to expect the following from a strategic president:
-
• First, products would less likely be cut during the period in which Congress is considering the reauthorization of an existing tariff reduction level. The logic is that the president would not want to increase mobilization of groups whose interest would undercut his ability to get congressional assent.
-
• Second, this process should be even more critical when asking for an increase in authority. Authorizations for new authority, as opposed to time, should be more difficult, and should be preceded by periods of caution on the part of the president.
-
• Third, to further reduce pressure before more difficult authorizations, the president should focus tariff reductions on previously targeted groups. Industries whose products have already experienced liberalization should bear more of the burden through multiple reductions.
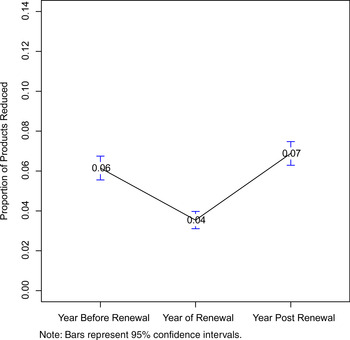
To assess these hypotheses, we begin by looking at the timing of initial cuts to our highly protected industries. Congressional renewals of authority occurred in 1945, 1958, and 1962.Footnote 39 Figure 8 looks directly at the size of the tariff packages, disaggregating the data and grouping them by whether the tariff was cut one year before, during, or following a renewal of authorization. The number of products reduced as part of a trade agreement appears to go down during a period of congressional renewal, before rising after the authorization is granted.
Tariff reductions pre- and post-RTAA renewal, 1934–1963

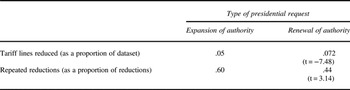
Did the products in the tariff bundle vary with renewal activity? The congressional record suggests that extensions were far less problematic to presidents than were renewals of authority for deeper cuts. If we look at House votes, for example, the 1937 renewal obtained a 75 percent majority in favor. By 1945, delegation of increased tariff-cutting authority could muster only a 61 percent majority (while the 1943 renewal had 84 percent of those present voting yes). Table 2 compares the proportion of all highly protected products reduced in the period before and including new authority against years during and before reauthorization. The table shows that presidents may have avoided increasing the proprotection coalition by retaining protection for a larger number of products before coming to Congress with the request for new and deeper tariff-cutting authority.
Relationship between amount of tariff reductions and timing of legislation

Note: Welch two sample t-test in parentheses tests the difference between the labeled cell and the preceding cell.
Another way the president can limit the pain on Congress, besides limiting the number of products at issue, is to limit the number of new products reduced. Table 2 asks what proportion of the tariff reductions in different authorization periods are the first time the tariff on that product was reduced. Not only does the president target products multiple times for reduction, he does so more often when seeking new authority. Reducing many products for the first time occurs more often when the next vote by Congress is not to grant new authority.
Market Access and Treaty Partner Selection
The data indicate that presidents were strategic in timing tariff reductions. In both the RTAA and GATT years, US negotiators were also able to choose products and partners with the knowledge of which districts would feel import pressures. Given congressional oversight, we would expect presidents to pick partners not only because of their overall export profile but also on the production location of their products in the United States. This prediction contrasts with the idea policy-makers designed treaties to reduce tariffs on products from nations with market power. If presidents so chose treaty partners to take advantage of the opportunity to reduce optimal tariffs, this would contradict our notion of congressional pressure.
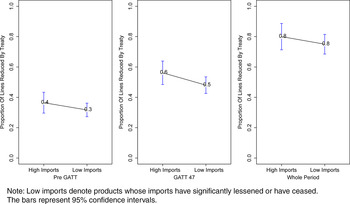
We first test the alternative—that the United States selected products that allowed reciprocal reduction of optimal tariffs.Footnote 40 In this time period, the United States did not collect price data on our products or reliable estimates of elasticities of demand;Footnote 41 the US tariff commission, however, did collect import data for all of our highly protected products in 1934, as well as for the previous three years. The commission data allow us to identify those products whose tariff was high enough to close off imports, measured as less than 5 percent of domestic production in a given year, and those that were not. Since optimal tariffs are designed to obtain better prices for imported products and increase tariff revenues, we can divide our tariffs into those with a rate so high as to cut off trade and those that allow trade and thus revenue and could be an optimal tariff. Of our products, 48 percent had negligible imports, and according to economic theory, have no “terms of trade” externality to solve with a trade agreement.
Figure 9 presents the data for our two groups. We look at the number of products reduced and whether or not the product could potentially have been set for terms of trade reasons.
Tariff cuts by import level, pre- and post-GATT

Looking at the reduction history of these two groups, we find no substantial difference between the tariff concessions on the products with potential terms of trade motivations and those with only domestic political economy motivations.Footnote 42 Whether we compare tariff cuts within each treaty period or across the two treaty regimes, we find no significant difference in the reduction of tariffs in the two groups.Footnote 43 These data do not support the idea of trade agreements as solving terms of trade externality.
We return to the alternative hypothesis, that is, that treaties were oriented toward a domestic constituency. There is reason to believe this is the case. Treaties were structured around item-by-item negotiation, providing an opportunity to protect sensitive producers. From the earliest years of the trade agreements program, Congress had mandated that the Executive Office produce lists of potential targets of a tariff reduction negotiation and allow interested parties time to appeal their placement on that list. Thus information was available to both the industry and to congressional representatives of the potential outcome of an upcoming negotiation on a particular producer.Footnote 44 Of course, there was uncertainty about whether or not the product would be in a tariff-cutting bundle. Still, producers who feared competition could articulate their interest and negotiators appear to have responded as suggested.
To examine whether or not treaties served a domestic audience, we begin by reviewing import patterns at the time of delegation. US imports of our highly protected products in 1934 were skewed toward a small range of nations (see Figure 10).Footnote 45 Some, but not all of these nations would participate in the bilateral program; some of those treaties covered many products and others did not. At the start of the liberalization process, the treaty that would have elicited the biggest problem for Congress was with Germany, who since the turn of the century had pursued an aggressive export-oriented strategy of growth and by the end of the 1920s, had become the principal supplier of more of our highly protected products than any other nation. While the United States could have approached Germany as a treaty partner in the 1930s, they chose not to; after that time, larger foreign policy dictates foreclosed such an agreement. Given that Germany was the principal supplier of so many US imports, a simple explanation for continued congressional support may just be that the president made sure that the program left a large number of their constituents untouched. Those who competed with German products had little incentive to expend any private costs to lobby their representative—they were never in danger of a tariff reduction.Footnote 46
Principal suppliers of highly protected products in 1931

Was the principal supplier rule so intended, that is, to provide clarity about who would and would not be affected by liberalization? In both testimony and practice, it appears that this was the intent of Congress. For just about all products, the principal supplier of the good in 1931 predicts the treaty partner associated with the concession on each tariff line. The one exception is that the UK negotiated on products that were previously supplied by Germany but by 1947, were supplied by the UK.
Legislators well understood the implications of the principal supplier rule. When Congress entertained the original bill sponsored by the State Department that allowed the president to negotiate to open the US market, members of the House Ways and Means Committee balked at treaties, less because it gave the president a new authority (treaties were always in the president's domain) but because the treaties would be shared with others via MFN agreements. The committee worried about free riding on the part of nations who did not give reciprocal access. Cordell Hull's response was to explain the notion of a “chief supplier” and he promised a treaty would only be on a product with a nation that was the low-cost producer. Explaining that the world economy was tied into a “hard knot,” the procedure, he said, was at best limited, “operating by singling out a leading commodity we buy from one country and ascertaining whether we can enter into, not hurtful relations in trade arrangements that would be a loss to us, but arrangements that would be equally profitable to us and other countries.”Footnote 47 This logic was accepted by Congress and became the norm for future trade agreements, allowing strategic presidents to choose partners as well as products as a means to induce congressional acquiescence with the treaty process. World War II made this convenient—some set of products were able to exist under high tariffs for an extended time period.
In sum, strategic presidents could control congressional dissent by choosing who to negotiate with. All treaties were bilateral and reciprocal. If a product was not on a “demand” list, it could retain its tariff rate, at least until the United States in the 1960s moved to formula reductions. Negotiations focused on only those products that involved each other's principal suppliers. To predict who needed to worry about tariff changes, the average member of Congress needed only to look at the import pattern of products in his or her district.
Germany's exclusion was part strategy and part historical circumstance. It is hard to know what level of opposition would have attended a German-US trade treaty had that been possible. But, the case illustrates the more general importance of a focus on trade partners. Presidents made overtures to nations through 1946 and then with the GATT could choose how to respond to requests for access. Although earlier scholars have focused on the mobilization of exporters as an explanation for congressional support, a simpler explanation may be that presidents could, and did, strategize on what nations and what products would more likely lead to congressional pressures. Exporters were important but undermining the potential power of interest group opposition remains part of the explanation for how the United States opened up its markets.
Targeting the Pain
The most direct tool in the president's arsenal to control congressional dissent was the choice of what products to reduce. We hypothesized that presidents would pay attention to production patterns when choosing a tariff reduction “bundle.” Following Olsonian logic, we assume that concentration of industry facilitates organization and thus political clout.Footnote 48 Concentration should both spur individual congressional activity and create the potential of a cross district logroll.
To evaluate the relationship between concentration and tariff reductions, we look at tariff-level reductions and industrial production patterns more closely. To measure the extent to which industry geography matters, we collect data on the number of production workers in four-digit industries across nine American regions. The Census of Manufactures provides data on production workers in each of the four-digit industries in each region. For example, the “bookbinding” sector employed 14,339 production workers nationwide in 1939.Footnote 49 The share of production in each region is used to calculate a Herfindahl-Hirschman Index, dividing each industry-region's number of workers by the sum of all workers in the industry, creating a “share” of each industry in each region. We then take the sum of squares of each of these shares and normalize between 0 and 1 as a proxy for congressional district interest.
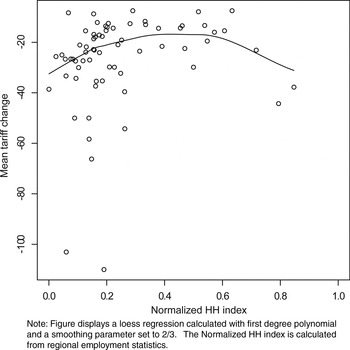
Figure 11 displays the relationship between the change in tariffs and concentration of production.Footnote 50 The extent of protection exhibits a quadratic relationship with concentration, that is, as industries become more concentrated, their ability to organize for political access improves to some optimal point after which it declines. Concentration of production increases the likelihood that a coalition of congressional representatives can be built to defend producer interests. However, when industries become overly concentrated, they become targets for reductions, since fewer representatives' districts are hurt by market opening. In short, two groups of industries were more likely subject to tariff reductions: industries whose production facilities were spread across many districts and industries wholly concentrated in very few districts. Coalition building in Congress appears to work best when an industry is large in a sufficient number of districts.
Relationship between tariff reductions and product concentration

Tariff cuts do appear to vary with industry concentration. Does the partisan character of the district in which the product was produced also affect whether or not a product was part of a tariff-reduction proposal? To examine partisan influence, we again use our data from the Census of Manufacturers and evaluate which districts had cuts and when. Our interest is in whether or not there was a systematic difference in tariff reductions by district and, more importantly, whether the president was able to target protection in response to electoral pressures. Retrospective accounts of politics during the FDR administration have emphasized the size of the Democratic congressional majorities, including ninety-seven new Democratic representatives who allowed the president great latitude to enact his policy agenda. Unified government and this Democratic sweep that occurred in 1932 is assumed to have insulated the Executive Office's policy goals from electoral concerns. However, no president can be sure of the partisan makeup of future Congresses; looking back at years of Republican hegemony, FDR could not have been sure of a long-term majority in Congress. With uncertainty over whether or not copartisans would retain office, a strategic president would likely choose to reduce tariffs on industries in marginally democratic districts, that is, districts with a low probability of retaining their Democratic Party member of Congress.
To test this hypothesis, we use our data to determine whether or not reductions in the tariffs of an industry correspond to a change in Democratic Party representation in the areas in which the product is produced.Footnote 51 If protection is targeted toward at-risk political constituencies, we would expect protection to be negatively correlated with sustained Democratic Party representation. On the other hand, if sustained Democratic Party representation is positively associated with protection, either it is the case that tariff reductions increased the competitiveness of the House seat, or, perhaps more plausibly, tariff reductions occurred in regions with more tenuous party control. In a sense, we predict that FDR and later presidents performed a form of triage, selecting the most winnable districts and letting the others go.
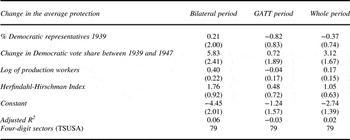
To do this analysis, we use our index of tariff changes, which includes both ad valorem and specific tariff rates. We then create an industry average using the four-digit Tariff Schedule of the United States Annotated (TSUSA) categorization.Footnote 52 To tie political interests to the protected industries, we use regional employment data and House membership. For the manufactured products, we transform the number of production workers per region into a share of production occurring in each region, generating a vector of weights.Footnote 53 The proportion of House members affiliated with the Democratic Party by state is averaged for each region, which is then multiplied by the above production vector for each sector in the same year. This provides a measure of the extent of Democratic Party representation for each industry. We similarly calculate the change in Democratic Party representation between 1939 and 1949. This allows us to ask whether the baseline proportion of Democratic House members that represent an industry is positively associated with protection, and further whether those regions with democratic gains (or that fewer democratic losses) are associated with protection.
The results displayed in Table 3 suggest that partisanship is correlated with protection in limited circumstances. Industries with production in Democratically represented regions in 1939 were neither more nor less likely to maintain protection in the years before the GATT. However, when we control for the baseline Democratic representation of an industry, we find that regions that maintained or gained Democratic seats in the 1948 elections were positively associated with protection. While this difference is suggestive, these correlations alone cannot reveal why production in a safe Democratic region as opposed to a marginal or Republican district provided some protection from tariff cuts.Footnote 54 Finally, in this analysis, industries with higher concentration are weakly associated with higher protection in the pre-GATT period. None of these results, however, hold for the period after the GATT. Overall, we conclude that in this period, partisanship is not as good a predictor of policy as production concentration is. This again suggests that presidents worried above all about potential mobilization in Congress, not just mobilization of interests currently represented by the party of the president.
OLS regression of change in average level of protection

Note: The dependent variable is an index of protection changes, averaged for each industry, ranging from −10 to 0, where −10 represents an average reduction of 10 index points per product year. More positive coefficients represent sustained protection. Standard errors are in parentheses. OLS = ordinary least squares.
Finally, strategic presidents had one other way to finesse congressional pressure on the trade program. The executive branch held a unique authority in tariff setting—the power to reclassify products on the tariff schedule. Negotiators had the ability to manipulate tariff categories and therefore, keep part or even most of an industry protected. Figure 12 shows the timing of these reclassifications, which increased under GATT but had occurred since the earliest negotiations.
New tariff lines, 1928–1963

The reclassification of products, also known as tariff specialization, has a long history as a protectionist strategy. For example, the 1936 US-France bilateral trade agreement reduced tariffs on French still wines by 40 percent, but the product was also split into two categories: “still wines shipped in containers holding less than one gallon,” and “still wines shipped in containers holding more than one gallon.” This allowed the United States to restrict the pain of reductions, albeit partially, and as it turns out, temporarily. This strategy is not limited to the United States; the most famous example of this behavior involved a German duty reduction granted to Switzerland on “large dappled mountain cattle or brown cattle reared at a spot at least 300 meters above sea level and which have at least one month's grazing each year at a spot at least 800 meters above sea level.”Footnote 55 This tariff line was designed to keep these concessions from applying to anything other than Swiss cows, in violation of the spirit of nondiscrimination promised by the Germans to their “most favored nation” partners.
In the US tariff schedule, a product could be reclassified with each new product receiving a different tariff reduction. By 1963, 164 products (about 20 percent) from our data set went through some reclassification, often multiple times, creating more than 300 new product lines. The division of the products yielded different rates for each group, although both were usually subject to reductions.Footnote 56 On average, for our products with a specific tariff, the “new” product with the lower tariff was on average 41 percent lower than the tariff of its “parent,” while the piece of the product that was given the higher tariff was 19 percent lower than its parent on average. Ad valorem tariffs tell a similar story, with the most affected “new” product experiencing a tariff 50 percent lower than its parent, while the more protected new product had a 22 percent lower rate than its parent.
Did this splitting of the tariff products undermine the opening of the US market? To some extent, reclassification allowed negotiators to fine-tune import patterns. Since all agreements were monetized swaps, however, and other nations were vigilant in demanding reciprocal treatment, it would be wrong to conclude that somehow spreading the “pain” of market liberalization undermined the process. For the most part, products that were split were still reduced. There were exceptions of course; forty-four products were neither cut nor reclassified and forty-nine products were created from a split that peeled them off from any reduction. This process of moving producers around in this manner may be better viewed as another “tool” in the toolkit of negotiators who understood that congressional representatives were under constituent pressure. These product categories remind us that American liberalization was less about finding the most efficient mode of tariff reduction than in assuring that reductions would not undermine support for open markets.
Conclusion
Among scholars, delegation of power to the president in 1934 is widely believed to have been a necessary requisite for tariff reductions in ensuing years. Remaking commercial policy in the 1930s has been said to have “fixed” a structural bias created by the Constitution's granting of tariff authority to the House of Representatives. According to the conventional wisdom, delegation to the president sheltered Congress from constituent pressure thereby facilitating the opening of the US economy and the emergence of the United States as a world power.
Recognizing the importance of delegating authority still leaves the puzzle of just how the new institutional arrangement changed policy. Our study offers that explanation with a close examination of the US tariff schedule, focusing on highly protected products. We looked at which products were subject to market forces and at what time. Our conclusion is that post-1934, delegation led to a change in trade policy, not because delegation eliminated the influence of Congress, but rather because presidents were able to target the “pain” of market forces so as to avoid the creation of a congressional majority willing to halt the trade agreements program.
Most of the products that were highly protected under Smoot-Hawley did face foreign competition by the close of the Kennedy Round. Why did Congress not balk then? In part, preferences were changing in Congress and by 1960, the national party platforms suggest that both parties had come to view trade openness positively.Footnote 57 As important, however, is the speed with which the US economy was growing and incumbents' fear of a postwar economic reversion. History shows, however, that the United States never suffered the expected slump. Job growth never slowed and the US economy expanded rapidly, in part because of a lack of competition from our traditional rivals.Footnote 58 By the time the economy had slowed, few elected leaders questioned the need to keep the US market open. Smoot-Hawley had become anathema.
Policy reform is difficult in the American system of government and congressional oversight is more often synonymous with stalemate than policy creativity. Even when the president's party controls both houses of Congress, the president may find severe constraints. Roosevelt came to office with near universal support, yet he too found that it was near impossible to ignore the relationship between Congress and powerful interest groups, a relationship that perseveres no matter the political party. Delegation to the president and later to the GATT may have granted agenda control to an agent but the principal here, Congress, held veto power, given that they were able to so mobilize. Rational presidents oriented their policy to undercutting that mobilization. Congress and the president shared power, both worrying about policy mobilizing dissent. In essence, power here should be seen as the ability not to be forced to adjust to market pressures. On this dimension, US industries varied dramatically.
Are these findings consistent with previous scholarship? First, we do not dispute the importance of export interests in stabilizing US trade policy, but instead we suggest that the interests of exporters alone cannot explain policy change.Footnote 59 Trade treaties provide markets in the future; votes to facilitate those treaties are taken based on existing district pressures. A full account of trade liberalization must pay attention to both export interests and the power of existing import-competing groups.Footnote 60 Second, a number of scholars rightly draw attention to the importance of partisanship and unified government.Footnote 61 While agreeing that having a large majority may have been instrumental for legislating in 1934, it did not deter vigilant oversight by Congress of the Executive Office. The data suggest that presidents were kept on a “short leash” no matter their party affiliation. Finally, for scholars who portray delegation as a fundamental reform in US institutions, our study suggests a much more nuanced interpretation of the effects of the trade act of 1934 and later, the creation of the GATT.Footnote 62 Looking back, policy may seem coherent and oriented toward a changing foreign economic profile for the United States. However, it is hard to reconcile this vision with politics of the period. Policy change in these years was incremental, hard cases of trade liberalization were deferred, and presidents did not, and could not, ignore proprotection interests in Congress.
There are two limitations to the analysis suggested in this study. First, the interests of congressional representatives were not fixed but shifted along with the underlying economic reality—trade liberalization was not solely a function of institutional redesign. The growth of trade after World War II changed the interests of consumers and producers and thus the policy preferences of their elected officials. The result was decreasing opposition to trade reform and liberalization. Second, we assumed that the selection of partners and products could be made independently of the rest of the world. Given the size of the US market, this was often the case. But as newly declassified data suggest, US treaty partners were also constrained in what they were willing to offer in return for access to the US market.Footnote 63
In sum, our review of the details of tariff history clarifies how American trade policy shifted from relative autarky to open trading borders. Just as today, trade liberalization in the early twentieth century created political problems for elected officials who needed to respond to groups adversely affected by market forces. We described how the United States, a country with a political system poorly designed for global leadership, used existing political institutions to target the costs of international openness. The most general lesson from this history may be that the costs of market pressures need to be distributed in a way that prevents political mobilization. This is a lesson that is as applicable today as it was almost a century ago.