Introduction
Frequency tuning or frequency reconfigurable antennas have become a popular approach for wireless platforms to achieve noise rejection and to resist interference in the operating bands [Reference Costantine, Tawk, Barbin and Christodoulou1]. In general, electrically frequency tuning antennas can be divided into two implement techniques, which are discrete or continuous frequency tunings. Reconfigurability for discrete frequency tuning is usually achieved by switching the states of PIN diodes or Micro-electromechanical Systems (MEMSs) to change electrical lengths of radiators [Reference Qin, Weily, Guo, Bird and Liang2,Reference Nie, Zhai, Liu, Li, Hu and Shi3] or by connecting parasitic structures which can produce new resonances [Reference Jin, Deng, Xu, Yang and Liao4,Reference Genovesi, Candia and Monorchio5]. In [Reference Qin, Weily, Guo, Bird and Liang2], a reconfigurable folded dipole is developed using four PIN diodes to realize a discrete tuning in the bands of 5.3–6.6 or 6.4–8 GHz. A differential-fed frequency reconfigurable dipole antenna is proposed in [Reference Jin, Deng, Xu, Yang and Liao4]. By changing the PIN diode states inserted in the two pairs of vertical arms, this design can change its working frequency between 3.5 and 5.5 GHz.
On the other hand, continuous frequency tuning can be accomplished by using varactor diodes [Reference Ge and Luk6,Reference Li, Yeh, Huang, Chang, Yu and Fu7] or liquid metal [Reference Dey and Mumcu8,Reference Liu, Wang, Jia and Zhu9]. A circular monopolar patch antenna is proposed in [Reference Ge and Luk6], which can continuously tune its operating frequency from 1.64 to 2.12 GHz by using eight varactor diodes. Due to the fluidic property of liquid metal, it paves a way as a potential mechanism for realizing frequency reconfigurability. In [Reference Dey and Mumcu8], a continuous tuning range of 1.7–3.5 GHz is obtained by a microfluidically controlled monopole antenna. The actuation of liquid metal has a lower response speed and larger space for implementing the microchannels compared to antennas using varactor diodes [Reference Zhang, Yu, Ding and Wu10].
Fabry–Perot Cavity (FPC) antenna has drawn much attention in the demands for achieving compactness and enhanced radiation features. Generally, it is comprised of a frequency-selective surface (FSS) structure on top of a ground plane. Waveguide, microstrip dipole or patch antenna is usually chosen as the exciter in the middle or at one end of the cavity. As a conventional category, high-gain and wideband FPC antenna has been intensively researched by the methods of using a multi-layer reflective surface as the superstrate [Reference Qin, Ji, Chen and Guo11] or employing a modified ground plane structure [Reference Wu and Luk12]. In recent years, reconfiguration has been applied to FPC antennas to achieve 1D/2D beam steering [Reference Ji, Zhang and Liu13,Reference Ratni, de Lustrac, Piau and Burokur14], polarization switch [Reference Zhu, Cheung, Chung and Yuk15], or frequency agility [Reference Weily, Bird and Guo16–Reference Ji, Pei, Zhang and Li18]. By changing the biasing voltages applied to the patch-type phase-changing unit cells above the ground, the proposed FPC antenna in [Reference Weily, Bird and Guo16] can achieve a continuous frequency tuning from 5.2 to 5.95 GHz (13.4%). Its maximum realized gain is 16.4 dBi with a gain variation of 6.4 dBi. Similar with the patch-type unit cells in [Reference Weily, Bird and Guo16], the antenna in [Reference Huang, Pan, Ma and Luo17] can achieve frequency variation from 9.05 to 10 GHz (10%) as well as reducing its radar cross-section. In [Reference Ji, Pei, Zhang and Li18], a bowtie-shaped phase-changing unit cell is presented. By employing 48 such unit cells around the main exciter, this design can realize a continuous frequency tunability from 5.1 to 6.0 GHz (16.2%) with a directivity variation from 9.6 to 15.0 dBi. It can be noted that although there are some important advances in the frequency tuning FPC antennas, the technologies to achieve a larger frequency tuning range with a smaller gain/directivity variation are still lacking.
In this paper, an FPC antenna with continuous frequency tunability is proposed by employing 48 reconfigurable phase-changing elements on the high impedance surface (HIS) structure. The HIS element consists of a ring-type reflective structure, two varactor diodes embedded in the middle of the ring structure, and four biasing lines to connect the adjacent elements. By varying the biasing voltages of the varactor diodes, the operating frequency of the proposed FPC antenna can be tuned continuously from 4.87 to 5.84 GHz (18.1%). The maximum realized gain of this design is changed simultaneously with its resonance frequency when the varactors are working at different biasing states. The measured results show that the realized gains are varied from 10.2 to 14.1 dBi. Compared with some other reported designs in [Reference Weily, Bird and Guo16–Reference Ji, Pei, Zhang and Li18], this design can achieve a larger frequency tuning range with a much smaller size. Furthermore, the gain variation of this work is much lower compared with the antennas in [Reference Weily, Bird and Guo16] and [Reference Ji, Pei, Zhang and Li18].
Element design
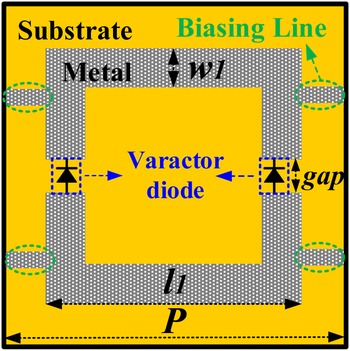
Figure 1 plots the detailed structure of the proposed phase-changing element. It is printed on a 1.524 mm-thick Rogers 4003 substrate with a square ring and four biasing lines etched on one side of the substrate. The metal ground is printed on the other side. The square ring has a length of l 1 and a width of w 1. The biasing lines here are utilized to connect the adjacent elements and to maintain the current continuity. The length and width of the biasing lines are 2.2 and 0.3 mm, respectively. A gap is inserted in the middle of the ring structure to employ two varactor diodes in each vertical arm. The parameters of this element are summarized here: P = 16 mm, l 1 = 11.6 mm, w 1 = 1.5 mm, gap = 0.3 mm.
Schematic of the HIS element.

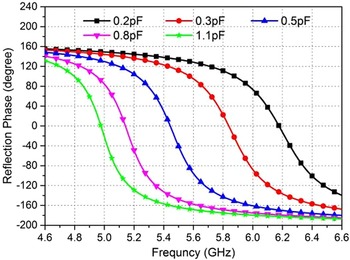
The performance of the proposed element has been verified by the simulation in CST using a periodic boundary condition. MA46H120 varactor diode is chosen in this paper. It is simulated as a series RLC circuit which has a resistance of 2.6 Ω, a parasitic inductance of 20 nH, and a variable capacitance tuning from 0.2 to 1.1 pF. The resonant frequency of the element can be defined as the 0° reflection phase [Reference Weily, Bird and Guo16] and it can be changed by controlling the capacitance of the varactor diodes, which also leads to a variation of the HIS reflection phase. It is seen from Fig. 2 that the resonant frequency can be continuously varied from 4.97 GHz (1.1 pF) to 6.18 GHz (0.2 pF). In this paper, only five typical values of 0.2, 0.3, 0.5, 0.8 and 1.1 pF are chosen to show their relevant performances.
Simulated reflection phase of the proposed HIS element.

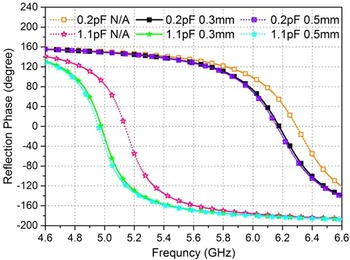
For biasing convenience, four biasing lines are employed between two adjacent elements. We simulated the effects with and without biasing lines (marked as N/A in Fig. 3). It is found that without the biasing lines, the resonant frequency will shift to higher frequency. Since the ring is located right in the center of the element structure, when the value of l1 is fixed, the lengths of the biasing lines are determined. The effects of the biasing line width have also been carried out in the simulation with two chosen values of 0.3 and 0.5 mm. It is found that the width of the biasing lines has little effects on the reflection phase. As a result, the influence of biasing lines should not be neglected in the element design.
The effects of the biasing lines.

Antenna design and analysis
Figure 4 gives the whole structure of the proposed FPC antenna. It is excited by a double-layer square patch antenna. The main patch is located in the middle of the HIS layer with a side length of 13.1 mm. The parasitic patch structure is etched on the bottom layer of a 0.5 mm-thick Rogers 5880 substrate with a side length of 17 mm. It is located hs higher than the main patch. The parasitic patch is utilized to excite more operating elements on the HIS to achieve a better impedance matching and radiation performances. The FSS superstrate is realized by employing 6 × 6 square-patch unit cells while the HIS structure is employed with 48 phase-changing elements. Figures 4(b) and 4(c) plot the layouts of the proposed HIS and FSS, respectively. The dimensions and performances of the phase-changing element are described in section “Element design”. The period and the size of the FSS unit cell are 20 and 19 mm, respectively. Across the band of interest (5.0–6.2 GHz), the reflection magnitude of the FSS unit cell varies from −0.32 to −0.2 dB, while the reflection phase is changed from −164° to −168°. Its graph is omitted here for brevity.
The whole antenna structure. (a) Side view, (b) the HIS, (c) the FSS.

For FPC antennas, a maximum realized gain at the broadside is obtained when the cavity height (Lr) satisfies the condition below.

where φ 1 and φ 2 represent the reflection phases of the FSS and the HIS, respectively. In the design, the operating frequency of 6 GHz is chosen to calculate the cavity height with φ 1 = −168° and φ 2 = 73.2° (0.2 pF). The final dimension of the whole structure is 140 mm × 140 mm × 18.5 mm after optimization.
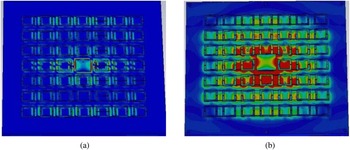
The parasitic patch has a significant effect on the resonant frequency. Figure 5 gives the surface currents induced on the HIS (at the same phase) with and without the parasitic patch. It can be found that when there is no parasitic patch, the currents are generally distributed around the main patch and most parts of the HIS section have not been excited (Fig. 5(a)). When the parasitic patch is employed above the main patch, more currents and elements have been induced on the HIS (Fig. 5(b)). Finally, the height of the parasitic patch hs = 2 mm is chosen in this design since it has a better impedance matching for all the five selected states.
The simulated surface currents on the HIS. (a) Without the parasitic patch, (b) with the parasitic patch.

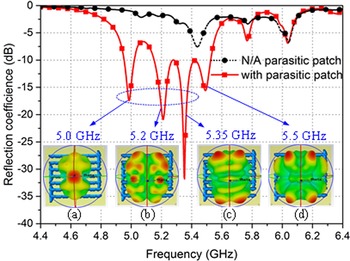
Though the parasitic patch can enhance the cavity performance, it generates new resonant frequencies by exciting higher modes. As shown in Fig. 6 (the case when the capacitance is 0.8 pF), without the parasitic patch, the impedance matching is not acceptable. While with the parasitic patch, the impedance matching at 5.0 GHz is improved significantly as well as generating new resonances at 5.2 and 5.35 GHz. However, only the resonance at 5.0 GHz has the required boresight radiation pattern as plotted in insets of Fig. 6(a). There are nulls at the boresight for other frequency points, which may not affect the operation at 5.0 GHz as plotted in Figs 6(b)–6(d). The performances for other capacitance values have the similar properties and their relevant reflection coefficients and pattern analyses are omitted here.
Simulated reflection coefficients and patterns when capacitance = 0.8 pF.

Antenna results
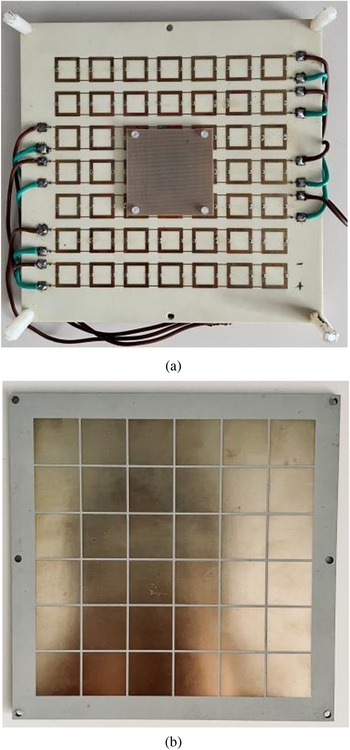
A continuous frequency tuning FPC antenna prototype has been fabricated and measured to verify the design principle. Figure 7 shows the prototype of the proposed antenna. Since all the HIS elements in each row have the same capacitance, they can be connected in parallel and only one biasing voltage is needed in this design. Each row has an individual biasing network with two biasing pads for voltage inputs, and a 22 nH surface-mounted RF choke inductor, except for the center row which has been separated by the main patch. Some 0.3 mm-thin metallic biasing striplines are utilized between two adjacent elements for current continuity.
Prototype of the proposed FPC antenna. (a) The HIS and the parasitic patch, (b) the FSS.

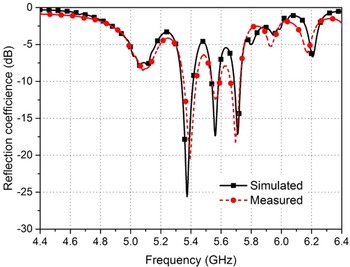
Figure 8 gives a group of simulated and measured reflection coefficient results when the capacitance is 0.5 pF for brevity. Table 1 summarizes the tuning property of the proposed antenna: when the capacitance is varied from 1.1 to 0.2 pF, the simulated resonant frequency changes from 4.88 to 5.85 GHz. Accordingly, the measured results are changed from 4.87 GHz (0.2 V) to 5.84 GHz (5.5 V), which agree well with the simulated ones.
One typical input reflection coefficients of this design.

The performances for the selected five states

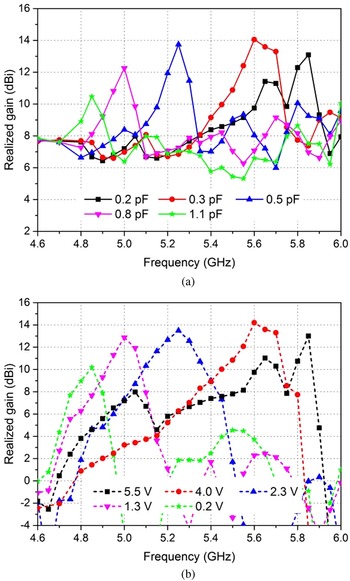
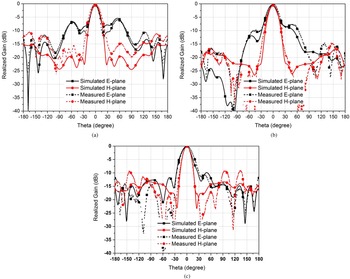
The realized gains with frequency for different states and their relevant radiation patterns were measured in a self-built antenna chamber. The realized gains for the selected five states are shown in Fig. 9. It is seen from this graph that the maximum realized gains with different capacitance values can be changed consistently with the variation of the resonant frequencies. The maximum and minimum gains with frequency for the simulated results are 14 dBi (0.3 pF) and 10.5 dBi (1.1 pF), respectively. While the maximum and minimum gains for the measured ones are 14.1 dBi (4.0 V) and 10.2 dBi (0.2 V), respectively. The difference between the simulated and measured maximum gains is less than 1 dB for all the five selected states. Figure 10 plots the normalized radiation patterns at 5.0, 5.25, and 5.8 GHz. It is observed that this FPC antenna design can achieve a broadside radiation and the simulated results are in coincidence with the measured ones.
Realized gains with different capacitors and biasing voltages. (a) Simulated, (b) measured.

Normalized patterns of the proposed antenna at different frequencies. (a) 5.0 GHz, (b) 5.25 GHz, (c) 5.8 GHz.

A performance comparison with some other reported frequency tuning designs is given in Table 2. From this table, it is found that the proposed antenna has a much smaller antenna size, a larger frequency tuning range with a relatively small gain variation between different states.
Performance comparison between the proposed antenna and some other reported antennas

Conclusion
A continuous frequency tuning FPC antenna with stable radiation performance is presented in this paper. By controlling the biasing voltages of the varactor diodes inserted on the 48 phase-changing HIS elements, the proposed antenna can achieve a continuous frequency variation from 4.87 to 5.84 GHz (18.1%). Compared to some other reported frequency tuning FPC antennas, this design can realize a larger frequency tuning bandwidth with a much smaller antenna size. Moreover, the realized gains for different operating frequencies are changed from 10.2 to 14.1 dBi, which validates that it can realize a relatively stable radiation performance when the frequency is tuning.
Acknowledgements
This work was supported by the China Postdoctoral Science Foundation (Grant No. 2020M673481) and Natural Science Basic Research Plan in Shaanxi Province of China (Program No. 2023-JC-QN-0639).
Conflict of interest
None.
 Lu-Yang Ji was born in Shaanxi Province, China, in 1989. She received the B.S. degree in electronic engineering and the Ph.D. degree in electromagnetics from Xidian University in 2010 and 2016, respectively. From 2013 to 2015, she had worked as a visiting Ph.D. student in reconfigurable antennas at CSIRO DPAS Flagship, Marsfield, Australia. She now works as an associate professor at Northwestern Polytechnical University. Her research interests are in the areas of liquid metal antennas, metasurface-based antennas and reconfigurable phased array.
 Shuai Fu received his B.S. degree in electronic engineering and the M.S. degree in optical engineering from Xidian University in 2010 and 2014, respectively. He now works as an engineer at Northwest Regional Air traffic management bureau of CAAC. His research interests are in the areas of meteorological radars and phased array antennas.