1. INTRODUCTION
The future behavior of a dynamic system can be predicted on the basis of historical states of that system or relationship of this behavior to other relevant variables. Electricity consumption prediction mainly deals with the amount of electricity that should be generated over a specific period of time. Such prediction plays an important role in the planning of electricity systems and greatly influences the national economy and people's daily life. The accuracy of electricity prediction is important for electricity utilities and for consumers.
A number of studies have been published about modeling of electricity consumption using regression analysis and econometric models and time series analysis. Recently, electricity consumption models using weather and population size (Yan, Reference Yan1998), using economical and climatic variables (Rajan & Jain, Reference Rajan and Jain1999) and using economical variables (Egelioglu et al., Reference Egelioglu, Mohamad and Guven2001; Ceylan & Ozturk, Reference Ceylan and Ozturk2004) have been studied. These models need measuring the number of climatic and economical variables. Sometimes obtaining the values of these variables is very difficult over the prediction period, and this is not enough for accurate model development.
Time series models have been extensively used in electricity consumption prediction. These are the growth curve model (Ang & Ng, Reference Ang and Ng1992) and the autoregressive moving average (ARIMA) model (Abdel-Aal & Al-Garni, Reference Abdel-Aal and Al-Garni1997a; Saab et al., Reference Saab, Badr and Nasr2001). These models need a large number of historical data to obtain satisfactory prediction accuracy, and this accuracy depends on the order of nonlinearity of the considered problem. Like ARIMA models, the gray forecasting models were developed for electricity demand and load forecasting (Yao et al., Reference Yao, Chi and Chen2003; Yao & Chi, Reference Yao and Chi2004). These prediction models are based on technical analysis of time series, such as looking for trends, stationarity, seasonality, random noise variation, and moving average (Box et al., Reference Box, Jenkins and Reinsel1994). These time series models are linear models, and they do not provide enough satisfactory prediction accuracy for nonlinear processes.
Many studies have been devoted to the development and improvement of time series forecasting models. Chaotic time series were modeled and predicted using soft computing methodologies such as neural networks (NNs), fuzzy logics, and genetic algorithms (GAs; Lapades & Farber, Reference Lapades and Farber1987; Hill et al., Reference Hill, O'Connor and Remus1994; Jang, Reference Jang1997; Nunnari et al., Reference Nunnari, Nucifora and Randieri1998; Smaoui, Reference Smaoui2000; Zhang & Chan, Reference Zhang and Chan2000). These models are nonlinear models, and have shown clear advantages over the traditional statistical ones (Maddala, Reference Maddala1996). NNs have recently been widely used for prediction of time series. Because of nonlinearity existing in electricity load series, NN models have gained importance in electricity demand and load forecasting (Abdel-Aal & Al-Garni, Reference Abdel-Aal and Al-Garni1997b; Al-Shehri, Reference Al-Shehri1999; Hsu & Chen, Reference Hsu and Chen2003). Their prediction capability exceeds those of the conventional methods. In this paper, to increase prediction accuracy and reduce search space and time for achieving the optimal solution, the combination of soft-computing technologies, such as wavelet NNs (WNNs) with a fuzzy knowledge base is used for time series prediction, in particular, for the prediction of electricity consumption in North Cyprus.
Fuzzy technology is an effective tool for dealing with complex, nonlinear processes characterized with ill-defined and uncertain factors. Traditionally, to develop a fuzzy system, human experts often carry out the generation of IF–THEN rules by expressing their knowledge. In the case of complicated processes, it is difficult for human experts to test all the input–output data and find necessary rules for the fuzzy system. To solve this problem and simplify the generating of IF–THEN rules, several approaches have been applied (Yager & Zadeh, Reference Yager and Zadeh1994; Jang, Reference Jang1997). Today, the use of NNs takes more importance for this purpose. NN models basically use the sigmoid activation function in neurons. However, the sigmoid function is not orthogonal, and the energy of the sigmoid function is limitless, and this leads to slow convergence. Wavelet function is a waveform that has limited duration and an average value of zero. The integration of the localization properties of wavelets and the learning abilities of NN shows advantages of WNNs over NN in complex nonlinear system modeling. A WNN that uses wavelet functions have been proposed by researchers for solving approximation and classification problems (Kugarajah & Zhang, Reference Kugarajah and Zhang1995; Zhang & Benviste, Reference Zhang and Benviste1995; Zhang et al., Reference Zhang, Walter and Wayne Lee1995). WNNs are used for the prediction of chaotic time series (Cao et al., Reference Cao, Hong, Fang and He1995), for short-term and long-term prediction of electricity load (Chang et al., Reference Chang, Weihui and Minjun1998; Khao et al., Reference Khao, Phuong, Binh and Lien2004). The wavelet analysis approximates the decomposed time series at different levels of resolution. Fuzzy WNN (FWNN) combines wavelet theory, fuzzy logic, and NNs. The synthesis of fuzzy wavelet neural inference system includes the finding of the optimal definitions of the premise and consequent part of fuzzy IF–THEN rules through the training capability of WNNs, evaluating the error response of the system. A combination of fuzzy technology and WNN has been considered for solving signal processing and control problems (Lin & Wang, Reference Lin and Wang1996; Thuillard, Reference Thuillard2000). Fuzzy systems with linear combination of the basis function (Lin & Wang, Reference Lin and Wang1996), wavelet network model of fuzzy inference system (Thuillard, Reference Thuillard2001; Guo et al., Reference Guo, Yu and Xu2005) are proposed. Thuillard (Reference Thuillard2001) proposed to choose the membership functions from the family of scaling functions, and to construct the fuzzy system using wavelet techniques. Fuzzy wavelet network that includes combinations of three subnets: pattern recognition subnet, fuzzy reasoning subnet, and control synthesis subnet is introduced (Lin et al., Reference Lin and Wang2005). The use of such multilayer structures complicates the architecture of the system. The FWNN structure that is constructed on the base of a set of fuzzy rules is proposed and used for approximating nonlinear functions (Daniel et al., Reference Daniel, Ping-An and Jinhua2001). The FWNN-based controller is developed for the control of dynamic plants (Abiyev, Reference Abiyev2005) and time series prediction (Abiyev, Reference Abiyev2006). The combination of wavelet network and fuzzy logic allows us to develop a system that has fast training speed, and to describe nonlinear objects that are characterized with uncertainty. Wavelet transform has the ability to analyze nonstationary signals to discover their local details. Fuzzy logic allows us to reduce the complexity of the data and to deal with uncertainty. An NN has a self-learning characteristic that increases the accuracy of the prediction. These methodologies are used here to construct fuzzy wavelet neural inference system to solve electricity consumption prediction problem.
The paper is organized as follows: Section 2 presents the structure and learning algorithms of the FWNN system. Brief descriptions of the gradient descent algorithm and GA used for learning of FWNN are given. Section 3 contains simulation results of the FWNN used for prediction of chaotic time series. The application of developed structure is used for electricity consumption prediction. Comparative results of different models for time series prediction are given. Finally, a brief conclusion is presented in Section 4.
2. FWNN
Wavelets are defined in the following form:

Here, Ψj(x) represents the family of wavelet obtained from the single ψ(x) function by dilations and translations, where a j = {a 1j, a 2j, … , a mj} and b j = {b 1j, b 2j, … , b mj} are the dilation and translation parameters, respectively; x = {x 1, x 2, … , x m} are input signals; and ψ(x) is localized in both time space and frequency space and is called a mother wavelet.
Wavelet networks include wavelet functions in the neurons of hidden layer of network. The output of WNN is calculated as

Here, d j = a j−1 × b j, Ψj(x) is the wavelet function of the jth unit of the hidden layer, w j is the weight coefficients between the input and hidden layers, and a i and b j are parameters of the wavelet function. WNN has good generalization ability, can approximate complex functions to some precision very compactly, and can be easily trained than other networks, such as multilayer perceptrons and radial-based networks (Szu et al., Reference Szu, Telfer and Garcia1996; Khao, 2004). A good initialization of the parameters of WNNs allows to obtain fast convergence. A number of methods is implemented for initializing wavelets, such as orthogonal least square procedure, clustering method (Kugarajah & Zhang, Reference Kugarajah and Zhang1995; Zhang & Benviste, Reference Zhang and Benviste1995). The optimal dilation and translation of the wavelet increases training speed and obtains fast convergence. The approximation and convergence properties of WNN are presented in Zhang et al. (Reference Zhang, Walter and Wayne Lee1995).
This paper presents FWNN that integrate wavelet functions with the Takagi–Sugeno–Kanag (TSK) fuzzy model. The kernel of the fuzzy system is the fuzzy knowledge base that consists of input–output data points of the system interpreted into linguistic interpretable fuzzy rules. The consequent parts of TSK type fuzzy IF–THEN rules are represented by either a constant or a function. As a function, most of the fuzzy and neurofuzzy models use linear functions. Neurofuzzy systems can describe the considered problem by means of combination of linear functions. Sometimes these systems need more rules for modeling complex nonlinear processes to obtain the desired accuracy. Increasing the number of the rules leads to increasing number of neurons in the hidden layer of the network. To improve the computational power of the neurofuzzy system, we use wavelets in the consequent part of each rule. In this paper, the fuzzy rules that are constructed by using wavelets are used. They have the following form:
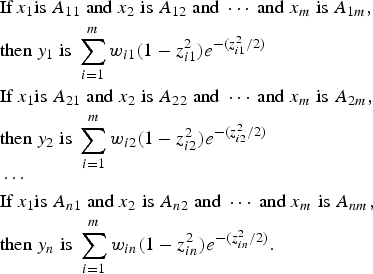
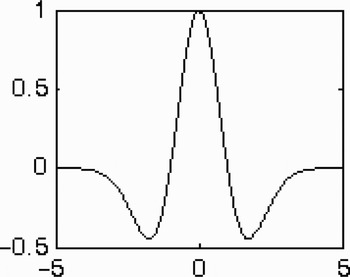
Here, x 1, x 2, … , x m are input variables, y 1, y 2, … , y n are output variables that are Mexican Hat wavelet functions, A ij is a membership function for the ith rule of the jth input defined as Gaussian membership function. n is the number of fuzzy rules. Conclusion parts of rules contain WNNs. The WNNs include Mexican Hat wavelet function (Fig. 1). Here fuzzy rules provide the influence of each WNN to the output of FWNN. The use of WNN with different dilation and translation values allows to capture different behaviors and essential features of the nonlinear model under these fuzzy rules. The proper fuzzy model that is described by IF–THEN rules can be obtained by learning dilation and translation parameters of conclusion parts and the parameters of membership function of premise parts. Here, because of the use of wavelets, the computational strength and generalization ability of FWNN is improved, and FWNN can describe the nonlinear processes with desired accuracy.
Mexican hat wavelet.

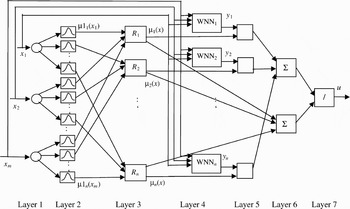
The structure of fuzzy wavelet system is given in Figure 2. The FWNN includes six layers. In the first layer, the number of nodes is equal to the number of input signals. These nodes are used for distributing input signals. In the second layer, each node corresponds to one linguistic term. For each input signal entering to the system, the membership degree to which input value belongs to a fuzzy set is calculated. To describe linguistic terms, the Gaussian membership function is used.

Here, m is number of input signals; n is number of fuzzy rules (hidden neurons in third layer); c ij and σij are center and width of the Gaussian membership functions, respectively; and μ1j(x i) is membership function of ith input variable for jth term.
Structure of fuzzy wavelet neural network.

In the third layer, the number of nodes corresponds to the number of rules R 1, R 2, … , R n. Each node represents one fuzzy rule. The AND (min) operation is used here to calculate the values of output signals of the layer.

where Π is the min operation.
These μj(x) signals are input signals for the next layer. This layer is a consequent layer. It includes n WNNs that are denoted by WNN1, WNN2, … , WNNn. In the fifth layer, the output signals of third layer are multiplied by the output signals of wavelet networks. The output of jth wavelet network is calculated as

Here, z ij = (x i − b ij)/a ij. Here, a ij and b ij are parameters of the wavelet function between ith (i = 1, … , n) input and jth (j = 1, … , m) WNN. In sixth and seventh layers defuzzification is made to calculate the output of whole network. In this layer the contribution of each WNN to the output of the FWNN is determined.
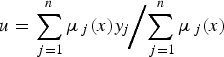
Here, y j are the output signals of WNNs. After calculating the output signal of the FWNN, the training of the network starts.
2.1. Learning using gradient descent
At the beginning, the parameters of FWNN are generated randomly. The parameters are the membership function of linguistic values in the second layer of the network and the parameters of the WNN. To generate a proper FWNN model, the training of the parameters has been carried out. Training includes the adjusting of the parameter values of the membership functions c ij(t) and σij(t) (i = 1, … , m, j = 1, … , n) in the premise part and parameter values of the WNNs w j(t), a ij(t), b ij(t) (i = 1, … , m, j = 1, … , n) in the consequent part. In this paper we applied gradient learning with an adaptive learning rate. The adaptive learning rate guarantees the convergence and speeds up the learning of the network. In addition, the momentum is used to speed up the learning processes.
At first, on the output of network, the value of cost function is calculated.
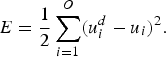
Here, O is the number of output signals of the network (in a given case O = 1), u id and u i are desired and current output values of the network, respectively. The parameters w j, a ij, b ij (i = 1, … , m, j = 1, … , n) of WNN and parameters of membership function c ij and σij (i = 1, … , m, j = 1, … , n) of neurofuzzy structure are adjusted using the following formulas.
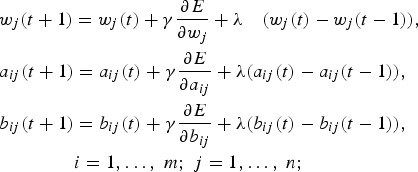

Here, γ is the learning rate, λ is the momentum, m is the number of input signals of the network (input neurons), and n is the number of fuzzy rules (hidden neurons).
The values of derivatives in Eq. (9) are computed using the following formulas.
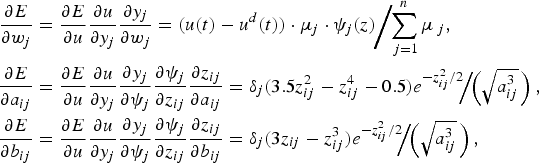
here

The derivatives in Eq. (10) are determined by the following formulas.
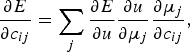
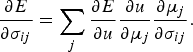
Here

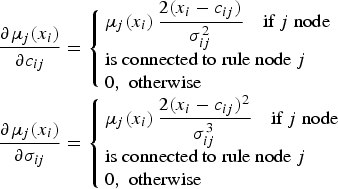
Using Eqs. (11)–(15), the derivatives in Eqs. (9) and (10) are calculated and the correction of the parameters of FWNN is carried out.
2.2. GA learning
Sometimes the network learning using the gradient method for nonlinear processes cannot guarantee an optimal solution. In practical applications, the gradient method might find the set of suboptimal weight from which it cannot escape. That is, sometimes the gradient method has “local minima” problem and could not find a global optimal solution. GAs are effective optimization techniques that can be used to improve training of the FWNN and avoid the local minima problem. GA is a directed random search method that exploits historical information to direct the search into the region of better performance within the search space (Goldberg, Reference Goldberg1998). In this paper, the real coded GA with gradient descent algorithm is applied for searching optimal values of the parameters of the FWNN.
During optimization, the number of chromosomes, which is defined as population size, is generated randomly. Chromosomes consist of genes and represent the network parameters. These parameters characterize the parameters of antecedent and consequent parts of the FWNN. The long chromosomes are used to represent all parameter values.
GA learning is applied to train the parameter values in chromosomes. GA learning is carried out by GA operators. The main operations in GA are selection, crossover, and mutation. The aim of the selection is to give more reproductive chance to population members (or solutions) that have higher fitness. The tournament selection is applied for selection of new generation. In this method, two members of the population are selected and their fitness values are compared. The member with high fitness is selected for the next generation.
Crossover and mutation are two main components in the reproduction process in which selected pairs mate to produce the next generation. The purpose of crossover and mutation is to give the next generation of solutions chance to differ from their parental solutions. Both components intend to give children chance to differ from their parents, and hope that some of the children can be closer to the optimal destination than their parents.
The real coded multipoint crossover operation is used for the correction of individuals. According to crossover rate, the individuals are selected for the crossover operation to generate a new solution. The high value of the crossover rate led to a quick generation of a new solution. The typical value of the crossover rate is selected in the interval [0.5, 1]. In crossover operation two parent members X = (x 1, x 2, … , x n) and Y = (y 1, y 2, … , y n) are selected. After crossover operation, the new members will have the form X′ = (x′1, x′2, … , x′n) and Y′ = (y′1, y′2, … , y′n). The crossover operation has been performed using the following formula.
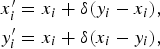
when F(X) > F(Y). Here, x i and y i are the ith genes of the parents X and Y, x′i and y′i are the ith genes of the parents X′ and Y′. The value δ is changed between 0 and 1.
The simple mutation operation is applied. In this operation, for each gene, a random number is generated. If this random number is less than the mutation rate, then the corresponding gene is selected for mutation. During mutation a small random number, taken from the interval [0, 1], is added to the selected gene to determine its new value. A large value of the mutation rate leads to a purely random search. The typical value of mutation rate is selected from the interval [0, 0.1].
3. SIMULATION OF TIME SERIES PREDICTION
3.1. Time series prediction
The FWNN structure and its learning algorithms are applied for modeling and predicting the future values of chaotic time series. As an example, the Mackey–Glass time series data set was taken. This is a benchmark problem in the areas of NN and fuzzy systems. This time series data set was created with the use of the following Mackey–Glass time-delay differential equation.

This time series is chaotic, and the trajectory is highly sensitive to initial conditions. To obtain the data set, the fourth-order Runge–Kutta method is applied to find a numerical solution to the above Mackey–Glass equation. Here we assume that x(0) = 1.2, τ = 17, and x(t) = 0 for t < 0. The task is to predict the values x(t + pr) from input vectors [x(t − 18) x(t − 12) x(t − 6) x(t)] for any value of the time t, where pr is the predicting step. The value of pr is assumed to be 6. Using statistical data obtained from Eq. (17), the learning of FWNN has been carried out. The learning is accomplished by using GA and the gradient descent algorithm. The gradient method has good learning speed, but it has a local minima problem. GA can find a global optimal solution, but it has low learning speed. During learning, at first step, the GA operators are applied for learning the network parameters. This process is continued up to given number of iterations. The learned values of parameters are saved in the file. Then using the gradient descent algorithm, the learning of the same parameter values is continued. The usage of such approach allows us to speed up learning process and finds a global optimal solution.
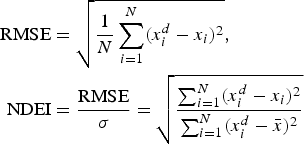
For comparative analysis, the obtained results are compared with existing online models applied to the same task. The 16 rules are used in the neurofuzzy part of the FWNN. As a performance criterion, the nondimensional error index (NDEI), which is defined as the root mean square error (RMSE) divided by the standard deviation of target series is used. NDEI is determined as
Here,
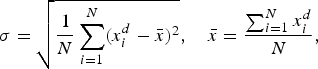
where x id and x i denote the desired output and model output, respectively, and  is the mean of target series.
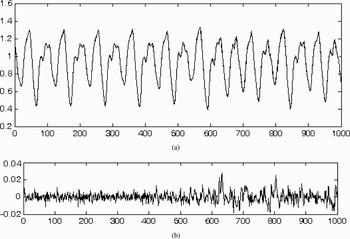
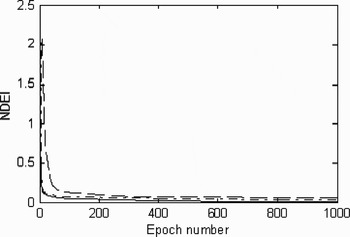
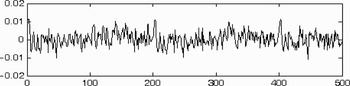
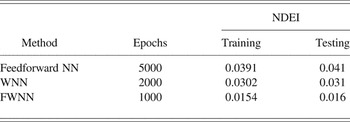
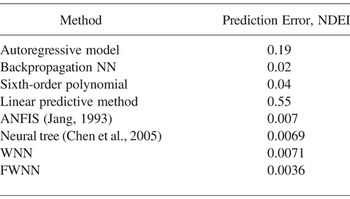
In the first experiment 1000 data points (t = 117–1118) are extracted from the time series and used as a learning data. The first 500 data points were used for learning, and the second 500 data points were used for testing. During learning, the values of RMSE and NDEI were 0.00345 and 0.015401, respectively. After learning, in the generalization step, RMSE = 0.0036 and NDEI = 0.016. In Figure 3a, the trajectories of desired and predicted values for both training and checking data for pr = 6 are shown. Here, the solid line indicates the trajectory of statistical data and the dashed line indicates the predicted value of time series. The difference between them is very small. These differences might only be seen in large scale. In Figure 3b, the prediction error is shown. For comparative analysis, the feedforward NN and WNN-based prediction models are developed. The result of the feedforward NN-based model is obtained when the number of hidden neurons was 60. The convergence graphic, describing the learning process of NN-, WNN-, and FWNN-based prediction models are given in Figure 4. The result of the WNN-based prediction model is obtained using 16 hidden neurons. Table 1 demonstrates the training and offline prediction results of feedforward NN-, WNN-, and FWNN-based models for Mackey–Glass time series. Comparisons of test results of different prediction models for Mackey–Glass time series are given in Table 2. In addition, using 58 fuzzy rules, the learning of FWNN has been performed. Figure 5 depicts the prediction error obtained for the test data from the FWNN model.
(a) The six-step ahead prediction for Mackey–Glass time series from t = 117–1118 and (b) prediction error. The first 500 data points are used for training and the second 500 for testing.

Convergence graphics. (- - -) NDEI of NN, (– · –) NDEI of WNN, and (—) NDEI of FWNN.

Prediction error.

Six-step ahead prediction results for Mackey–Glass time series

Comparisons of test results of different prediction models for Mackey–Glass time series

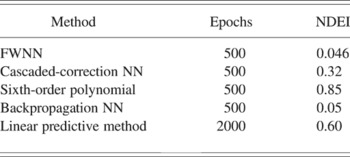
In the second experiment, using 58 fuzzy rules, the learning of FWNN for pr = 84 has been performed. The value of NDEI was 0.046. The increasing number of rules affects to the decreasing of the NDEI value. Table 3 demonstrates the offline prediction results of different models used for Mackay–Glass time series. In the table the results from second to fifth lines are from Crowder (Reference Crowder, Touretzky, Hinton and Sejnowski1990). As shown, the prediction error of the FWNN model is lower than those obtained from other models.
Prediction results comparisons

3.2. Modeling of electricity consumption
The FWNN system is applied for constructing a prediction model of electricity consumption in North Cyprus. Cyprus does not have petroleum and gas reserves and imports them from abroad. Energy is supplied by the KIB-TEK Company. Here the main goal is to meet customer demand. For planning utilities, it is needed to develop an electricity consumption model. The statistical data for the last 10 years were obtained from KIB-TEK. It was important to know in what volume of electricity would be used in the near future (after a few month), even an approximate value would be sufficient.
The FWNN structure and its learning algorithm is used to construct the prediction model. In the prediction problem, it is needed to predict the value of electricity consumption in the near future x(t + pr) on the base of sample data points {x(t − (D − 1)Δ), … , x(t − Δ), … , x(t)}. Here, pr is the prediction step. Five input data points [x(t − 12) x(t − 6) x(t − 5) x(t − 2) x(t)] are used as input to the prediction model. The output training data corresponds to x(t + 12). In other words, because the electricity consumption is considered monthly, the value that is to be predicted will be after pr = 12 months. The training input/output data for the prediction system will be a structure whose first component is the five dimension input vector, and the second component is the predicted output.
To start the training, the FWNN structure is generated. It includes five input and one output neurons. Sixteen hidden neurons (rules) are used in the hidden layer of the neurofuzzy part of FWNN. The second layer of the system includes a Gaussian membership function for each input signal. Eleven neurons are used in the conclusion part of the hidden layer of the WNN network. The initial values of the membership functions are generated equally spaced, and these values cover the whole input space. The training of the parameters was performed by using learning algorithms described in Section 2.
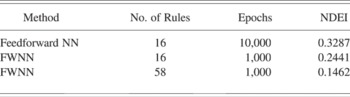
For training of the system, the statistical data describing monthly electricity consumption from January 1995 to December 2005 are considered. The data from January 2006 to December 2006 are used for diagnostic testing. All input and output data are scaled in the interval [0, 1]. The training is carried out for 1000 epochs. The values of the parameters of the FWNN system were determined at the conclusion of training. Once the FWNN has been successfully trained, it is then used for the prediction of the 2006 monthly electricity consumption. The training and test values of NDEI were 0.2288 and 0.2441 correspondingly.
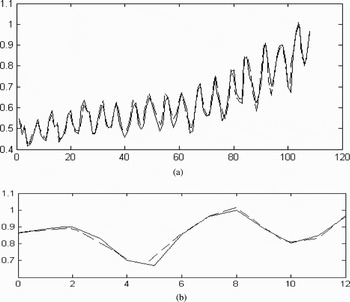
In Figure 6a, the output of the FWNN system for 12-step ahead prediction of electricity consumption for learning and generalization step is shown. Here the solid line is desired output, and the dashed line is the FWNN output. Figure 6b demonstrates the 12-step ahead prediction of FWNN.
The twelve-step ahead prediction. Plot of output signals: (dotted line) generated by FWNN and (solid line) predicted signal. (a) Curves describing learning and testing data together and (b) curves for testing data.

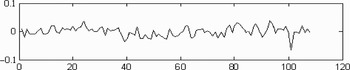
The plot of prediction error is shown in Figure 7. As shown in the figure, in the generalization step (end part of the error curve), the value of error increases. The result of the simulation of the FWNN prediction model is compared with the result of simulation of the feedforward NN-based prediction model. To estimate the performance of the neural and FWNN prediction systems, the NDEI values of errors between the predicted and current output signal are compared.
A plot of the prediction error.

Table 4 provides the comparative results of simulations. As shown in the table, the performance of FWNN prediction is better than the performance of the NN model.
Comparative results of simulation

The simulation results satisfy the efficiency of the application of FWNN technology in constructing a prediction model of electricity consumption.
4. CONCLUSION
The time series prediction model is developed by integrating fuzzy logic, neural networks, and wavelet technology. The wavelet networks are used to construct the fuzzy rules, and the functionality of the fuzzy system is realized by the neural network structure. The gradient and GAs are applied for optimization of the parameters in the premise and consequent parts of fuzzy rules in the FWNN structure. The structure and learning algorithms of the FWNN system is applied for modeling and prediction of complex time series. Simulation results demonstrated that the applied FWNN structure has better performance than other models. The developed FWNN structure is applied to develop a model for predicting future values of electricity consumption. This process is high order nonlinear. Using statistical data, the prediction model is constructed. The test results of the developed system are compared with these obtained from the feedforward NN-based system, and the first one has demonstrated better performance.
ACKNOWLEDGMENT
The author thanks the anonymous referees for their helpful suggestions in improving this manuscript.
Rahib Hidayat Abiyev has been an Associate Professor in the Department of Computer Engineering at Near East University, TRNC, Turkey, since 1999. He is Vice Chairman of the Computer Engineering Department and Director of the Applied Artificial Intelligence Laboratory at Near East University. He received his PhD degree in electrical and electronic engineering from Azerbaijan State Oil Academy (USSR) in 1997. He worked as a Research Assistant at the Industrial Intellectual Control Systems Laboratory. Dr. Abiyev's research interests are NNs, fuzzy systems, digital signal processing, control systems, optimization, GAs, and pattern recognition.