

Presidential power and national crises are inextricably linked. National emergencies call for decisive leadership, and no figure in the American political system is better positioned to deliver it than the president. It is no accident that presidents routinely lauded as the nation’s greatest—including Lincoln and Roosevelt—held office during the most extraordinary emergencies in American history. Major crises like wars and economic shocks are commonly recognized as catalysts for the accumulation of executive power and the institutionalization of the modern presidency. The links between crisis and executive power have gained particular salience in contemporary politics in the United States and around the world. Due to the potential for crises to provide “legitimate (and often popular) justification for concentrating power” (Levitsky and Ziblatt Reference Levitsky and Ziblatt2019), scholars expressed concern that the global coronavirus pandemic would be “a boon to governments with an autocratic bent” (Gebrekidan Reference Gebrekidan2020).
In this article, we study how crises affect public tolerance for executive power. During national emergencies, scholars argue that institutional constraints on executive authority recede. During major wars, for instance, legislatures are more deferential to presidents’ policy proposals (Howell, Jackman, and Rogowski Reference Howell, Jackman and Rogowski2013) and courts are more likely to uphold presidential actions (Howell and Ahmed Reference Howell and Ahmed2014). Likewise, international crises and domestic threats can increase approval ratings and other presidential evaluations (e.g., Brody Reference Brody1991; Huddy et al. Reference Huddy, Feldman, Taber and Lahav2005). While recent research examines the public response to presidential unilateral action vis-à-vis legislative initiatives (Christenson and Kriner Reference Christenson and Kriner2020), it is unclear whether the public is responsive to the means through which policies are enacted during major crises. Informed by beliefs about democratic ideals and constitutional values (e.g., McClosky Reference McClosky1964), Americans’ views of political procedures can affect evaluations of policies and the politicians who employ them (e.g., Doherty Reference Doherty2015). Yet public opinion scholarship documents citizens’ willingness to set aside beliefs in democratic values during periods of threat and crisis (e.g., Davis and Silver Reference Davis and Silver2004; Hetherington and Suhay Reference Hetherington and Suhay2011; Huddy et al. Reference Huddy, Feldman, Taber and Lahav2005). To the degree that the public is “the primary check on the unilateral executive” (Christenson and Kriner Reference Christenson and Kriner2020, 8), identifying whether and how citizens respond to the means of policy enactment during crises provides new evidence about their potential to reshape the politics of executive authority.
Yet crises are rare and studying their effects on American institutions is difficult. Conceptually, crisis is a classic example of a “black box” in the social sciences. Simple questions, like what constitutes a crisis, or what features of crises make them suitable for executive aggrandizement, are mostly unaddressed. In this case, the dearth of theoretical and empirical study presents two key problems. Scholarship has a tendency to (tautologically) define crises by their causal effects on institutions. Relatedly, if crises promote policy-making power, they also generate incentives for political actors to define—or even create—them. If we do not understand how crisis changes the political context around the exercise of executive power, we cannot know the potential limits on this self-aggrandizement.
We study these questions in the context of the coronavirus/COVID-19 pandemic that spread across the United States in 2020. The pandemic produced crises both public health and economic in nature, and it evoked comparisons to war and domestic terror attacks. Using a preregistered experiment embedded in a national survey of more than 8,000 U.S. adults, we evaluated whether Americans were more supportive of policy responses achieved through presidential action rather than through the legislative process. Subnational variation in the known spread of the virus and its economic effects, along with individual-level perception of the threat it posed, provides leverage for examining the relationship between executive power and crisis. If public tolerance for executive power is tied to the severity of a crisis, we would expect individuals in regions with greater exposure to the pandemic to evaluate executive authority differently from individuals with less exposure.
Across a range of analyses, our findings are consistently null and near zero. In the context of national crisis, we find that respondents evaluated policies no more and no less favorably when they were implemented by the president alone rather than by Congress. We also find no evidence that tolerance of executive unilateralism varied with the severity of the crisis at either the state or county level at the time the survey was fielded. Moreover, this tolerance was not moderated by an individual’s concern about their own personal health or by (mis)perceptions about the spread of the virus. Instead, we find that individuals’ partisan and ideological views were consistent and strong predictors of attitudes toward policy outcomes regardless of how they were achieved and across jurisdictions with varying levels of crisis severity. In times of crisis, citizens’ preferences for what government can do appear to outweigh how those measures are achieved.
Consistent with related research conducted in the aftermath of September 11 (Davis and Silver Reference Davis and Silver2004), we find relatively broad support for what in normal circumstances would be considered extreme or even extraconstitutional policy interventions. We find, for example, a majority of Americans were either supportive of or indifferent to suspending Congress or delaying the 2020 presidential election. Most importantly for our purposes, we find no evidence that respondents’ evaluations of these policies varied based on whether these interventions were imposed by the president alone or resulted from legislative action. Moreover, evaluations of executive authority did not vary with any observable measure linked to the severity of the pandemic. Even in areas that experienced the early stages of the COVID-19 pandemic most severely, our results indicate that the president appears to pay no public penalty for acting alone in a crisis. During the crisis context, the means by which policies were devised to address the pandemic appeared to have no effect on respondents’ evaluations of those policies.
In additional analyses, we show that partisan and ideological commitments were strongly predictive of attitudes toward policies to address the pandemic. Perhaps reflecting the nature of contemporary polarization, these commitments did not diminish in importance among respondents from areas that were experiencing the pandemic more acutely. In contrast with the received wisdom about crises and public opinion, therefore, we find that Americans did not set aside their partisan affiliations to “rally around the flag”—or the president. Instead, their partisan commitments and ideological beliefs structured their evaluations of pandemic-related policy proposals and limited their willingness to support policies endorsed by the other side of the aisle. It may also have limited the potential for individuals to endorse greater authority for political leaders who do not share their partisanship. In this way, contemporary polarization, for all its ills, may be a backstop against the potential for executive aggrandizement during crises. These results thus provide new evidence about the potential for crisis to increase mass public acceptance of executive ambitions.
Crises and Executive Power
National crises figure heavily into the development and deployment of presidential power. Presidents have regularly sought—and often received—greater authority for the purposes of addressing emergencies. Whether to fight wars abroad or ensure security at home, to tend to damage wrought by natural disasters or protect against pandemics, presidents have leveraged the “energy” of the unitary executive to enlarge their power and direct the activities of the federal government.
The history of the American presidency nearly converges on the view that national crises expand presidential power. Bryce (Reference Bryce[1888] 1995, 203), for instance, was generally unimpressed by the presidency, yet noted that “[The framers] so narrowed the sphere of the executive as to prevent it from leading the country … except indeed in a national crisis.” Wars, economic crises, and national security emergencies have bestowed upon presidents “unusual power” (Rossiter Reference Rossiter[1948] 2005, 219), “absolute power” (Bruff Reference Bruff2015, 298), and “a vast reservoir of indeterminate powers” (Corwin Reference Corwin1957, 261). Even presidents’ actions in “lesser crises,” such as presidents’ efforts to resolve railroad strikes, quell rebellions overseas, and address damage wrought by natural disasters, have “left their mark on the office” (Rossiter Reference Rossiter1956, 65). As Sturm (Reference Sturm1949, 139) summarizes this consensus, “Emergency has the inevitable tendency to enhance the prestige and influence of the presidential office.”
According to Corwin, Rossiter, and others, increased presidential power during crises results from the relaxation of constraints that limit expressions of executive authority during normal times. In times of emergency, for instance, Congress delegates greater policy-making authority to the president (Howell, Jackman, and Rogowski Reference Howell, Jackman and Rogowski2013) while the courts use a different mode of decision making (e.g., Epstein et al. Reference Epstein, Ho, King and Segal2005) which is often deferential to the president (Howell and Ahmed Reference Howell and Ahmed2014). Thus, scholarship on American institutions suggests that the separation of powers poses only weak institutional limits on executive aggrandizement during a crisis.
Public Support for Presidential Power during Crises
Crises may also increase public acceptance of presidential power. According to Levitsky and Ziblatt (Reference Levitsky and Ziblatt2019), during emergencies “[c]itizens are more likely to tolerate—and even support—authoritarian power grabs.” In fact, increases in presidential power during crises are attributed to public demand. In normal times, Neustadt (Reference Neustadt1960, 137) argued, public opposition prevents institutional reforms that shift power to the presidency, but crises such as “deep depression or unlimited war” create “popular demand for institutional adjustments likely to assist a President” (see also Sturm Reference Sturm1949, 139). During the Civil War, for example, “the American people … brushed aside their darling legalities [and] allowed the executive to exert novel powers” (Bryce Reference Bryce[1888] 1995, 263). Crisis power, Stebbins (Reference Stebbins1971, 21) succinctly asserted, “is a gift from the people.”
The empirical record offers some tentative support for these claims. First, Americans have supported extraordinary measures taken by presidents in previous crises. During World War II, for example, a plurality of the public supported Roosevelt’s order to intern Japanese Americans (Sturm Reference Sturm1949; Swift Reference Swift2016), and the high level of public support led Congress to pass legislation enforcing the directive with “nearly unanimous” agreement (Saldin Reference Saldin2004, 494). Second, a large literature on “rally effects” demonstrates that international crises are often associated with increases in presidential popularity, particularly in circumstances of elite consensus (e.g., Brody Reference Brody1991).
But anecdotes of public support for extraordinary measures and spikes in public approval cannot answer key questions about executive power during crises. Both facts shed no light on important counterfactuals. It is unclear, for instance, whether the public would have supported the internment of Japanese Americans outside of the context of World War II. That the public approves of an exercise of presidential power in a crisis setting is not informative about public opinion in a context not linked to a crisis. Moreover, had the Roosevelt administration sought congressional authorization prior to acting, would support for these measures have been greater? Addressing this question is critical because it dissociates increased support for government intervention in general with presidential power in particular.
Further, while rally events may boost a president’s approval rating, it is not clear this boost translates into increased tolerance of executive authority. Crises could have indirect effects on presidents’ success in implementing their agendas through Congress; for example, if crises increase a president’s approval rating, the bump in popularity may garner additional legislative support for the president’s policy initiatives (Rivers and Rose Reference Rivers and Rose1985). Likewise, other research argues that popularity creates the conditions for presidents to make greater use of unilateral authority (Christenson and Kriner Reference Christenson and Kriner2019), as other political actors are less willing to challenge the president. Yet still other research argues that a president’s success in implementing policies reflects the popularity of those policies rather than the popularity of the president (Canes-Wrone Reference Canes-Wrone2006). Thus it is not clear that increased policy influence results from greater deference to the president due to the crisis context or would instead reflect the same conditions present when a president’s approval ratings rise for reasons unrelated to a rally event.
Finally, existing evidence can say little about the endogeneity of crises. Policy makers, presidents, and the media regularly declare the existence of crises on a wide range of fronts; during the Trump administration alone, the New York Times discussed crises on immigration (Douthat Reference Douthat2019), opioids (Baker and Shear Reference Baker and Shear2017), climate (Erlanger Reference Erlanger2020), and television standards (Poniewozik Reference Poniewozik2019). Most evidence focuses on cases that self-evidently appear to be crises (e.g., world wars or severe economic depressions). Others define crisis events by observable markers like casualties. This leaves ambiguous what features of a crisis result in the theorized public reaction—as well as whether these features are fungible by an ambitious executive. The implicit causal mechanism, then, is that the public observes the scale of a crisis, as indexed through some (objective) indicator. This would seem to provide considerably less discretion to a politician looking to capitalize on crisis to augment their authority. If the public has some knowledge of the true scale of a crisis, “manufacturing” one would require active manipulation of these indicators—which may be more difficult in democratic regimes.
Recent studies of public support for presidential power suggest ways to address these limits. In general, researchers field survey experiments evaluating public attitudes toward executive authority, often in the context of unilateral powers. They find that the public holds lukewarm or negative views toward the exercise of unilateral power and often reacts negatively toward its use (Christenson and Kriner Reference Christenson and Kriner2020; Lowande and Gray Reference Lowande and Gray2017). Perhaps most relevant is research that compares public evaluations of presidents and policy outcomes based on whether presidents pursue legislative or unilateral means for accomplishing their objectives. Reeves and Rogowski (Reference Reeves and Rogowski2018) show that presidential candidates received lower evaluations when proposing to implement their platforms via unilateral action rather than by working with Congress, and Christenson and Kriner (Reference Christenson and Kriner2020) find that presidential approval ratings drop when members of Congress criticize the president for exercising unilateral power and seizing legislative prerogatives. While some evidence indicates that the public has more favorable attitudes about unilateral powers in the context of national security issues (Reeves and Rogowski Reference Reeves and Rogowski2016), these contexts were hypothetical in nature and not tied specifically to international crises (or any other kind). More generally, it is unclear whether public evaluations of presidential authority vary as the United States moves into and out of a crisis context.
Public opinion scholarship suggests some caution, however, in generalizing the effects of unilateral action from survey experiments administered in normal times to crisis scenarios. This research shows that the predictors of political attitudes in normal times may differ from those that structure public opinion in times of crisis. For example, crises can reduce citizens’ beliefs in democratic values and support for democratic institutions (e.g., Córdova and Seligson Reference Córdova and Seligson2010), which can lead, as (Hetherington and Suhay Reference Hetherington and Suhay2011, 547) show, “a wide range of Americans [to] potentially support antidemocratic policies” during times of national emergencies. Crises in earlier periods of U.S. history increased support for punitive policies (Sales Reference Sales1973) and for candidates perceived as “strong” leaders (McCann Reference McCann1997). More recently, perceptions of threat that followed the September 11 attacks made citizens “more reluctant defenders of constitutional rights” (Davis and Silver Reference Davis and Silver2004, 42) and increased support for “policies that limit[ed] civil liberties” (Huddy et al. Reference Huddy, Feldman, Taber and Lahav2005, 605). In the main, the insights from this public opinion scholarship are consistent with Corwin’s (Reference Corwin1957, 8) observation that during crises, “the principal canons of constitutional interpretation are … set aside.” To the extent Americans “set aside” their usual concerns about the exercise of unilateral power during national emergencies, the means by which policies to mitigate a crisis are fashioned may not affect how the public evaluates those policies. If procedural concerns take a back seat to more urgent and salient considerations in crisis contexts, penalties for unilateral action documented in existing scholarship may recede or vanish altogether.
While much of the scholarship discussed above assumes the existence of a link between emergencies and support for presidential power, no direct evidence allows us to evaluate this connection. More broadly, how the public responds to presidents’ use of power shapes the incentives for their elected representatives to endorse the president’s actions. Alternatively, if the legislature and the judiciary provide a more liberal interpretation of executive power during emergencies (Culp Reference Culp1933), the potential public response may be a source of constraint for executives. Finally, to the extent crises “are a time-tested means of subverting democracy” (Levitsky and Ziblatt Reference Levitsky and Ziblatt2019), the public’s evaluations of executive authority during crises may characterize the degree to which domestic audiences can serve as a safeguard against democratic backsliding.
Executive Power and COVID-19
We study claims about tolerance for executive power in the context of the coronavirus/COVID-19 crisis. The World Health Organization declared the coronavirus a “Public Health Emergency of International Concern” on January 30, 2020, indicating that its spread constituted an “extraordinary event” that was “unusual or unexpected” (World Health Organization 2008, 9, 12). It was declared a pandemic on March 11. President Donald Trump declared the COVID-19 outbreak a national emergency on March 13 and invoked the National Emergencies Act to mobilize additional federal resources (Trump Reference Trump2020).
The coronavirus crisis generated responses from all levels of government. Travel restrictions were implemented for foreign nationals coming from China and the European Union (Booth and Wong Reference Booth and Wong2020) and along the country’s borders. Tax-filing deadlines were pushed back by three months (Fox and Spagat Reference Fox and Spagat2020). President Trump delivered a rare Oval Office address on the crisis on the evening of March 11 and subsequently led near-daily briefings for several months on the issue. Congress passed a $2 trillion stimulus package in late March, nearly twice the size of the stimulus during the Great Recession in 2009, and followed up with additional measures (e.g., Tankersley Reference Tankersley2020). State and local governments issued stay-at-home orders, forced the closure of nonessential businesses, and required residents to wear face masks outside their homes (e.g., Tan Reference Tan2020). Unsurprisingly, coronavirus quickly seized the public’s attention. While fewer than 0.5% of Americans identified it as the country’s “most important problem” in February 2020, this figure increased sharply to 13% in March and 45% by April (Gallup Organization 2020).
In the United States, the pandemic and its economic consequences were compared to those of the nation’s previous experiences with war, domestic attacks, and the Great Depression. The surgeon general characterized the crisis as the country’s “Pearl Harbor” moment (see Stanley-Becker, Gregg, and Booth Reference Stanley-Becker, Gregg and Booth2020), and President Trump said that the coronavirus crisis is the “worst attack [the U.S. has] ever had … worse than Pearl Harbor … worse than the World Trade Center [attacks]” (Milbank Reference Milbank2020). Accordingly, Trump referred to himself as “a wartime president” and called for “shared sacrifices” to address the crisis (Oprysko and Luthi Reference Oprysko2020). While the coronavirus pandemic may be qualitatively different from previous wars and international crises, it evoked rhetoric and political responses similar in kind to other events that were associated with deference to presidential leadership.
The crisis also generated concern that executives may use it as justification for asserting unconstitutional powers. According to the New York Times (2020), “leaders across the globe are invoking executive powers and seizing virtually dictatorial authority with scant resistance.” In the United States, the Trump administration emphasized unilateralism in some of its announced policy responses. Testifying before Congress regarding the suspension of the April 15 tax-filing deadline, Secretary of the Treasury Steven Mnuchin put it bluntly: “We don’t need Congress” (Trempor Reference Trempor2020). As Weiner (Reference Weiner2020) forecast, “The political system that emerges from this pandemic is almost certain to concentrate more power … in the national government generally and in the president specifically.”
Several distinguishing characteristics about the context in which the pandemic occurred merit discussion. First, the outbreak occurred in a presidential election year and as Joe Biden became the presumptive Democratic nominee against the incumbent president. Political campaigns can activate and heighten partisan intensity (e.g., Sood and Iyengar Reference Sood and Iyengar2016), and the degree of politicization could limit the opportunity for emergencies to affect views of presidential power. Second, President Trump endorsed a distinctive style of presidential leadership and often centralized national decision making in the White House. Third, as we describe below, our study was conducted near the beginning of the pandemic in the United States, when public uncertainty about its potential seriousness and duration may have been especially high. Fourth, the media environment was considerably more fragmented and polarized during the pandemic than it was during previous emergencies, such as World War II.Footnote 1 Each of these characteristics marks important departures with the contexts in which other national emergencies occurred and suggests caution in generalizing the results from this study to other contexts.
Evaluating public tolerance for executive power in the context of the coronavirus crisis improves upon designs used in existing empirical research. First, most evidence on rally effects comes from time-series studies of presidential approval ratings that compare variation in public support before, during, and after a crisis event (e.g., Brody Reference Brody1991). Yet this approach confounds the effects of a crisis event with all of the other actions presidents take that are specific to crises themselves. For instance, to the degree that presidents make more public addresses, appear more frequently on the news, and announce different kinds of policies during crises than they would in the absence of one, these studies have difficulty isolating the effect of the crisis context from other political factors that accompany crises and could be related to presidential evaluations. By surveying the public about policy responses to COVID-19 weeks into the crisis, we can be more confident in our ability to isolate the effects of the crisis itself.
Second, by adopting the approach of research on public support for unilateralism, we distinguish public tolerance for executive power from generic evaluations of government responses to crisis. We do this by randomly assigning respondents to evaluate policy proposals developed in the context of the pandemic and described either as implemented by the president or through regular legislative processes. Outside of crisis scenarios and national security issues, evidence suggests that presidents tend to pay a public penalty for acting unilaterally (Lowande and Gray Reference Lowande and Gray2017; Reeves and Rogowski Reference Reeves and RogowskiForthcoming). Accordingly, we apply this expectation in the context of the pandemic:
Unilateralism penalty. The public will be less supportive of policy proposals if they are implemented by the president through executive order, relative to congressional legislation.
The unilateralism penalty hypothesis posits that the public is less supportive of policies achieved through unilateral action relative to the legislative process. However, as we discussed above, previous research studied reactions to unilateral power during “normal times,” in the absence of major crises. To the extent crises exalt presidential power by increasing public demand for executive action, however, a strong version of the crisis literature may propose that the public evaluates policies more favorably in a crisis context when they are achieved through executive rather than legislative action. Accordingly, we test the following hypothesis:
Crisis aggrandizement. The public will be more supportive of policy proposals if they are implemented by the president through executive order, relative to congressional legislation.
The difference between the unilateralism penalty and crisis aggrandizement hypotheses is subtle and reflects the different bodies of research from which they originate. For both, however, the alternative (null) hypothesis is that there is no difference in the public’s policy evaluations based on how the policies were implemented. Failing to reject the null hypothesis in both cases would provide support for a third potential alternative, which is that while crises may free presidents from the public penalties typically associated with unilateralism, they also do not produce a fundamental reconsideration of the separation of powers system among the public. Instead, as the public opinion scholarship noted above suggests, the basic fact of crisis may be sufficient to reduce the salience of the means by which policies are implemented. While the implication would be that presidents in such circumstances have a freer hand in how they exercise power, this would reflect a reweighting of considerations among the public rather than a shift in acceptance of unilateral power.
Finally, we leverage geographic variation in the spread of the virus to study the (implicit) mechanism that is proposed to increase public tolerance. Unlike major wars, the onset of the coronavirus crisis was not evenly distributed across the United States.Footnote 2 Instead, the depth of the crisis varied geographically as the virus and its economic effects spread around the country. Unlike international crises, then, the geographic variation in the magnitude of the crisis allows us to study potential variation in public tolerance for executive power. If public opinion is indexed to some measure of crisis severity, this would confirm threshold-based definitions of crises implicit in research on rally effects and the findings from research that documents the importance of local context on political attitudes (e.g., Kriner and Shen Reference Kriner and Shen2012; Vavreck and Warshaw Reference Vavreck and Christopher2020). This motivates two related expectations:
Crisis severity. In areas more severely affected by the pandemic, the public will be more supportive of policies to address it.
Conditional aggrandizement. The unilateralism penalty will be lower in areas more severely affected by the pandemic.
We test these expectations against the null hypothesis of no difference in policy support between the unilateral and legislative conditions. In our setting, null effects could arise for several reasons. First, the early stages of the pandemic (when our study was conducted) were not accompanied by elite consensus about the threat it posed and how it should be addressed. Absent this elite consensus, the public may not endorse presidential power to a greater degree than legisislative action (e.g., Brody Reference Brody1991). Second, the pandemic may not have met the conditions that augment presidential power in national emergencies. While the pandemic may have seized public attention, as noted above, it was not accompanied by widespread expressions of patriotism nor was it perceived as an imminent threat to the country, both of which contributed to presidential deference during major wars (Howell, Jackman, and Rogowski Reference Howell, Jackman and Rogowski2013, 75). These factors may have limited the opportunity for the pandemic to increase public tolerance of presidential power.
Research Design
We tested the hypotheses described above with a survey experiment conducted several weeks into the issuance of state-level “stay-at-home” orders related to the pandemic. The study design was preregistered with the Open Science Framework (OSF) prior to the analysis of data (https://osf.io/fc7sq). We note explicitly whether and when the analysis below departs from this preregistration.Footnote 3
The survey was administered online on March 30, 2020, to over 8,000 respondents. Respondents were recruited by Lucid, which used quota sampling to produce a sample that approximates the U.S. adult population with respect to gender, age, race and ethnicity, and Census region.Footnote 4 Full demographic information about the sample is shown in Table A1. Coppock and McClellan (Reference Coppock and McClellan2019) favorably evaluates the use of Lucid as a vendor for social scientific surveys and the platform is widely used in political science research. We included several survey questions to gauge the quality and reliability of this online workforce, including approval of President Trump generally along with questions about approval over responses to the pandemic by the President, Congress, state government, and local government. Findings related to these questions can be compared with those of other vendors and survey firms who were routinely polling the same questions at the time of our survey. Our descriptive findings closely track those of national survey research firms conducted around the same time.Footnote 5 Second, we included an attention check to determine whether the respondent could immediately recall the treatment.
We include in our analyses respondents who completed the survey within a reasonable time frame. These protocols are described in the preregistration document for this study. We limited the results to respondents whose time to completion was between two and 15 minutes. Though these cutoffs are somewhat arbitrary, these thresholds are associated with the likelihood of correctly answering the attention check question. We estimated the marginal effect of each respondent and response characteristic on the likelihood of a correct answer to the attention check question. Each threshold was associated with a substantively significant reduction in the probability of a correct answer (see Table B3). In general, respondents taking very little time likely did not read the survey—and those taking an inordinate amount of time may have simply been distracted and left their browser window open. However, our results are robust to alternative specifications of the “attentive” respondents as well as when including all respondents who completed the survey.
Adopting the general approach from recent research on public support for presidential power, we asked respondents about their support for a series of policies while randomly assigning the way in which that policy is proposed or implemented. The policies in our study were described either as enacted by Congress and signed into law by the President or enacted by the President via executive order. The difference between the executive order condition and the legislation condition is our measure of public tolerance of unilateralism, where decreased support in the executive order condition characterizes the public penalty when presidents go it alone. These conditions were implemented in our survey with the following descriptions: either “President Trump and Republicans in Congress passed a law” or “President Trump signed an executive order.”
A key challenge in measuring public opinion for executive unilateralism is that differences in support for the process used to enact policy are influenced by views of the political actors involved. Past research on public support for unilateralism addresses this issue in several ways. First, scholars have referenced real presidents and Congresses, then estimated regression models that include indicators for treatment conditions and controls for presidential approval. Second, scholars have sanitized the wording of survey vignettes to avoid mentioning any particular president or Congress. While each of these approaches seems appropriate in the studies in which they were used, we adopt something closer to the first approach. At the time our study was fielded, government responses to COVID-19 were a singular focus of public attention. With the dramatic slow-down in economic activity, the frequent changes in public health responses, and the elimination of sports-based entertainment, consumption of news was, by some measures, at an all-time high (SSRS 2020). This, in our view, meant that any mention of a hypothetical or unnamed president or candidate proposing policies related to the pandemic would inevitably be tied by respondents to President Trump or former Vice President Joe Biden (who had recently become the presumptive Democratic nominee for the 2020 presidential election).
Our legislative attribution statement departs slightly from prior work by specifically mentioning the president and presidential copartisans in Congress. The alternative, of course, is to simply indicate that the policy had been enacted by Congress. We decided against this wording for several reasons. With a Republican majority in the Senate and Democratic majority in the House of Representatives, generic descriptions of consent from Congress signals some degree of Democratic support for the proposal. Moreover, the ambiguity in the statement leaves respondents to bring their own assumptions about attribution, which we do not observe. Instead, both conditions mention the President and both conditions prime Republican consent. They differ only in their description of process. This effectively dissociates tolerance for executive unilateralism from signals about copartisan support.
Simple randomization was used to assign treatment conditions. As Figure B1 and Table B2 indicate, the study arms are balanced across all relevant observables. Most importantly, the distributions of confirmed case counts across executive order and legislation conditions were not distinguishable (based on a Kolmogorov–Smirnov test: 0.02,
 $ p=0.19 $
).
We adopted a battery of 11 policy proposals that were applicable to the pandemic and in public discussion at the time our study was fielded. The range of policies helps ensure that our results are not driven by any specific proposal. Table 1 reports the descriptions of each policy that were presented to respondents. Responses to each individual item are descriptively informative in their own right, but the complete set of policy items was selected with several considerations in mind. First, none of our items had been enacted when the survey was fielded. We thus avoided asking respondents their views on policies that had already been implemented, and we did not deceive respondents by providing incorrect information about the means by which policies had been enacted. Second, we attempted to select proposals that varied in their baseline level of public support. This helps ensure that our conclusions are not an artifact of floor or ceiling effects due to policies with very high or very low levels of support. Therefore, we conducted a cursory review of related, policy-specific polls in an effort to choose policies with varying levels of support. Finally, the policies we included either had been explicitly proposed by a public official before the survey was conducted or were publicly discussed after the survey had concluded.Footnote 6
COVID-19 Policy Questions
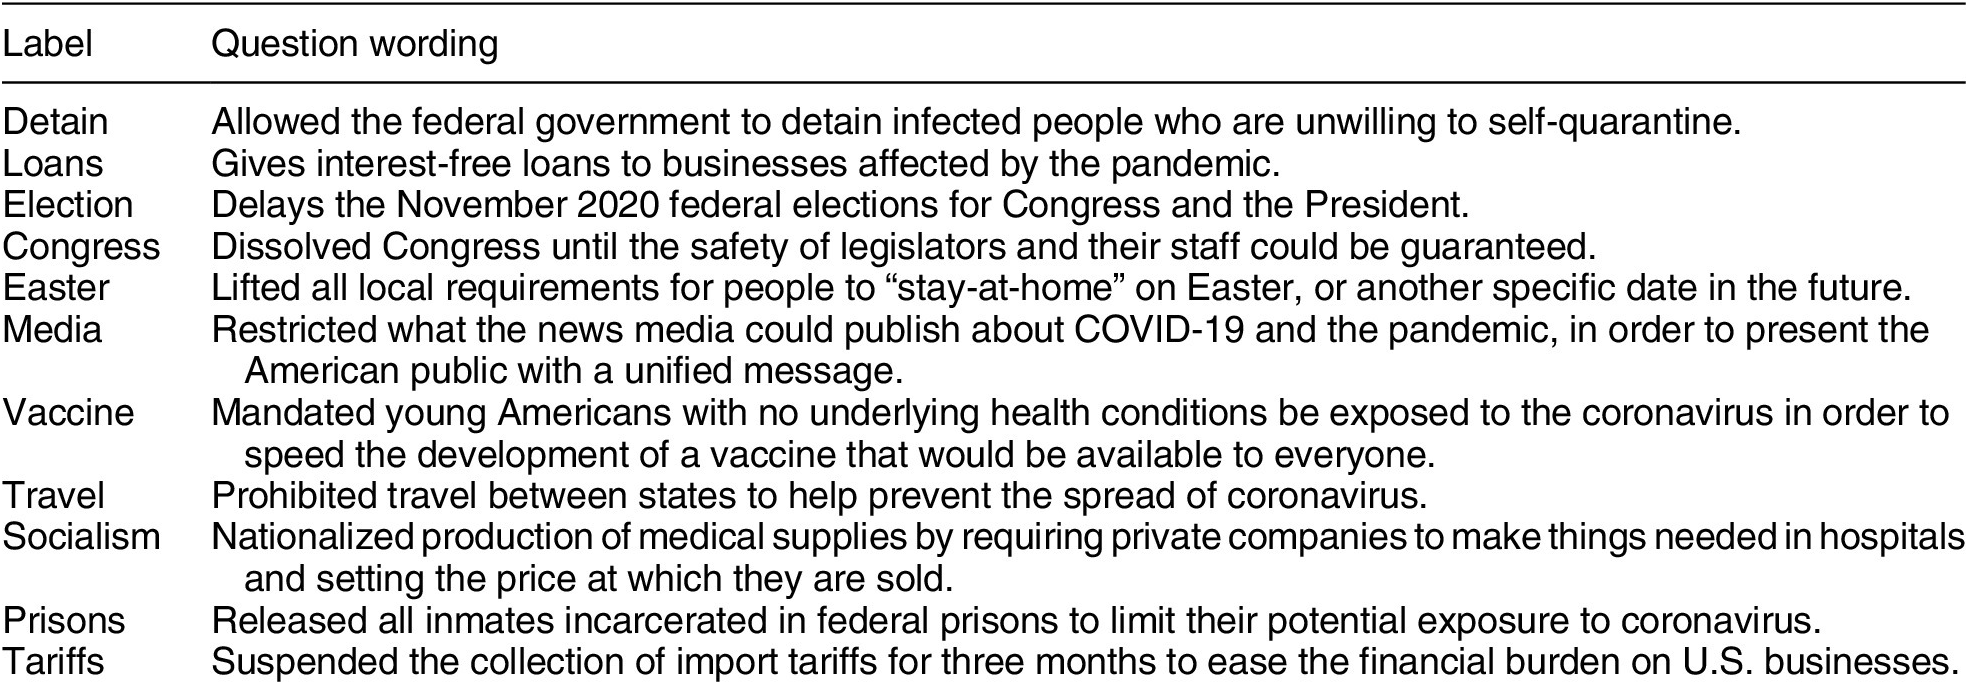
Table 2 reports descriptive patterns of support for each of the 11 policy proposals. Overwhelming majorities favored detaining infected persons, forgivable loans to businesses, restrictions on interstate travel, suspension of import duties, price controls, and the nationalization of private enterprise. Perhaps more interestingly, substantial numbers of respondents supported measures that are typically considered “illiberal” or indicative of democratic backsliding. For example, a majority of respondents were either supportive of or indifferent to suspending Congress and delaying the 2020 presidential election—with around a third of respondents expressly supporting these policies. While we lack the data to compare support for these measures with what we would observe absent the pandemic, the high levels of support for these proposals are consistent with expert ratings of democracy in the U.S., which show general decline over the contemporary period (e.g., BrightLineWatch 2020).
Support for COVID-19 Policies

Note: Entries are the percentages of respondents indicating each response option.
These descriptive findings suggest the pandemic case is comparable to existing evidence related to executive power in crises. That is, policy proposals like these do not receive the broad-based public support shown in this opinion survey outside of crisis context. Public evaluations of government owning the means of production (as described in the “Socialism” item), for example, consistently show U.S. majority opposition. This evidence suggests that though the findings uncovered in this survey dealt specifically with a unique and unprecedented public health emergency, public opinion seems to have responded to it in ways similar to those documented in wartime.
Measuring Crisis Severity
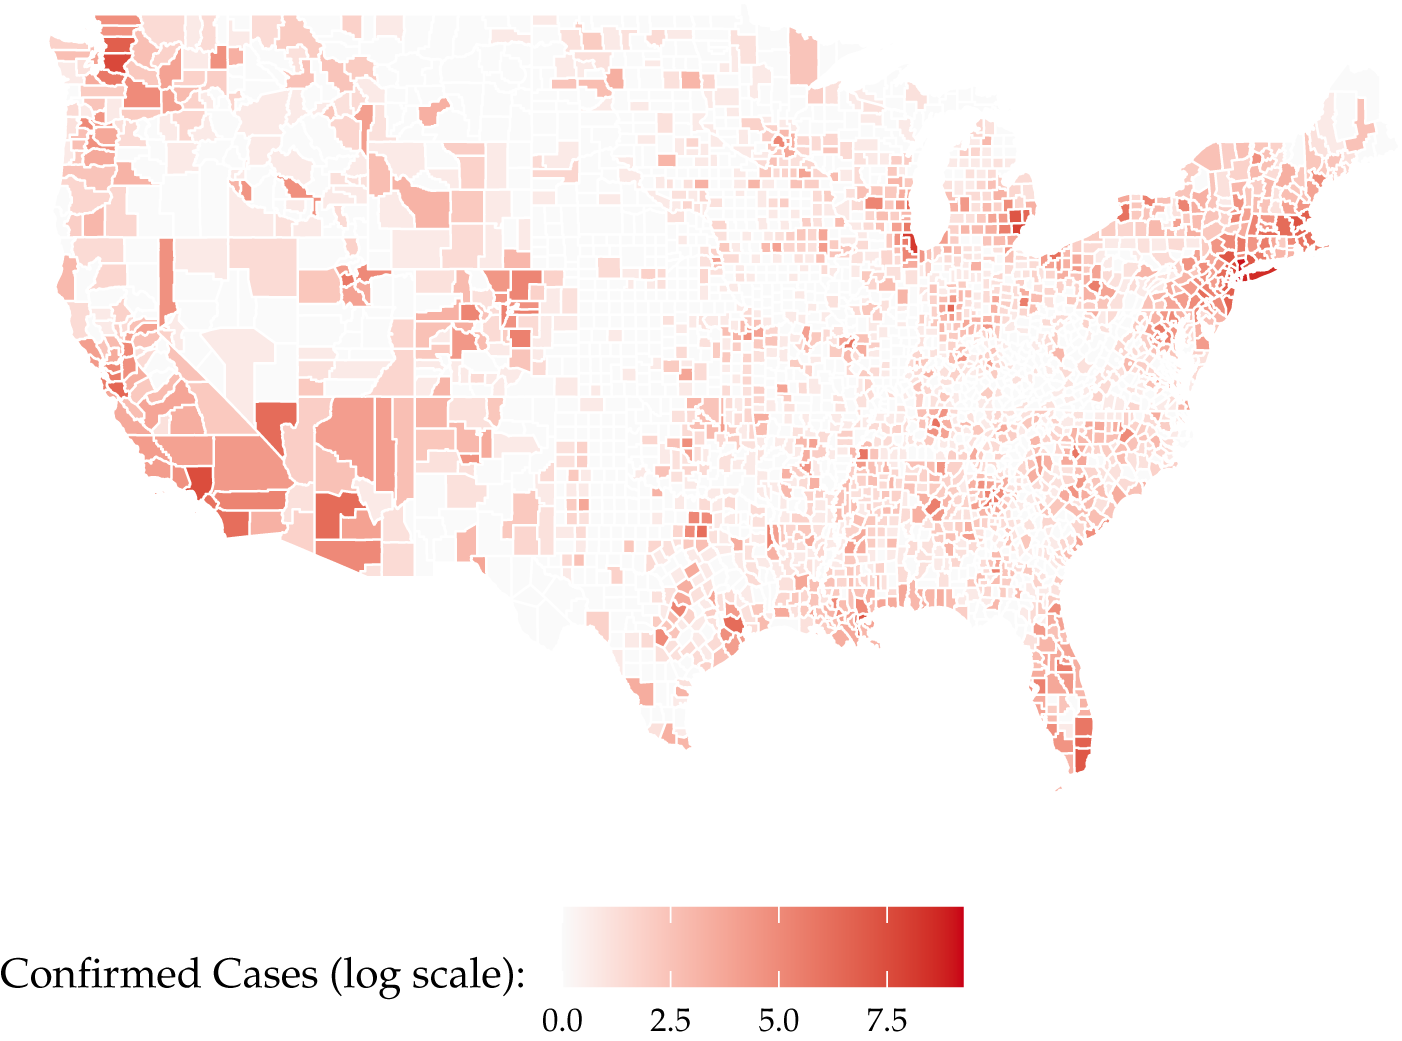
Investigating how crisis affects tolerance for unilateralism requires some measure of crisis severity. In the case of the pandemic, the most obvious is known spread of the disease. We used county-level counts of confirmed cases as of March 29, the day prior to the survey. There were around 100,000 confirmed cases in the U.S. at the time of the survey. We plot log-transformed, county-level confirmed cases as of this date in Figure 1. This provides initial tests of the crisis severity and conditional aggrandizement hypotheses. However, there are alternative measures of crisis severity that provide additional information about how the local pandemic context moderated the public’s response to executive power. These measures were not included in the preregistration of this study and should be treated as exploratory. As we discuss, however, it is ultimately instructive that the results are consistent across each measure. Therefore, we also use data on confirmed deaths, which may be a more reliable indicator of severity due to geographic variation in the availability of testing. Most importantly, case counts and deaths were widely reported and available for public consumption in the news.
Moderator: County-Level Confirmed Cases of COVID-19
Note: Source: https://github.com/CSSEGISandData (accessed April 13, 2020). Plots county-level confirmed cases (log scale) as of the end of day, March 29, 2020.
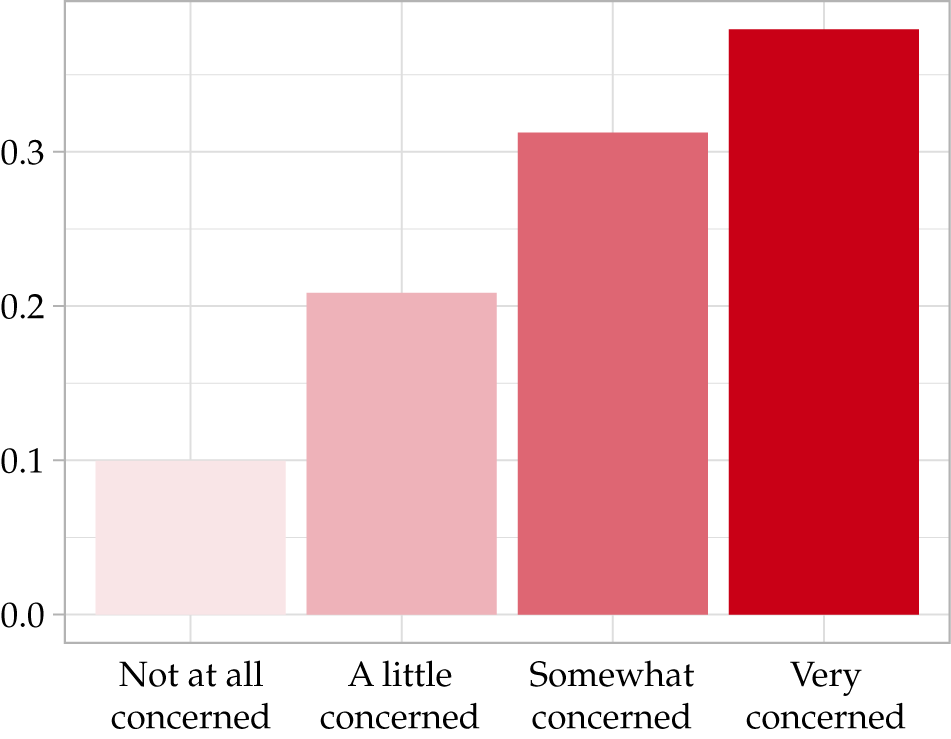
Each of these measures might be considered an objective characterization of the severity of the crisis based on where individuals live. But they also introduce measurement error because they assume county-level crisis severity affects individual-level evaluations. Moreover, at the time of fielding, there was some preliminary evidence that respondent evaluations of the crisis may be associated with political attitudes (Gadarian, Goodman, and Pepinsky Reference Gadarian, Goodman and Pepinsky2020). Therefore, we supplemented data on county-level cases and deaths with respondents’ perceptions of crisis severity. We approached this measurement task in two ways. First, we informed respondents that “people with underlying health conditions like diabetes, obesity, emphysema, and other respiratory problems are particularly likely to develop health complications from COVID-19,” and asked them how concerned they were about their personal health. We plot responses to this question, summarized by state, in Figure 2. This measure is mostly orthogonal to county-level cases (
 $ r=0.06 $
, CI = [0.04, 0.08]). Finally, the COVID-19 pandemic was not only a public health crisis; it also produced an economic crisis because stay-at-home orders kept workers at home and prevented businesses from operating. In additional analyses described below, therefore, we also leverage data on local unemployment rates and unemployment claims to characterize crisis severity.
Moderator: Individual-Level Level of Concern about Personal Health
Note: “How concerned are you about your personal health?” Reports the proportion of respondents who selected each response.
For simplicity, we create a binary measure that indicates whether respondents supported each of the 11 policies described above. Using these measures, we estimate a series of logistic regressions where the primary independent variable is an indicator for assignment to the unilateral condition. We also include a series of covariate controls, including income, age, party, race, gender, and education,Footnote 7 along with logged county-level cases (plus one). As we describe below, however, our results are robust to a range of alternative modeling strategies and characterizations of the dependent variables.
Finally, we note that attitudes toward the pandemic policy responses included in our study likely were affected by a variety of political factors. As mentioned above, we estimate models that account for respondent partisanship and ideology, which may be associated with preferences for the scope of federal intervention. Because much of the pandemic response was led by state government (Fowler, Kettler, and Witt Reference Fowler, Kettler and Witt2021), we also estimate models with state fixed effects to account for potential variation in policy preferences across states. Individuals’ preferences for pandemic policy responses could also reflect differences in media exposure (e.g., Levendusky Reference Levendusky2013), as the volume and nature of pandemic-related news varied by media outlet and contributed to variation in viewers’ (mis)information about the pandemic (Druckman et al. Reference Druckman, Ognyanova, Baum, Lazer, Perlis, Della Volpe and Santillana2020; Motta, Stecula, and Farhart Reference Motta, Stecula and Farhart2020; Pickup, Stecula, and van der Linden Reference Pickup, Stecula and van der Linden2020). Therefore, we also examine treatment effects conditional on misperception of cases, which might be attributable to this news environment. While each of these factors may affect how respondents evaluate the policies in our study, random assignment of our treatment conditions ensures that our estimates of the average treatment effects are not confounded by these characteristics (or any others). As we discuss below, however, we estimate additional models to explore whether these characteristics moderate the effect of our treatment.
Results
Overall, we find that while support varied substantially across each of the policy proposals, we find no evidence in support of the unilateralism penalty hypothesis. Estimates of the difference in evaluations of policy as implemented by the president alone or the president and Congress are near zero and allow us to reject even substantively small effects. We also find no support for the conditional aggrandizement hypothesis, as evaluations of executive power were not moderated by local crisis severity. These findings are robust to numerous estimation strategies, consistent across various objective and subjective indicators of the pandemic, and consistent across 11 policy interventions included in the survey.
Public Support for Policy Responses and Unilateralism
Figure 3 shows the treatment effect of unilateralism on public support for each of the policy proposals described above. The results shown in Figure 3 are simulated from the logistic regressions described above. The figure plots the estimated difference in the probability of support among respondents assigned to the unilateralism condition and the legislative condition. The dependent variables are shown on the y-axis.
Presidential Power and Policy Support
Note: Plots the estimated differences in support for each policy between respondents in the unilateral and legislative conditions. Positive values along the x-axis indicate greater support for proposals that are implemented via unilateral power rather than by legislative action. Policy labels found in Table 1. Values simulated from logistic regressions, with level of concern for personal health, treatment condition, income, age, party, race, gender, and education as covariates. The vertical dashed line indicates the null hypothesis of no difference in policy support based on how the policy was implemented. The horizontal lines indicate the 95% confidence intervals associated with the differences in support.

The results in Figure 3 provide little evidence that the means through which pandemic-related policies were fashioned affected public evaluations of those policy proposals.Footnote 8 First, the treatment effects are inconsistently signed. Public support was higher among respondents in the unilateralism condition for eight of the policy proposals (Tariffs, Media, Congress, Socialism, Travel, Easter, Loans, and Detain) but was lower among respondents in the unilateral condition for the remaining three (Prisons, Vaccine, and Election). Second, the treatment effects are all extremely small in magnitude. The largest treatment effect was a 5-percentage-point increase for the Socialism dependent variable. The point estimates are even smaller in magnitude for the other dependent variables and typically allow us to reject very small effect sizes. Third, even with our large sample size, only the treatment effects for Socialism and Prisons are statistically distinguishable from zero at conventional levels.Footnote 9 At the time of the survey, there was bipartisan, elite consensus that the president should invoke executive powers to increase the production of medical supplies and equipment. Thus, it is notable that this consensus is associated with the lone exception among treatment effects near zero.
The results shown in Figure 3 are robust across a number of alternative statistical models and specifications. First, we estimated linear probability models rather than logistic regressions.Footnote 10 Second, we used the full five-point scale for the dependent variables to estimate linear and ordered probit regressions.Footnote 11 Third, because the pandemic severity and response varied significantly across geographic locations, we estimated models that included state fixed effects. In this specification, the treatment effects of unilateralism are estimated by comparing respondents on the basis of treatment assignment who live in the same state.Footnote 12 In each, we find little evidence to support the unilateralism penalty hypothesis.
Finally, in additional analyses we find no evidence that partisanship moderates any potential unilateralism penalty. That is, the null aggregate effects could mask asymmetries across parties, where Republican identifiers (copartisans of the president) react positively to unilateral action while Democratic identifiers react negatively. Figure D1 shows the effects of the unilateral treatment by partisan identification. Treatment estimates are relatively stable across party. Respondents who identify as Democrats, for example, are not less supportive of a policy because it is enacted by a Republican president via executive order. Not surprisingly, this result is robust to examining variation across those who do and do not approve of the president. We report these conditional effects in Figure D2. Of course, our experiment was partly designed to achieve this result—as, to avoid confounding partisan priming with executive action, both treatment conditions mention the president. These results also provide no evidence that the president’s copartisans were more supportive of unilateralism relative to legislation than members of the opposite party.
Overall, the results in Figure 3 suggest two potential interpretations. One, they could indicate broad-based public tolerance for executive power in a crisis context. While previous research identified public disapproval of hypothetical policies implemented via unilateral power outside of a crisis scenario, our results could indicate that these objections recede as Americans’ principled opposition to executive power gives way as circumstances demand more energetic executive leadership. Two, our results could indicate that process-based concerns simply are not salient with the public in a time of crisis. While in normal times Americans may weigh policies based in on part on how they are fashioned and implemented, the urgency of the moment could take precedence over Americans’ preferences for regular order. While our survey does not permit us to distinguish empirically between these possibilities, our results make clear that public does not prefer executive policy making over legislation in a crisis context. These findings weigh against the crisis aggrandizement hypothesis, however, in which crises increase the public’s willingness to support executive authority at the expense of the legislative power.
Local Context, Crisis Severity, and Policy Support
Though the public is not less supportive of policy enacted by the president alone, their support for policy in general is somewhat conditional on the severity of the crisis. Following the results in the previous section, we again created binary indicators for support of each policy proposal, distinguishing respondents who “strongly” or “somewhat” supported each proposal. We predicted these dependent variables using our measures of crisis severity, along with a vector of pretreatment covariate controls including partisanship, age, gender, education, race, and income. Using the estimates from these models, we generated predicted probabilities of policy support at various levels of crisis severity.
We plot predicted support by county-level cases and individual-level concern for personal health in Figures 4 and 5, respectively. For postponing the election, reopening by Easter, infecting young people for the purposes of vaccine development, releasing prisoners, and suspending tariffs, moving from a county with no cases to a county with hundreds is associated with a 1–3-percentage-point increase in the probability of support. The differences across levels in self-reported concern for one’s health are more striking. Health concerns are associated with support for the majority of policy interventions. Moreover, for several—including travel restrictions, releasing prisoners, suspending Congress, and delaying the election—those who report they are “very concerned” are about 15 percentage points more likely to support the policy, relative to those who said they were “not concerned.” We interpret this as moderate support for the crisis severity hypothesis.
Support for Policy Interventions Sometimes Associated with Local-Level Case Severity
Note: Plots the predicted probability of support by policy intervention. Values simulated from logistic regressions, with log-transformed county-level cases (as of March 29), treatment condition, income, age, party, race, gender, and education as covariates. For Election, Easter, Vaccine, Prisons, and Tariffs, the association of cases and support is statistically distinguishable from zero by convention.
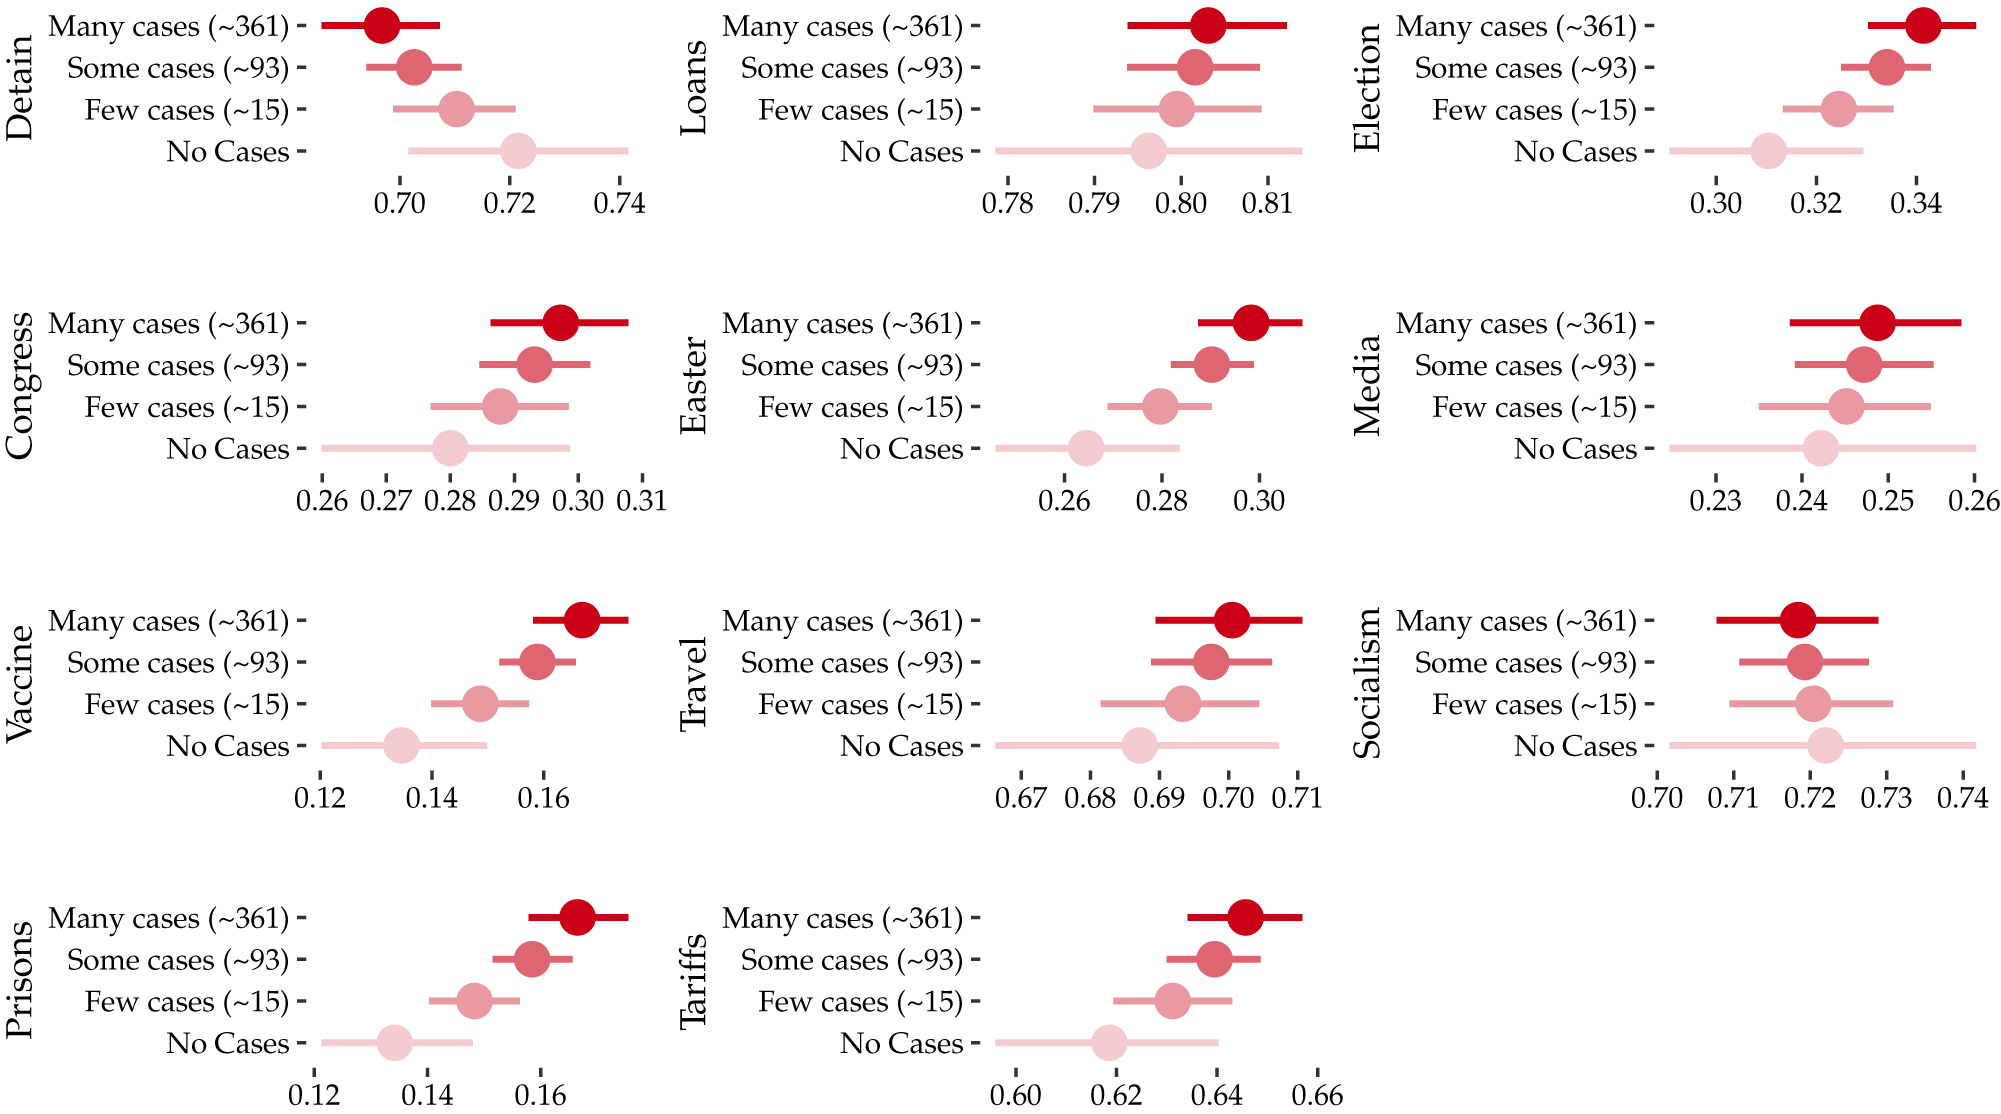
Support for Policy Interventions Often Associated with Individual-Level Concern for Personal Health
Note: Plots the predicted probability of support by policy intervention. Values simulated from logistic regressions, with level of concern for personal health, treatment condition, income, age, party, race, gender, and education as covariates. For Detain, Election, Congress, Vaccine, Travel, Socialism, and Prisons, support among individuals who report they are “very concerned” is statistically distinguishable by convention from those who are “not at all concerned.”

Does Crisis Severity Moderate Evaluations of Unilateral Power?
Using these indicators of crisis severity, we now test the conditional crisis aggrandizement hypothesis, which predicts that individuals living in regions where the crisis is more intense will be more supportive of unilateral power. That is, while the country as a whole was experiencing the pandemic, some regions of the country were under greater duress than others at the time our study was conducted. Therefore, if more severe crisis experiences are associated with greater tolerance of unilateral power, we expect to find evidence that respondents in places with greater crisis severity were more supportive of policies implemented via executive order.
We test this hypothesis by examining how crisis severity moderated the effect of the unilateral action treatment. We used six measures of crisis severity: COVID-19 deaths at the county level and state level, COVID-19 cases at the county level and state level, the measure of respondents’ self-reported concern about their personal health, and finally, county unemployment. Death and case statistics were as of March 29, and we used the logged (plus one) values of each. Concern about personal health, as noted above, was measured on a four-point scale where larger values indicated greater personal concern. We estimated logistic regressions of the binary measures of support on the indicator for assignment to the unilateral action and its interaction with each of the measures of crisis severity. Unemployment statistics reflected the change in unemployment between February 2020 and March 2020, where positive values indicated counties with increases in unemployment rates over the previous month. Though COVID-19 was a public health threat, it also created economic dislocation, and places that suffered larger increases in unemployment despite minimal caseloads may have felt the crisis similarly as places where cases and/or deaths were more concentrated. Positive coefficients for the interaction term would provide support for the conditional aggrandizement hypothesis.
Because these different measures of crisis severity point to the same substantive conclusion, we present each of the 66 coefficients for the interaction term in Table 3. Each row shows the results for the interaction term associated with each dependent variable. The columns correspond to the six different indicators of crisis severity. Though support for policy interventions appear to be affected by the severity of the crisis, Table 3 provides little evidence that tolerance for executive power is moderated by the severity of the crisis. As Table 3 shows, there is no consistent trend for or against tolerance. Nearly two thirds (41 of 66) of the coefficients are negatively signed, opposite the direction predicted by the conditional crisis aggrandizement hypothesis. Moreover, most of the coefficients are small and near zero, allowing us to reject effect sizes very small in magnitude. Notably, our statistical tests are not corrected either for state- or county-level clustering or for multiple comparisons, both of which are likely appropriate. These corrections would further decrease our ability to reject the null hypothesis. Only two of the coefficients are positive and statistically distinguishable from zero, and both are based on the interaction of the unilateral treatment with respondents’ concern about their personal health. In no instances, however, do we find any evidence that objective measures of crisis severity increase respondents’ evaluations of unilateral power.
Support for COVID-19 Policies

Note: Entries are logistic regression coefficients and standard errors from models that test for the interaction between the indicator for the Executive order treatment and each of the moderators shown at the top of the column. Positive values indicate positive effects of unilateralism with higher levels of crisis intensity.
Finally, we sought to investigate whether the misperception attributable to a fragmented media environment contributed to tolerance of executive unilateralism. Figure D4 reports effects by perception of state-level case counts. Effects conditioned by this misperception are uncertain, but there is still no evidence in favor of the conditional aggrandizement hypothesis. In sum, these results suggest that tolerance for executive unilateralism is not moderated by objective and subjective measures of the severity of the pandemic.
Partisanship and Support for Policy Responses
Our results provide strikingly little evidence that respondents evaluate policies based on whether they are implemented through the president’s use of unilateral power. We also showed that these largely null findings are not moderated by any measure of crisis severity we possess. These patterns provide little support for a substantial scholarship that links the exaltation of presidential power to national crises.
In a final set of analyses, we explore a potential explanation for our null findings. We propose that the dominance of partisanship in contemporary political evaluations limits the opportunity for crises, such as global pandemics, to systematically reshape public evaluations of presidential power. Much of the scholarship on crisis and public views of the presidency was produced in the mid-twentieth century, when partisan conflict at the elite level was historically low and individuals’ partisanship was a weaker predictor of political attitudes than it is today. Previous research suggests that crisis events rally public opinion behind the president when there is elite consensus to do so (Berinsky Reference Berinsky2009; Brody Reference Brody1991; Zaller Reference Zaller1992). Without elite consensus, the typical factors that structure public opinion in normal times—including partisanship and ideology—continue to produce differences in political views. Given the role of partisanship in structuring other attitudes and behaviors in the context of the COVID-19 pandemic (e.g., Gadarian, Goodman, and Pepinsky Reference Gadarian, Goodman and Pepinsky2020), we examine whether Americans’ partisan attachments overwhelmed the potential effect of the crisis on respondents’ political evaluations.
Our analysis proceeds in two steps. First, we study the relationship between our 11 policy items and respondents’ partisanship. If partisanship is a significant predictor of support for policy proposals, the results would suggest that individual-level variation in support for our dependent variables that address the pandemic is at least partly a function of the same factors that structure public opinion outside of a crisis context. To do so, we plot the coefficients for the partisanship indicators included in the models above, where we estimated logistic regressions of support for each dependent variable on partisanship, the indicator for assignment to the unilateral treatment, the number of county-level cases (plus one, logged), and a battery of demographic controls.
We find that support for policy interventions is strongly associated with partisanship. Figure 6 shows the predicted probability of support for each policy by partisan identification. For all but two policies, Republicans are significantly more likely to support government intervention than Democrats. The magnitude of these differences is striking. Republicans favor suspending Congress, censoring the media, or delaying the election over Democrats by a roughly 2-to-1 margin. Interestingly, these effects countervail crisis severity. For example, while confirmed case numbers are associated with support for government intervention, Republicans are less likely to live in areas with many COVID-19 cases and deaths yet are much more likely to support policy interventions. In a context of national crisis (and global pandemic), Americans evaluated policy proposals related to the crisis through the same partisan lenses they used in normal times.
Predicted Support Conditioned by Partisan Identification
Note: Plots the predicted probability of support by policy intervention and party (leaners coded as partisans). Values simulated from logistic regressions, with log-transformed county-level cases (as of March 29), treatment condition, income, age, party, race, and education as covariates. Republicans are statistically distinguishable from Democrats by convention for all but Prisons and Socialism.

The second step of our analysis evaluates whether local crisis severity moderated the relationship between partisanship and policy support. If crisis events weaken the relationship between “normal politics” and policy evaluations, we would expect that partisan differences in policy evaluations would be smaller in places with greater crisis severity. We estimated the models discussed above and interacted the partisan indicators with the logged number of local confirmed cases (plus one).
These results are shown in Table D1. Across the 11 models, we find no evidence that partisanship was a weaker predictor of policy support as crisis severity increased. That is, Democratic identifiers tended to support each policy proposal at lower rates than Republican identifiers, and the magnitude of the partisan difference in the probability of support did not attenuate as local crisis severity increased. To the contrary, for six of the 11 policy proposals Republicans were more supportive as crisis severity increased, which produced larger partisan differences as support for those items. Democratic identifiers, however, were neither more nor less likely to support each policy depending on local crisis severity. Overall, we find that partisanship was strongly associated with respondents’ policy views no matter the local context of the pandemic. These findings are consistent with observational evidence indicating that opinions about the pandemic were polarized along party lines (Pickup, Stecula, and van der Linden Reference Pickup, Stecula and van der Linden2020) and more responsive to individuals’ partisanship than to objective conditions in their communities (Druckman et al. Reference Druckman, Ognyanova, Baum, Lazer, Perlis, Della Volpe and Santillana2020).
Together, the results discussed above sketch a potential explanation for the largely null effects we detected in our experimental analyses. Namely, the COVID-19 pandemic and the public health and economic crises that accompanied it simply did not unmoor the public from its partisan footing. Instead, the public viewed policy responses to the pandemic through the same partisan lenses used in noncrisis contexts. The COVID-19 pandemic therefore failed to generate the conditions that are theorized to encourage Americans to set aside their partisan differences and rally behind the president. Given their low baseline levels of support for President Trump, the persistence of partisanship in structuring political attitudes among Democrats may be particularly consequential for understanding why the pandemic did not constitute a boon in public acceptance of executive power. It could also be the case that, during crises, the public sets aside their potential procedural objections to government policies and instead relies on cues from partisan elites to evaluate those policies. In either case, crises do not appear to generate reflexive reactions from the American public in support of executive power.
Discussion
By many accounts, crises promote executive power and can destroy democratic systems. Even in relatively stable democracies like the United States, crises have lasting effects on the balance of power between political institutions. The development of a strong presidency is directly tied to critical moments—like the Civil War, the Great Depression, and World War II—when American democracy was brought to the brink. In these moments, institutional checks and balances on executive authority diminished. Whatever countervailing strength legislatures lack in formal authority is amplified in practice. The need to convene and negotiate, together with the widening gap in relevant information, works against any long-term interest in maintaining the separation of powers. Judicial proceedings provide only ex post review of executive action and often defer to the executive in crisis, judgments to the contrary risk being ignored.Footnote 13 The operative question, then, is can public opinion provide an informal check where formal institutions fail?
To begin to answer this question, we presented the results of a nationally representative survey with an embedded experiment fielded during the COVID-19 global pandemic. Though a chorus of scholarship argues the public not only tolerates but demands the exercise of executive power in a crisis, evidence for this claim is based on a handful of cases and often-cited historical polls.
We contribute new evidence about the contexts in which political procedures affect political evaluations. Across a large battery of potential government interventions to address the coronavirus pandemic, we find little evidence that respondents distinguish policies on the basis of how they are implemented. In contrast with scholarship that emphasizes the connection between crises and support for executive governance, our results show that respondents were not systematically more likely to support a policy that was enacted via executive order relative to congressional legislation. Although we find that support for the policies in our study is significantly related to local crisis severity and respondent partisanship, we find no evidence that either of these factors moderates respondents’ evaluations of unilateral action.
Perhaps less surprisingly, we find broad support for dramatic government interventions in response to the crisis. While any survey results are necessarily removed from individuals’ behavior when they have “skin in the game,” they send important signals to executives preparing policy responses. Large majorities were in favor of detaining infected persons, forgivable loans to businesses, restrictions on interstate travel, government owning the means of production for medical supplies, and the suspension of import taxes. In some cases, these interventions may raise concerns about democratic erosion—for example, a majority of respondents were either indifferent to or in support of delaying the 2020 presidential election and suspending the U.S. Congress. Although we also found that support for these interventions was often associated with the severity of the crisis, individual-level concerns about personal health were stronger predictors of policy support than administrative data on the public health and/or economic consequences of the pandemic. Somewhat speculatively, this finding could suggest that the political relevance of crises could itself be politically constructed rather than responsive simply to objective conditions.
These findings have important implications for understanding executive power in crisis. First, seemingly unconditional tolerance for executive power cuts against two existing narratives in scholarship. The public does not prefer executive policy making in a crisis, but the president also does not pay a public penalty for acting unilaterally. In this way, evidence showing overwhelming public support for policy moves such as the internment of Japanese Americans should not be viewed as an endorsement of presidential power itself. Rather, the public appears to be more tolerant of government intervention in a crisis, by any means. During times of crises, the public evaluates policies based on how well they address the urgency of the moment rather than the means through which they are fashioned.
Second, our results have implications for considering the endogeneity of crises when considering their potential effects. Put simply, if crises expand the authority of the president, what is to stop them from creating one as a means of acquiring the state? Our survey suggests two obstacles. Even in a crisis as uncertain and unprecedented as the COVID-19 pandemic, respondents’ support for government intervention was associated with objective and subjective indicators of the crisis’ severity. In this way, public attention brought on by a crisis, and the information acquired as a result, works against the opportunity to manufacture a crisis.
More fundamentally, support for policy interventions and the perception of the crisis itself were both strongly associated with partisan identification. Put simply, our survey suggests that Americans did not abandon their partisan loyalties in response to the crisis. This is even more striking in the context of the pandemic, as the Republican presidential administration downplayed the crisis and ultimately made relaxing government restrictions part of the party brand. When presented policy interventions that were both more restrictive and unprecedented, Republicans were still significantly more likely to support a Republican president. In our view, this raises a point directly relevant to normative criticisms of contemporary polarization. Without a polarized American public who takes its cues from polarized elites, the pandemic could have led to more lasting changes in the scope and scale of executive power, as exercised by the president. In this way, polarization—by limiting the potential for cross-partisan consensus—may be a safeguard against the democratic decay commentators often fear.
These interpretations, of course, should be contextualized with the limits of this study. At the time of our survey, most areas of the U.S. were in the exponential growth stage of COVID-19 case spread. The most obvious potential effect is that baseline levels of support for these policy items may vary over time—just as they varied with the cross-sectional severity of the crisis in late March of 2020. In addition, crises are exceptional by definition, so we cannot know whether similar levels of support for policy interventions would hold in other cases. In this case, the COVID-19 pandemic may even be exceptional among exceptions, as some have shown atypical patterns in presidential approval. Trump’s approval ratings, moreover, were less variable across his administration that for any previous president since modern polling, which may have bounded the opportunity for the pandemic to meaningfully affect attitudes about presidential power. And as the pandemic wore on, elite consensus appeared to grow in arguing that the federal government had done too little to address the pandemic; thus, the conditions for elite criticism of presidential unilateralism (Christenson and Kriner Reference Christenson and Kriner2020) did not seem to be present in the context our study was conducted. More generally, it is difficult to know whether these patterns are a symptom of contemporary polarization, the president in office, or the widely criticized federal response to the pandemic. If the pandemic had occurred in a nonelection year, in a period of American history with lower levels of partisan polarization, with a different president, or with a different media environment, our study could have produced different results. While our research is an important step forward in understanding the relevance of crises for popular demand for presidential leadership, further work is necessary to understand how the effects of crises vary across context and dimensions of public opinion.
SUPPLEMENTARY MATERIALS
To view supplementary material for this article, please visit http://dx.doi.org/10.1017/S0003055421000447.
DATA AVAILABILITY STATEMENT
Research documentation and data that support the findings of this study are openly available at the American Political Science Review Dataverse: https://doi.org/10.7910/DVN/4VHZWW.
ACKNOWLEDGMENTS
We thank John Jackson, Rachel Potter, three anonymous reviewers, and the editors for their helpful comments and suggestions.
FUNDING STATEMENT
This research was funded by the Faculty of Arts and Sciences at Harvard University.
CONFLICT OF INTEREST
The authors declare no ethical issues or conflicts of interest in this research.
ETHICAL STANDARDS
The authors declare the human subjects research in this article was reviewed and approved by the University of Michigan and Harvard University, and certificate numbers are provided in the appendix. The authors affirm that this article adheres to the APSA’s Principles and Guidance on Human Subject Research.




Comments
No Comments have been published for this article.