

Introduction
Compared with aluminum alloys and other metal materials, magnesium alloy had advantages of low density, high specific strength, specific stiffness etc. It had been used in aerospace, automotive, and other fields because it could effectively reduce weight, save fuel, and reduce emissions [Reference Ding, Shuang, Liu and Zhao1]. Due to its good casting properties, most of magnesium alloy parts used in automobile were produced by casting, such as intake manifold, seat structure, and mounting bracket [Reference Friedrich and Mordike2]. Compared with casting magnesium alloys, wrought magnesium alloys had higher strength, better ductility, and better comprehensive mechanical properties [Reference Yan, Deng, Gao, Zhu, Wang and Li3]. However, the application of magnesium alloy was limited because of its HCP crystal structure, which has limited numbers of slip systems, and poor formability at room temperature [Reference Lin, Li, Zhao, Sun, Chen and Meng4]. The mechanical properties of magnesium alloys were closely related to the microstructure and texture evolution in the plastic deformation process [Reference Xie, He, Zhu, Liu, Zhang, Wang, Shu and Fang5]. In order to fabricate high-performance magnesium alloy automotive structural parts, it was necessary to study the thermal deformation behavior of magnesium alloy as well as the microstructure and texture evolution during hot processing.
In the study of the extrusion of as-cast AZ31 magnesium alloy, Chen et al. studied the microstructure evolution of as-cast AZ31 magnesium alloy at different temperatures and different extrusion ratios. The grains of the magnesium alloy were refined, its structure was more uniform, and mechanical properties were greatly improved. These changes were more significant as the extrusion ratio increased [Reference Chen, Song, Fu, Zhao and Zhou6, Reference Chen, Wang, Roven, Karlsen, Yu, Liu and Hjelen7, Reference Kim, Jo, Hong, Kim, Yoon and Park8, Reference Rao, Zhong, Prasad, Suresh and Gupta9]. It is well known that wrought magnesium alloys had better microstructure and properties than cast magnesium alloys [Reference Shu, Zhang, Yu, Tan, Yin and Liu10, Reference Bhattacharya, Lan, Wynne, Davis and Rainforth11, Reference Fatemi-Varzaneh, Zarei-Hanzaki and Beladi12, Reference Fatemi and Zarei-Hanzaki13]. Lin et al. conducted compression experiments at 250 and 300 °C for the as-extruded AZ31 magnesium alloy. It was found that the as-extruded AZ31 magnesium alloy had good compression superplasticity [Reference Lin, Li, Zhao, Sun, Chen and Meng4]; it also could be seen that extruded AZ31 magnesium alloy had better mechanical properties. Therefore, more researchers studied the hot processing characteristics of the extruded AZ31 magnesium alloy. Zhong et al. found that the DRX occurred in two domains, 250–350 °C with a strain rate of 0.01–0.0003 s−1 and 350–450 °C with a strain rate of 1–10 s−1, when they were studying processing map. These two types of DRX were controlled by lattice self-diffusion and intercrystalline self-diffusion, respectively. Meanwhile, the DRX was promoted by Al2Ca which inhibited the coarsening of recrystallization grain [Reference Zhong, Rao, Prasad and Gupta14, Reference Kwak, Lim and Kim15]. Kabirian et al. found that the as-extruded AZ31 magnesium alloy had strong anisotropy after thermal compression, but this anisotropy was negligible at small strain [Reference Kabirian, Khan and Gnäupel-Herlod16, Reference Dong, Pan, Jiang, Dai and Yang17]. In the study of the optimum processing parameters of as-extruded AZ31 magnesium alloy, Srinivasan et al. [Reference Srinivasan, Loganathan, Narayanasamy, Senthilkumar, Nguyen and Gupta18] found that the DRX efficiency of extruded AZ31B magnesium alloy was the highest at 400 °C and 0.01 s−1 strain rate, and the grain size was finer.
In the hot processing, magnesium alloy would produce different textures in itself, these different textures made magnesium alloy anisotropic and affected processability of the material. At present, some researchers have studied the texture evolution of magnesium alloy during hot processing. In the study of the processing effect on the texture of as-cast magnesium alloys, Mayama et al. found that the number of low-angle boundaries decreased and the average misorientation angle increased in the extrusion process of as-cast AZ31 magnesium alloy, and the micro-textures were weakened. A texture evolution mechanism of lattice rotation in the  $\left\{ {10\bar{1}0} \right\}$ plane of extrusion direction caused by nonbasal sliding system of
 $\left\{ {11\bar{2}0} \right\}$ slip direction was proposed [Reference Mayama, Noda, Chiba and Kuroda19, Reference Wang, Song, Jiang, Tang, Chai, Yang, Huang and Pan20, Reference Fernández, Prado, Wei and Jérusalem21]. For rolled magnesium alloy, Mohamed et al. found that ZM21 magnesium alloy sheets had finer grains and weaker basal textures when the alloy was rolled at room temperature [Reference Mohamed, Gollapudi, Charit and Murty22]. Dudamell et al. [Reference Dudamell, Ulacia, Gálvez, Yi, Bohlen, Letzig, Hurtado and Pérez-Prado23] studied the texture evolution mechanism of rolled AZ31 magnesium alloy at dynamic rate. For as-extruded magnesium alloy, Jiang et al. [Reference Jiang, Xu, Yan, Fan, Nakata, Lao, Chen, Kamado, Han and Lu24] studied the texture evolution of AZ31 magnesium alloy during extrusion. The
 $\left[ {10\bar{1}0} \right] – \left[ {2\bar{1}\bar{1}0} \right]$ double-fiber texture occurred randomly in the extrusion process and gradually transformed into nonfiber texture. Yi et al. annealed as-extruded AZ31 magnesium alloy at different temperatures and holding time. They found that the main orientation of equiaxed grains with grain size less than 5 μm and elongated grains with obvious internal misorientation was
 $\left\langle {10\bar{1}0} \right\rangle$, which was paralleled to the extrusion direction [Reference Yi, Brokmeier and Homeyer25, Reference Yi, Brokmeier and Letzig26]. Khan et al. studied the texture evolution of as-extruded magnesium alloy at different strain rates and strains at temperatures lower than 250 °C. They found that high strain at room temperature would create a small amount of twins and rotated lattice for 86°, and the c axis of twins rotated to the direction that parallel to the loading direction. At higher temperatures, changes of grain orientation were same as that at room temperature, but no twins occurred at high strains [Reference Khan, Pandey, Gnäupel-Herold and Mishra27, Reference Sarker and Chen28, Reference Chun and Davies29]. Liu et al. [Reference Liu, Zhu, Huang, Li, Xie and Tang30] carried out the uniaxial compression test of as-extruded AZ31 magnesium alloy at 350 °C and 0.3 s−1 strain rate. They found that with the true strain of −0.1, there were tensile twins in grains, and twin chains existed between adjacent grains. They did not study the texture evolution of as-extruded AZ31 magnesium alloy processed at high temperature.
Deformation behavior of magnesium alloys is closely related to texture. Therefore, studying the texture evolution of magnesium alloys at different temperatures and strains has significant sense to improve their plastic deformation ability. However, texture evolution of as-extruded AZ31 magnesium alloy in the deformation process of high temperature (up to 500 °C) has not been thoroughly studied. In Ref. Reference Srinivasan, Loganathan, Narayanasamy, Senthilkumar, Nguyen and Gupta18, Srinivasan et al. found that the optimum condition of hot processing was at a strain rate range of 0.1–0.01 s−1 at 400 °C. So, in the present study, texture evolution of as-extruded AZ31 magnesium alloy during hot deformation in the temperature range of 250–500 °C was studied, and the texture evolution at 400 °C with different strains was emphatically studied.
Results and discussion
Microstructure evolution
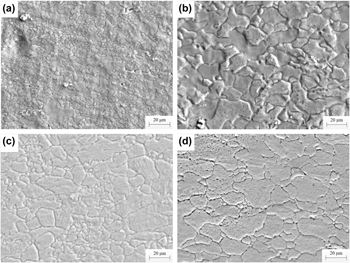
It is shown in Fig. 1 that the microstructure of extruded magnesium alloy compressed at different temperatures at 0.65 strain and 0.05 s−1 strain rate. When at 250 °C, there was the microstructure with obvious fine grains and coarse grains [Fig. 1(a)]. At this temperature, the DRX was not complete sufficiently [Reference Kumar, Blandin, Desrayaud, Montheillet and MSuéry31]. The original coarse grains were fragmented into finer grains, the fine grains sizes were about 1 μm and the average coarse grains size was about 23 µm. Compared with the original microstructure, the new grains of sample compressed at 250 °C had little change, and the original grains changed into irregular bulk grains. In order to further study the DRX process, high-resolution EBSD diagram was used for analysis, as shown in Fig. 2.
The microstructure of the samples compressed at different temperatures at 0.65 strain and 0.05 s−1 strain rate, (a) 250 °C; (b) 300 °C; (c) 400 °C; (d) 500 °C.

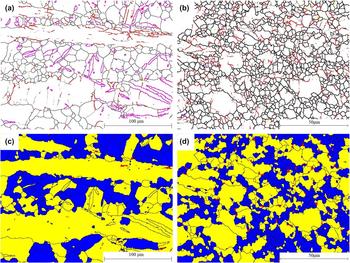
The EBSD of the original sample and the sample compressed at 250 °C: boundary map (high-angle boundaries are represented by black lines, low-angle boundaries by gray lines, and the lines of other colors refer to twin boundaries): (a) the original sample; (b) 250 °C; DRX (subgrains are labeled in yellow, DRX grains are in blue, and deformed grains are in red): (c) the original sample; (d) 250 °C.
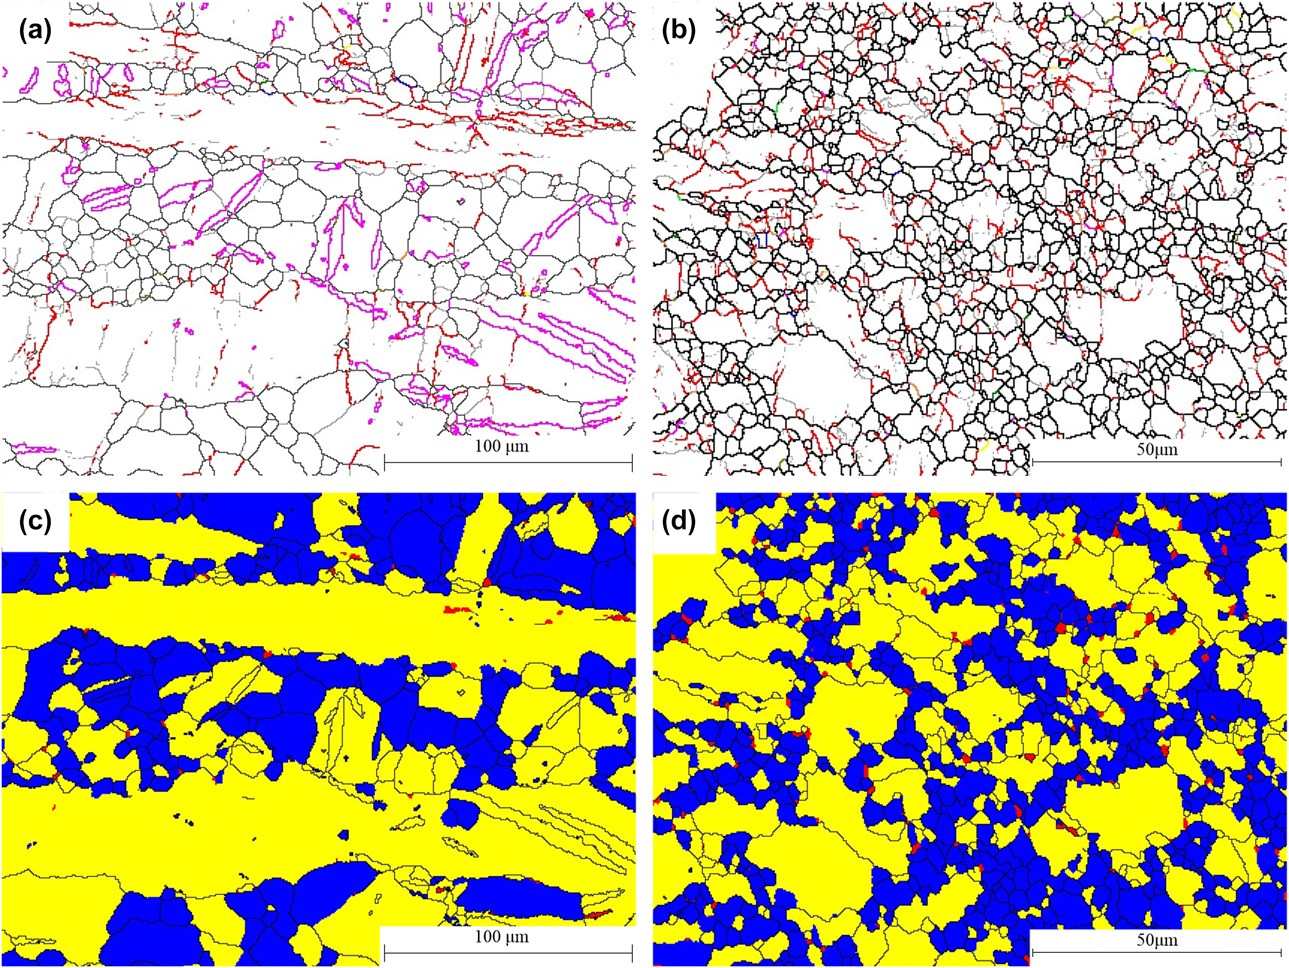
Figures 2(a) and 2(c) show the grain boundary map and DRX map of the original sample; Figs. 2(b) and 2(d) show the grain boundary map of the sample compressed at 250 °C and strain rate of 0.05 s−1. Dislocation climb and cross-slip led to dislocation rearrangement and formation of a low-angle subboundary during the deformation process. Subboundaries absorbed dislocations caused by deformation. Misorientation angles of low-angle subboundaries increased, resulting in subgrain rotation. Low-angle boundaries gradually turned into high-angle boundaries, resulting in refinement of the original microstructure, this is continuous dynamic recrystallization (CDRX) [Reference Galiyev, Kaibyshev and Sakai32]. Compared with the original microstructure [Fig. 2(c)], there were fewer subgrains and more dynamic recrystallized grains [Fig. 2(d)].
Compared with the sample compressed at 250 °C, the content of fine grains in the diagram decreased obviously, and the coarse grains were almost equiaxed at 300 °C [Fig. 1(b)]. With the increase of temperature, more nonbasal slip systems were activated and the nucleation rate increased [Reference Ono, Nowak and Miura33]. The original grains continued to be fragmented as compression proceeded, and new DRX nucleation occurred at grain boundaries, meanwhile the formed DRX grains grew continuously. At 400 °C [Fig. 1(c)], the grains were equiaxed and distributed uniformly. The average grain size was about 18 µm and a small amount of twins were found in grains, the grain boundary was relatively straight, indicating that DRX was basically complete. As the temperature increased, the grains coarsened at 500 °C [Fig. 1(d)]. At this temperature, DRX grains grew faster and bigger than at lower temperatures, and the average grain size reached 28 µm. In summary, it could be found that the microstructure distribution was uniform and the grain size was comparatively small at 400 °C, so that better mechanical properties could be obtained.
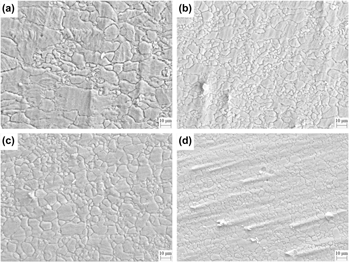
The microstructure of samples compressed to strains of 0.2, 0.4, 0.6, and 0.8 at 400 °C and a strain rate of 0.05 s−1 are shown in Fig. 3. Generally speaking, the average grain size of the as-extruded magnesium alloy decreased with the increase of strain. When at 0.2 strain [Fig. 3(a)], the original grains were elongated during compression. Twins appeared in the large grains and fine DRX grains were formed near the grain boundary; the microstructure was very uneven. When strain reached 0.4, the original coarse grains decreased evidently, but elongated grains still existed. There were fine grains around coarse grains, and the average fine grains size was about 2 µm. As the strain increased from 0.2 to 0.4, the dislocation density increased [Fig. 3(b)] and the lattice distortion intensified, more nucleation was generated and grains were refined. The elongated grains disappeared and the microstructure was filled with equiaxed DRX grains at a strain of 0.6 [Fig. 3(c)]. Compared with the sample compressed to 0.4 strain, the grains did not become smaller, but tended to become bigger. This was because the accumulation of deformation increased the stored energy of the grains. Part of the energy made the subboundary to migrate and the grains’ misorientations to increase by dislocation movement. The low-angle boundaries transformed into high-angle boundaries gradually; the DRX was completed [Reference Sitdikov, Kaibyshev and Sakai34]. Other part of the energy provided sufficient power for the growth of newly formed DRX grains and eventually uniform DRX grains were formed. The grains became finer at a strain of 0.8 [Fig. 3(d)]. This was due to the continuous fragmentation of grains, so as to coordinate the large deformation between the grain boundaries.
The microstructure of the samples compressed at different strains: (a) 0.2; (b) 0.4; (c) 0.6; (d) 0.8.

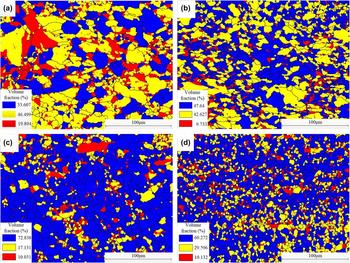
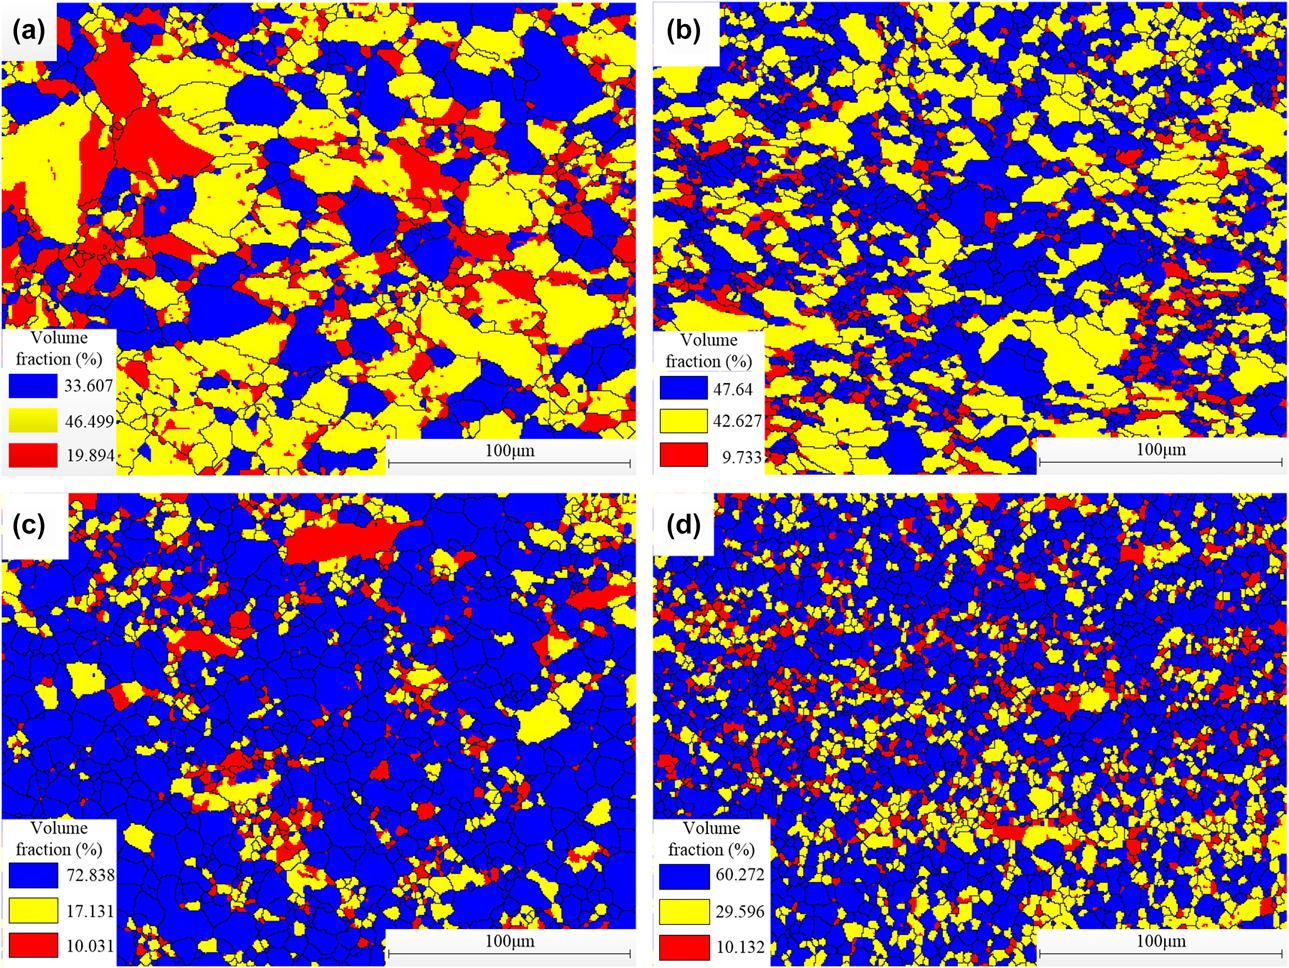
DRX occurred in the process of compression at 400 °C. There were recrystallization structures, deformed structures, and deformed substructures in the microstructure. In order to further study the DRX behavior of magnesium alloy compressed to different strains at 400 °C, the kernel average misorientation (KAM) parameters provided by EBSD should be used to calibrate: the point would be labeled in blue as a recrystallized structure, if the average misorientation between the scanning point and its adjacent point was less than 1°, it would be labeled in yellow as a deformed substructure when the average misorientation was 1–2°, and it would be labeled in red as deformed structure when the average misorientation was 2–7.5°. The distributions of DRX microstructure at different strains at 400 °C and 0.05 s−1 strain rate are shown in Fig. 4. The ratio of recrystallized grains was 33.607% after compression of 0.2 strain [Fig. 4(a)], and a large amount of substructure was formed by dislocation in the early period of compression. Compared with 0.2, the number of deformed structures and substructures decreased at strain of 0.4 [Fig. 4(b)], and the recrystallized structures increased with the increase of strain. Subgrains absorbed a part of the dislocations and its boundaries gradually changed from low-angle boundary to high-angle boundary, this is CDRX. When the strain was 0.6 [Fig. 4(c)], the ratio of DRX structure reached 72.838% if we give the definition that DRX was completed sufficiently as the recrystallized structure accounted for more than 65% in the microstructure of material. So the DRX was completed sufficiently at this strain, also the recrystallized structure was equiaxed and distributed uniformly. Grains were further refined at 0.8 strain [Fig. 4(d)], the content of DRX structure decreased slightly to a ratio of 60.272%. This might be because the deformation was too large, there were local dislocations in the DRX grains, and the system automatically labeled it as subgrain. But this needs further studies to test this hypothesis. Contents of the deformed substructure increased and the deformed structure was basically unchanged; it could be considered that DRX was sufficiently completed. In fact, it could not be completely composed of recrystallized structure in the material even if the DRX was completed sufficiently, there would be a small amount of subgrain and deformed structure left. At this stage, the recrystallization ratio generally did not increase significantly. When the ratio was between 70 and 80%, the DRX reached a stable state.
The DRX microstructure distribution of the samples compressed at different strains: (a) 0.2; (b) 0.4; (c) 0.6; (d) 0.8.
Grain orientation
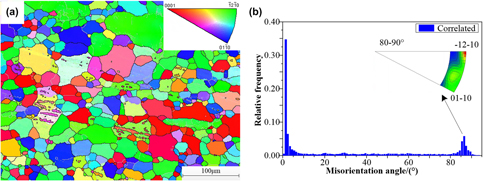
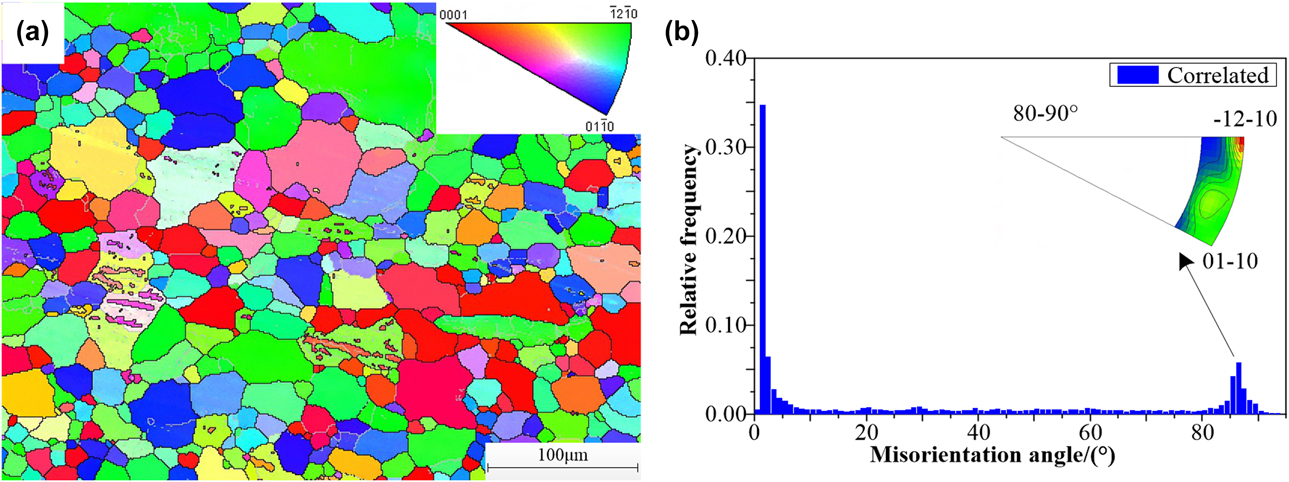
It is shown in Fig. 5 the grain orientation of the original sample. The inverse pole figure (IPF) map is shown in Fig. 5(a), in which the basal orientation {0001} was labeled in red and prismatic orientations  $\left\{ {\bar{1}2\bar{1}0} \right\}$ and
 $\left\{ {01\bar{1}0} \right\}$ were labeled in green and blue, respectively. It could be found that the original microstructure consisted of equiaxed grains, the distribution of grains and the distribution of grain orientation were both uneven. Different basal textures and prismatic textures were distributed in microstructure of the original sample. Texture components needed to be determined by combining pole figure and IPF map. Misorientations of adjacent grains are shown in Fig. 5(b), the coexistence of high- and low-angle boundaries could be found. Local peaks appeared in the range of 2–5° and 80–90°. The grain boundaries of 2–5° belong to low-angle boundaries. The basal slip of grain eventually led to the appearance of the basal texture. In addition, subboundaries (subboundaries belong to low-angle boundaries) were also formed in some grains [Fig. 5(a)]. Most of the rotation axes of grain boundaries of 80–90° were concentrated near
 $\left\langle {\bar{1}2\bar{1}0} \right\rangle$ [Fig. 5(b)]. This orientation coincided with the tensile twin orientation of
 ${{86.3^\circ } / {\left\langle {\bar{1}2\bar{1}0} \right\rangle }}$ (±5° deviation), indicating the formation of obvious tensile twins.
The EBSD diagram of the original sample: (a) IPF map (gray lines refer to low-angle boundaries and black lines refer to high-angle-boundaries), (b) misorientation distribution.
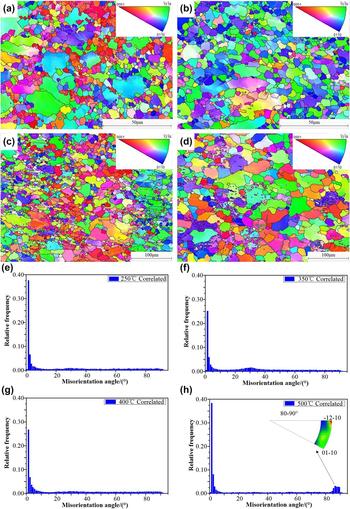
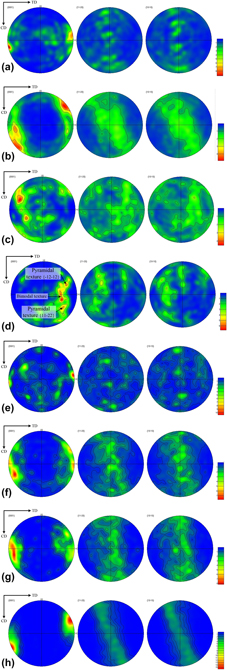
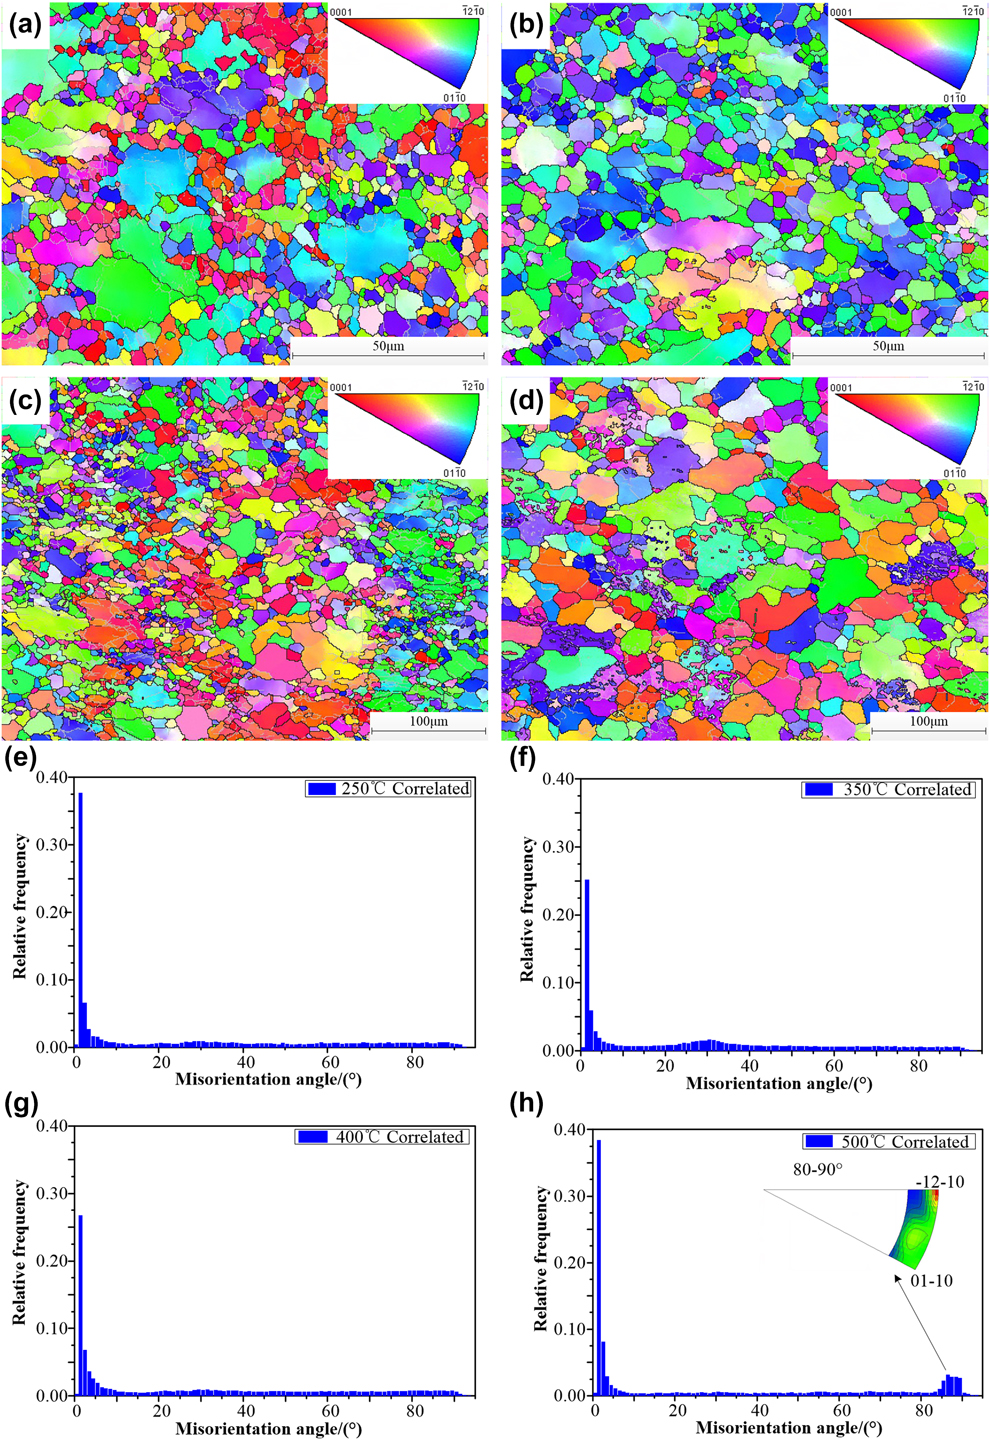
The grain orientation of the samples compressed at different temperatures at 0.05 s−1 strain rate and 0.65 strain was analyzed. The grain orientations and misorientation distributions of samples are shown in Fig. 6. Compared with the original grain orientation, color gradient appeared inside some original coarse grains, as shown in Fig. 6(a), indicating the existence of orientation gradient. This was due to the stress concentrated neared the grain boundaries which led to the formation of dislocation and the accumulation of dislocations would lead to formation of subgrains [Reference Galiyev, Kaibyshev and Sakai32]. As shown in Fig. 6(e), the local peak appeared at about 2°. As the compression proceeded, DRX occurred and the low-angle subboundary gradually transformed into a high-angle boundary. The rotation of the subgrain led to changes in the original grain orientation, and the coarse grains with basal orientation were fragmented into finer grains; overall relative frequency of misorientation angles of the sample compressed at 250 °C was less than the original sample. From the pole figure shown in Fig. 7(a), we found that the strength of the basal texture became very weak and its normal direction deviated from the ND direction. In Fig. 6(e), compared with the original sample, tensile twins did not occur in the sample compressed at 250 °C. The c axes of most grains deviated from the compression axis that made them be in a direction not conducive to the occurrence of tensile twins. The orientation diagram of the sample compressed at 300 °C was hardly having any red spots [Fig. 6(b)], indicating that the basal orientation disappeared and only prismatic orientations were left. In the corresponding pole figure [Fig. 7(b)], the basal texture disappeared, leaving only the prismatic texture with an angle of 60° to the CD direction lift. With the increase of deformation temperature, some prismatic slip systems were activated and that made the crystal plane to rotate and formed prismatic texture. Compared with the Fig. 6(e), the content of low-angle boundary was less in the Fig. 6(f) and the local peak of relative frequency appeared near the misorientation angle of 30°. From the corresponding orientation diagram, DRX grains appeared near the serrated boundaries of coarse elongated grains. The persistent rotation of subgrains was likely to lead to the occurrence of DRX at high-angle boundaries [Reference Galiyev, Kaibyshev and Sakai32], and this might have created DRX texture. A small amount of basal orientation labeled in red appeared in the orientation diagram of the sample compressed at 400 °C [Fig. 6(c)], and also crystal plane orientation between {0001} and  $\left\{ {\bar{1}2\bar{1}0} \right\}$ or
 $\left\{ {01\bar{1}0} \right\}$ orientations appeared. Compared with Fig. 6(a), the number of red spots has reduced in Fig. 6(c). This was due to the activation of nonbasal slip, especially pyramidal slip, at 400 °C, and that could better coordinate the deformation between adjacent grains, dispersed the original orientation [Reference Ono, Nowak and Miura33]. The increase of orientation randomization was evidently shown in Fig. 7(c); deformation-prone textures could be produced at this temperature. The original basal textures leading to anisotropy disappeared and other unfavorable orientations were more randomized. With the increase of temperature, DRX was more likely to occur and low-angle boundaries gradually changed into high-angle boundaries. DRX was fully completed at 400 °C.
The EBSD diagram of magnesium alloy compressed at the different temperature: IPF map: (a) 250 °C; (b) 300 °C; (c) 400 °C; (d) 500 °C; misorientation distribution: (e) 250 °C; (f) 300 °C; (g) 400 °C; (h) 500 °C.
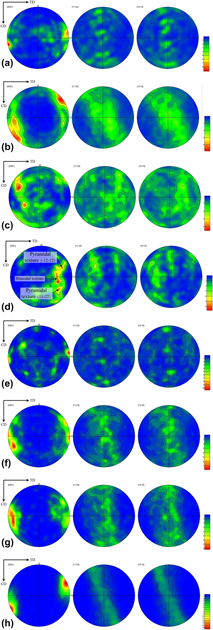
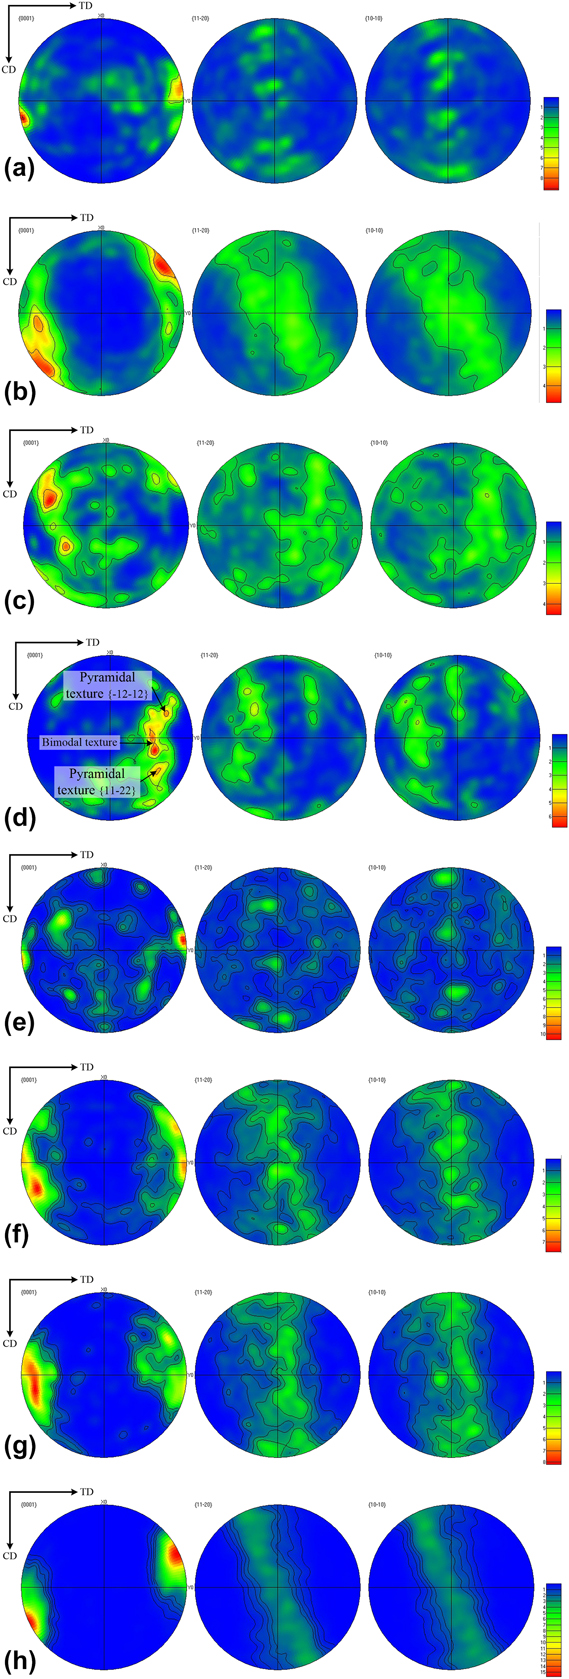
The pole figures of the samples compressed at different temperatures: (a) 250 °C; (b) 300 °C; (c) 400 °C; (d) 500 °C; The pole figures of the samples compressed at different strains: (e) 0.2; (f) 0.4; (g) 0.6; (h) 0.8.
Grains’ average size increased evidently at 500 °C [Fig. 6(d)]. The DRX grains grew up and the corresponding recrystallized texture became stronger. In Fig. 7(d), it could be found that a strong bimodal texture was on the direction which had an angle of 45° to the ND direction. The misorientation distribution shown in Fig. 6(h) was similar to that of the original sample. Most of the rotation axes of grain boundaries of 80–90° were concentrated near  $\left\langle {\bar{1}2\bar{1}0} \right\rangle$. This coincided with the tensile twin orientation of
 ${{86.3} / {\left\langle {\bar{1}2\bar{1}0} \right\rangle }}$ (±5° deviation), indicating the existence of a large amount of tensile twins. The content of low-angle boundaries increased at this temperature, not only basal slips and tensile twins, but also pyramidal slips and prismatic slips existed and finally formed a comparative strong texture.
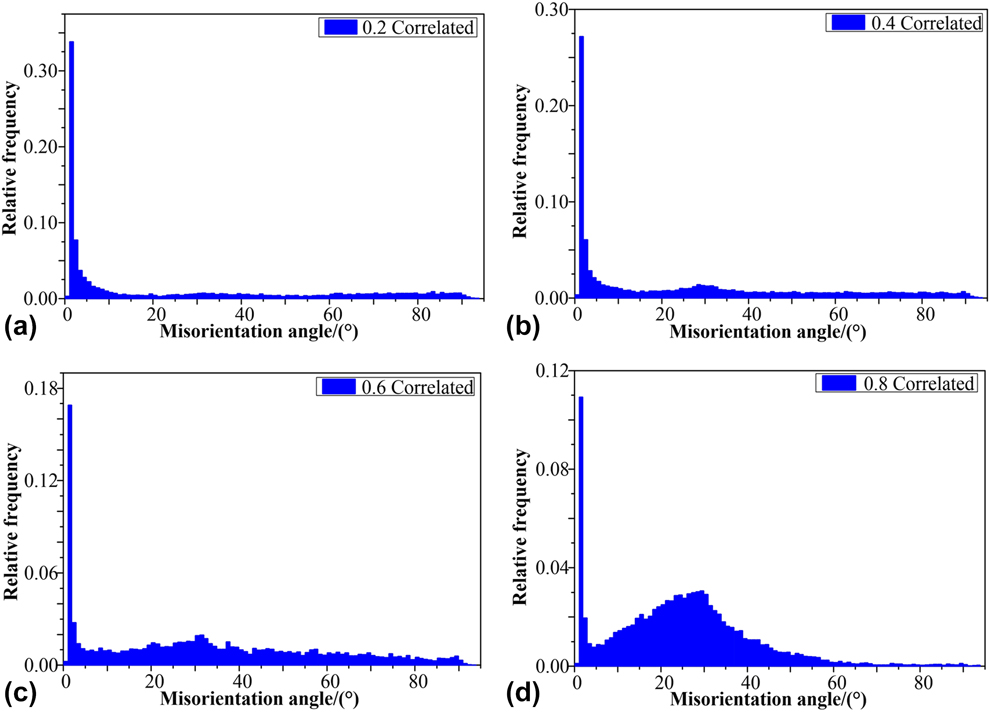
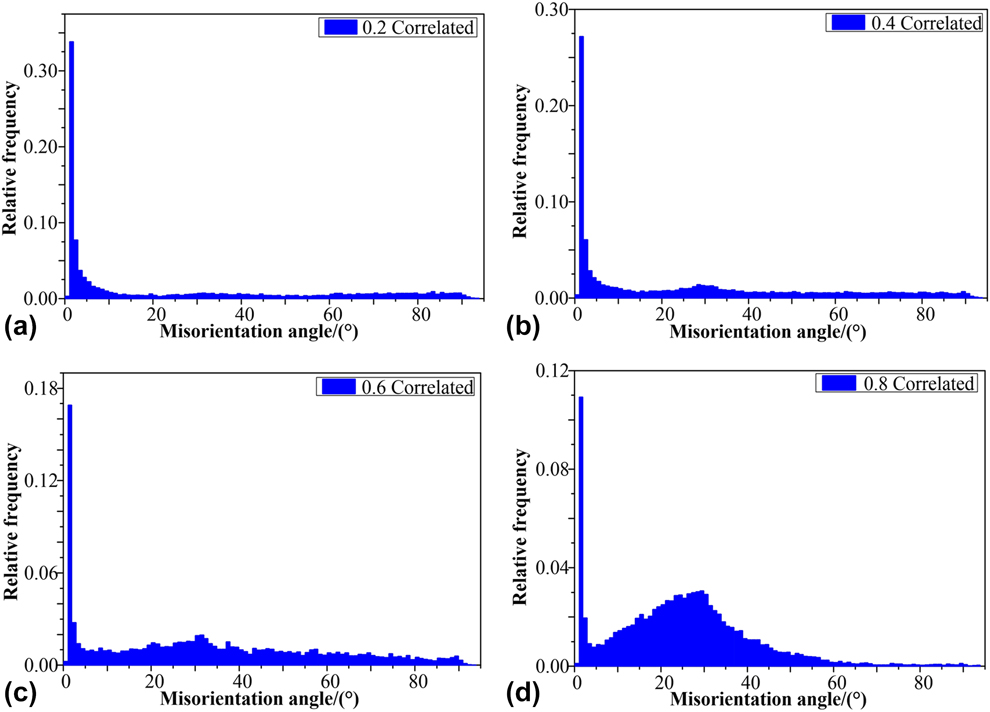
When temperature remained still, strain also affected grain orientation. At 400 °C and 0.05 s−1 strain rate, it is shown in Fig. 8 the misorientation distribution between adjacent grains in the samples compressed to different strains. At a strain of 0.2 [Fig. 8(a)], the ratio of high-angle boundaries was 41.3%, most of the grain boundaries were low-angle boundaries. At the beginning of deformation, a large amount of low-angle subgrains existed because of the existence of basal texture and incomplete DRX. The volume fraction of DRX increased with the increase of strain (Fig. 4). At a strain of 0.4, the original basal orientation gradually deviated from TD and weakened. The prismatic texture gradually formed with the occurrence of DRX. The misorientation distribution in Fig. 8(b) reached a peak value at about 30° of misorientation angle, indicating that most of the formed high-angle DRX boundaries were at about 30°. The original basal textures disappeared in the corresponding pole figure [Fig. 7(f)], and the prismatic texture weakened and deviated 30° from the original orientation. At a strain of 0.6, the ratio of high-angle boundaries increased to 68.5%. The distribution of high-angle boundaries was comparatively uniform, as shown in Fig. 8(c). In Fig. 8(d), with the increase of strain, the high-angle boundary continued to increase to 71.9%. The relative frequency of high-angle boundaries had an obvious local peak at 30°, and there were few boundaries of 65° misorientation angle or above. In corresponding pole figure [Fig. 7(h)], the DRX prismatic texture became stronger.
The distribution of misorientation between adjacent grains in compressed samples of different strains at 400 °C and 0.05 s−1 strain rate: (a) 0.2; (b) 0.4; (c) 0.6; (d) 0.8.
Texture evolution
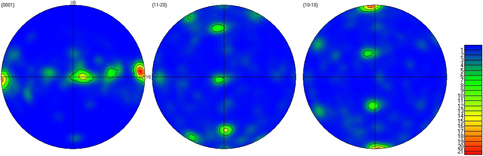
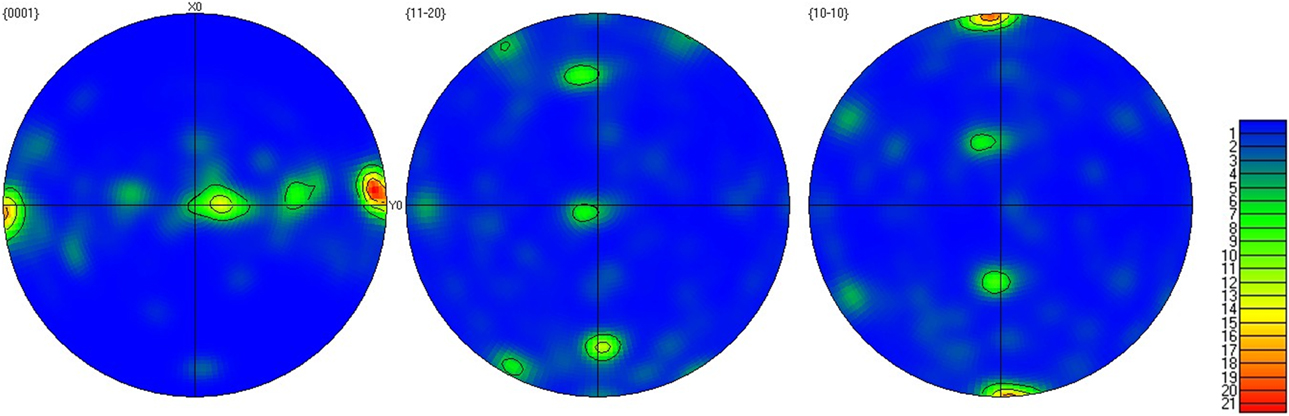
The pole figures of the original sample are shown in Fig. 9. The X0 axis represented the extrusion direction of the billet, the Y0 axis represented the transverse direction, and the direction perpendicular to X–Y plane was the normal direction of the extrusion surface, namely ND direction. It could be found that the original sample was composed of mixed textures; the main textures were basal texture  $\left\{ {0001} \right\}\left\langle {10\bar{1}0} \right\rangle$ and prismatic texture
 $\left\{ {11\bar{2}0} \right\}\left\langle {10\bar{1}0} \right\rangle$. Basal texture
 $\left\{ {0001} \right\}\left\langle {10\bar{1}0} \right\rangle$ was mainly generated by basal slip and
 $\left( {10\bar{1}2} \right)$ pyramidal tensile twins in grains. The basal plane {0001} of the grains was parallel to the extrusion direction, and their grain direction
 $\left\langle {10\bar{1}0} \right\rangle$ was parallel to the extrusion axis. The pole density reached 13; the prismatic texture was stronger than the basal texture, and the maximum pole density reached 21.69. The prismatic plane
 $\left\{ {11\bar{2}0} \right\}$ of a large part of grains was parallel to the extrusion direction, and its grain direction
 $\left\langle {10\bar{1}0} \right\rangle$ was parallel to the extrusion axis. In addition, there was a small amount of other prismatic textures. The angle between the crystal plane of these textures and the ND direction was 45°, and the angle between the crystal plane and the RD direction was 85°, which further confirmed the grain orientation distribution in Fig. 5.
The pole figures of the original sample.
Pole figures of the samples compressed at different temperatures are shown in Fig. 7. For the convenience of the comparison between the original sample and compressed samples, the TD direction was set as horizontal direction, the CD direction (metal flow direction) was set as vertical direction, and the direction perpendicular to TD-CD plane was ND direction. Compared with textures in the original sample, the basal texture  $\left\{ {0001} \right\}\left\langle {10\bar{1}0} \right\rangle$ disappeared in the sample compressed at 250 °C [Fig. 7(a)], and the prismatic texture
 $\left\{ {11\bar{2}0} \right\}\left\langle {10\bar{1}0} \right\rangle$ continued to deflect to the ND direction. The highest pole density decreased from 21.69 to 9.2, and it could be found in the
 $\left\{ {10\bar{1}0} \right\}$ pole figure that the textures weakened obviously. Texture changed when the deformation temperature was 300 °C [Fig. 7(b)]; the original prismatic texture disappeared, and new plane texture components were formed. A part of the newly formed texture was prismatic texture, which deviated 90° from ND direction and 50° from CD direction. The texture of crystal plane
 $\left\{ {11\bar{2}0} \right\}$ and
 $\left\{ {10\bar{1}0} \right\}$ could be determined by observing
 $\left\{ {11\bar{2}0} \right\}$ and
 $\left\{ {10\bar{1}0} \right\}$ pole figure. Another part of texture deviated 65° from ND direction and 80° from CD direction and was close to
 $\left\{ {0\bar{1}11} \right\}$ texture. The maximum pole density was 4.89, which was less than that of 250 °C. When at 400 °C [Fig. 7(c)], the pole density of
 $\left\{ {11\bar{2}0} \right\}$ and
 $\left\{ {10\bar{1}0} \right\}$ texture decreased to 2. New texture components close to
 $\left\{ {\bar{1}\bar{1}22} \right\}$ and
 $\left\{ {1\bar{2}12} \right\}$ pyramidal textures were formed. The highest pole density reached 4.54, which was slightly less than that of 300 °C. The results indicated that the pyramidal slips were activated at this temperature. Meanwhile, the preferential nucleation of recrystallization was sufficient at this temperature, the corresponding
 $\left\{ {\bar{1}\bar{1}22} \right\}$ and
 $\left\{ {1\bar{2}12} \right\}$ pyramidal textures were recrystallized textures. The
 $\left\{ {11\bar{2}0} \right\}$ and
 $\left\{ {10\bar{1}0} \right\}$ prismatic textures disappeared at 500 °C [Fig. 7(d)]. New bimodal pyramidal texture
 $\left\langle {01\bar{1}1} \right\rangle$; pyramidal textures
 $\left\langle {\bar{1}2\bar{1}2} \right\rangle$,
 $\left\langle {11\bar{2}2} \right\rangle$ and a few prismatic texture
 $\left\{ {10\bar{1}0} \right\}$ were formed. The tensile twins of 86.3°could be found in Fig. 6(h), some grains rotated about 90°. DRX grains grew preferentially to form recrystallized textures, the
 $\left\langle {01\bar{1}0} \right\rangle$,
 $\left\langle {\bar{1}2\bar{1}2} \right\rangle$, and
 $\left\langle {11\bar{2}2} \right\rangle$ textures were recrystallized textures. The maximum pole density was 6.79, which was higher than that of 300 and 400 °C. With the increase of deformation temperature, the atomic activity increased, the potential prismatic and pyramidal slip systems were activated [Reference Ono, Nowak and Miura33]. The texture compositions of magnesium alloy became more complex.
When the temperature remained still, the texture evolution would change at different strains.
The pole figures of samples compressed to different strains are shown in Fig. 7. At a strain of 0.2 [Fig. 7(e)], the original basal textures deflected to TD direction. The texture strength weakened with the increase of diffusion of original basal textures. At a strain of 0.4 [Fig. 7(f)], only the prismatic textures were left. The basal texture disappeared and the highest pole density of the texture decreased,  $\left\{ {\bar{1}2\bar{1}0} \right\}$ and
 $\left\{ {01\bar{1}0} \right\}$ prismatic textures were formed. When strain increased from 0.4 to 0.6, the highest pole density of the texture had no change, nor did the texture components. But the content of high-angle boundaries increased [Fig. 7(g)]. When the strain was 0.8 [Fig. 7(h)], the prismatic textures began to deflect toward CD direction and all of them were transformed into
 $\left\{ {\bar{1}2\bar{1}0} \right\}$ prismatic texture. The highest pole density and 30° high-angle boundaries were increased, this might related to the enhancement of prismatic texture
 $\left\{ {\bar{1}2\bar{1}0} \right\}$. In summary, the original basal texture disappeared in the samples compressed to different strains at 400 °C and 0.05 s−1 strain rate, while the content of prismatic textures decreased first and then increased. Texture components did not change much. In contrast, the formation of textures and textures’ strength were mainly affected by temperature and the mode of deformation.
Conclusion
In this paper, the microstructure evolution, grain orientation and texture evolution of AZ31 magnesium alloy during thermal compression test were studied under two different conditions (i) different temperatures with constant strain and strain rate and (ii) different strains with constant temperature and strain rate. We found that temperature not only affects the maximum pole density of texture, but also affects the type and composition of texture. The conclusions are as follows:
(1) At the strain of 0.65 and 0.05 s−1 strain rate, the rise of temperature promoted the initiation of the slip systems, new DRX nucleation occurred at grain boundaries, the low-angle boundaries transformed into high-angle boundaries gradually, and the basal orientation of the grain was replaced by pyramidal orientation. At 400 °C, new orientation appeared in the grains, which are between {0001} and
 $\left\{ {12\bar{1}0} \right\}$ or $\left\{ {01\bar{1}0} \right\}$, and new texture components were formed, which were close to $\left\{ {\bar{1}\bar{1}22} \right\}$ and $\left\{ {1\bar{2}12} \right\}$ pyramidal textures. The texture compositions became more complex at 500 °C.
(2) At 400 °C and 0.05 s−1 strain rate, with the increase of strain, the average grain size decreased, DRX grain volume fraction increased, the low-angle boundaries transformed into high-angle boundaries gradually. The original basal texture disappeared and it was replaced by pyramidal texture gradually. After the strain reaches 0.4, the increase of strain did not change the texture component but only the extreme density intensity.


Experiments
Material
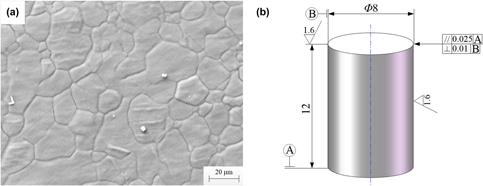
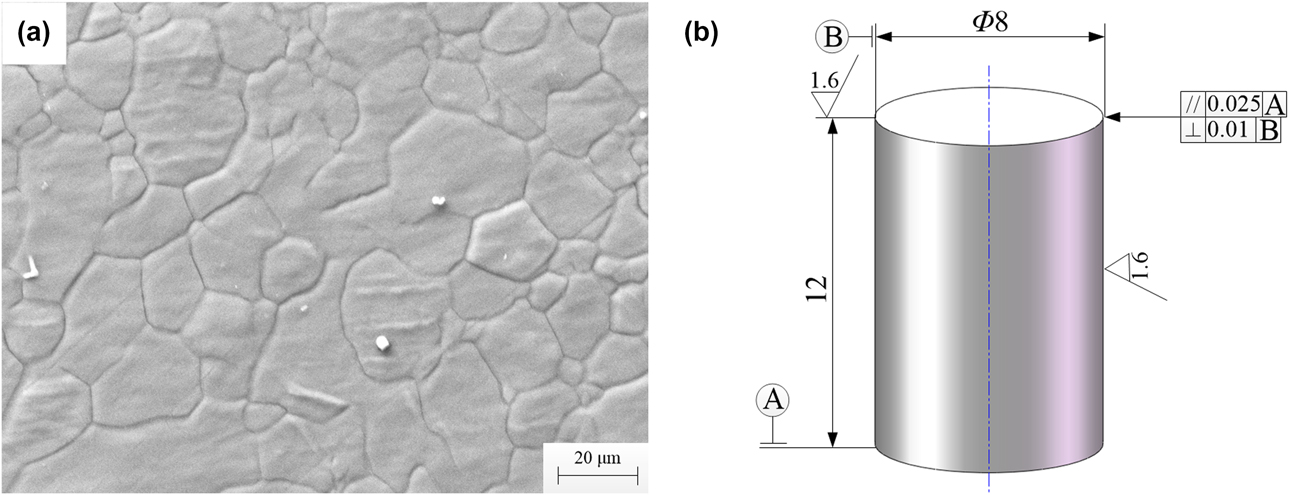
The as-extruded AZ31 magnesium alloy with a composition (in wt%) of Al: 3.21, Zn: 0.99, Mn: 0.34, Fe: 0.0021, Si: 0.017, Cu: 0.0021, Ni: 0.00061, Mg: Bal was used for the compression test. Homogenization treatment was conducted on the as-extruded billet at 400 °C for 12 h. The original microstructure after the homogenization treatment is shown in Fig. 10(a). The size of the cylindrical samples cut from the billet for uniaxial compression was Ø 8 × 12 mm. The axes of the samples were parallel to the axis of the as-extruded billet. The dimensional drawing of the samples is shown in Fig. 10(b).
(a) The original microstructure of as-extruded AZ31 magnesium alloy, (b) Dimensional drawing of samples.
Compression test
Thermal compression simulation test was carried out using Gleeble-3800 (Dynamic Systems Inc., El Segundo, California) thermal-mechanical simulation system. To study the evolution of microstructure and texture at different temperatures, uniaxial compression tests were conducted at deformation temperatures of 250, 300, 400, and 500 °C at 0.65 strain and 0.05 s−1 strain rate. To study the effect of strain on the evolution of microstructure and texture, uniaxial compression tests were conducted at strains of 0.2, 0.4, 0.6, and 0.8 at 400 °C and 0.05 s−1 strain rate. Nickel–graphite-based lubricant was added to the end faces of the samples before compression test to reduce the effects of friction on the contact surfaces. A k-type thermocouple was welded on the center of each sample to monitor and control the deformation temperature. Before reaching the set temperatures, samples were heated up at rate of 5 °C/s and kept the temperature for 90 s to minimize thermal gradients of the sample. After compression, samples were quenched by water immediately to preserve the microstructure at room temperature.
After grinding and polishing, the samples were first corroded with picric acid solution (picric acid 6 g, ethanol 100 mL, acetic acid 5 mL, and distilled water 10 mL) and then washed with ethanol. The microstructure was observed by a ZEISS SEM. The grain orientation of the samples was measured by EBSD and step size was 1 μm. The postprocessing software HKL Channel 5 (Oxford Instruments, Witney, U.K.) was used to process the EBSD data.
Acknowledgments
This work was supported by the postdoctoral start-up fund of Taiyuan University of Science and Technology (20152034), the Natural Science Foundation of Shanxi Province (201701D221135 and 201701D111003), National College Students Innovation and Entrepreneurship Project (201710109003 and 201610109007), National Key Research and Development Plan (2016YF130300200), and the 1331 Project of Shanxi Province.