





Introduction
The growing global demand for food, combined with the impacts of climate change on agricultural production, is placing increasing demands on seed quality to ensure successful crop establishment. In this context, the use of high-vigour seeds enhances establishment success by enabling crops to better adapt to a wide range of environmental conditions (Finch-Savage and Bassel, Reference Finch-savage and Bassel2016; Powell, Reference Powell2022). Vigour assessment is a key component of the seed industry, as it enables monitoring of the physiological potential of seed lots throughout the production process and supports informed management decisions (Marcos-Filho, Reference Marcos-filho2015b). Nevertheless, despite its importance, information on seed vigour remains scarce compared with data on viability, and research into its dynamics during storage and its relationship with longevity is still limited.
Seed vigour, defined by ISTA (2022) as ‘the sum of those properties that determine the activity and performance of seed lots, of acceptable germination, over a wide range of environments’, is a complex trait that reflects multiple aspects of seed physiological potential. Unlike the standard germination test (G), vigour tests provide a more precise and sensitive measure of physiological deterioration, enabling early detection of ageing symptoms (Ellis and Roberts, Reference Ellis and Roberts1981). This makes them valuable tools for predicting seed lot performance during storage and under field conditions (TeKrony and Egli, Reference TeKrony and Egli1977; Marcos-Filho, Reference Marcos-filho2015a). Among these, accelerated ageing (AAT) and tetrazolium (Tz) tests play a central role in soybean (Glycine max) seed quality assessment (Marcos-Filho, Reference Marcos-filho2015a; França-Neto and Krzyzanowski, Reference França-neto and Krzyzanowski2022), as storage-related deterioration is typically expressed as a progressive decline in seed performance potential (Marcos-Filho, Reference Marcos-filho2015a).
Soybean seeds, due to their morphological and physiological characteristics, are particularly susceptible to deterioration and vigour loss during storage, as well as to damage during harvest and processing (Parrish and Leopold, Reference Parrish and Leopold1978; Marcos-Filho, Reference Marcos-filho2015a). This vulnerability is exacerbated under unfavourable environmental conditions, such as those in tropical and subtropical regions, where maintaining physiological quality is especially challenging. Numerous studies have documented the effects of storage temperature and seed moisture content on soybean seed viability and vigour, showing that increases in either factor reduce storage lifespan (Smaniotto et al., Reference Smaniotto, Resende, Marçal, Oliveira and Simon2013; Carvalho et al., Reference Carvalho, Mavaieie, Oliveira, Carvalho and Rodrigues Vieira2014; Marcos-Filho, Reference Marcos-filho2015a; Ferreira et al., Reference Ferreira, Villela, Meneghello and Soares2017). High initial physiological quality is associated with slower deterioration rates during storage (Marcos-Filho, Reference Marcos-filho2015a), whereas environmental and seed coat damage reduce physiological quality and compromise vigour preservation (TeKrony et al., Reference TeKrony, Egli and Phillips1980; De Souza and Marcos-Filho, Reference De Souza and Marcos-filho2001; Moreano et al., Reference Moreano, Braccini, Scapim, Krzyzanowski, França-neto and Marques2011; Forti et al., Reference Forti, Carvalho, Ossamu Tanaka and Cicero2013; Torres Licursi Vieira et al., Reference Torres Licursi Vieira, Barbosa, Barbosa and Vieira2013; Teixeira et al., Reference Teixeira, Zorato and Meneghello2024; Barrionuevo et al., Reference Barrionuevo, Panho, Meira, Menegazzi, Marcante, Linhares, Nascimento, Finatto and Benin2025). However, despite these insights, the practical application of such findings in the production sector remains limited (Marcos-Filho, Reference Marcos-filho2015a).
The interaction of three key factors – seed moisture, storage temperature and initial quality – ultimately determines seed quality at the end of the storage period (Bewley et al., Reference Bewley, Bradford, Hilhorst and Nonogaki2013). Ellis and Roberts (Reference Ellis and Roberts1980, Reference Ellis and Roberts1981) pioneered the quantitative description of this relationship through the viability equation, which models changes in the viability of orthodox seeds during storage. Their work demonstrated that viability declines follow a negative sigmoidal pattern, indicating that not all seeds die simultaneously (Ellis, Reference Ellis2022). Similarly, population-threshold models assume that seed populations exhibit underlying normal distributions in their responses to ageing (Bradford et al., Reference Bradford, Tarquis and Durán1993). Over the past decades, these models, or their derived parameters, have been applied to assess seed longevity across species and storage conditions (Hay et al., Reference Hay, Valdez, Lee and Santa Cruz2018, Reference Hay, Davies, Dickie, Merritt and Wolkis2022), proving valuable for identifying species-specific storage characteristics and improving both commercial storage practices and germplasm conservation (Ellis, Reference Ellis1988). Although similar approaches could be used to predict the decline in seed vigour during post-harvest storage, such models have not been developed to date.
Many trials have been conducted to study how different storage conditions and seed quality parameters affect the loss of vigour in soybean seeds; however, there are no studies that have attempted to quantify the relative impact of each of these factors in real production systems. Such knowledge would be critical for identifying practices essential to producing high-quality seeds. Moreover, no predictive models have been developed to estimate the effects of these factors on vigour changes during storage. The ability to forecast vigour loss would allow seed companies to make strategic decisions to preserve quality, optimize lot management and improve operational efficiency throughout production and marketing.
In light of this knowledge gap, the objectives of this study were to:
a) quantify the effects of storage temperature, seed moisture content and initial vigour on vigour loss during storage of soybean seeds; and
b) develop a quantitative, population-based model to predict vigour loss in soybean seed lots under commercial storage conditions as a function of these variables.
Materials and methods
Biological material
Soybean (Glycine max (L.) Merrill) seeds of the cultivars 62R63 RSF (a glyphosate-tolerant genotype) and 67i70 RSF PRO (a glyphosate- and Cry1Ac lepidopteran-tolerant genotype) were used. Seeds were produced during the 2021/2022 and 2022/2023 growing seasons by the soybean seed production company Estancia El Azul S.A. (Puesto de Uncos, Tucumán Province, 26°27′S 64°40′W) and Estancia Los Mirkos S.A. (General Mosconi, Salta Province, 22°35′S 63°47′W).
Twenty-four commercial seed lots differing in vigour (assessed by the Accelerated Ageing Test, AAT; ISTA, 2022) and moisture content at harvest were selected. These lots were chosen to represent the range of variability typically encountered in commercial soybean seed production systems. Ten seed lots of cultivar 62R63 RSF were used for model development. Whereas the remaining 14 seed lots, produced in Tucumán (2022) and Salta (2023), were used for model validation. These lots represented independent datasets that differed in genotype, production environment and seed damage levels. At the time of sampling, seeds had been stored for 45 days in silo bags under field conditions.
Seed quality assessment
Immediately after sampling, initial seed quality was assessed using tests described below. Laboratory tests were conducted at the seed quality laboratory (Estancia El Azul S.A.), accredited by the Argentine National Seed Institute (INASE-Registration No. RNCyFS I-7073).
• Germination test (G)
Four replicates of 50 seeds were sown. Seeds were placed in sand moistened to 40% of its water-holding capacity in plastic trays (26 × 19 × 5 cm), enclosed in polyethene bags to maintain humidity and incubated at 25°C ± 2 under a 16 h dark/8 h light regime according to ISTA (2022). After six days, seedlings were evaluated according to the Handbook on Seedling Evaluation (ISTA, 2018), and results are expressed as percentages.
• Tetrazolium test (Tz)
Four replicates of 25 seeds were preconditioned between moist paper for 16 h at room temperature. Seeds were then immersed in a 0.1% aqueous solution of 2,3,5-triphenyltetrazolium chloride (pH 7) and incubated at 35°C for 3 h in darkness. Each seed was examined, and the mechanical, environmental and insect-related damage levels were determined following the Argentine National Agricultural Institute reference patterns (França-Neto and Krzyzanowski, Reference França-neto and Krzyzanowski2022). Results are expressed as percentages.
• Accelerated ageing (AAT, 72 h)
Fungicide-treated seeds (42 g; pyraclostrobin 5% + thiophanate-methyl 45%, 100 ml/100 kg seed) were incubated at 41°C ± 0.3°C and 95% RH for 72 h following ISTA (2022). Afterwards, four replicates of 50 seeds were sown in sand moistened to 40% of its water-holding capacity and incubated under the same conditions as the germination test. Normal seedlings were counted after six days, and results are expressed as percentages.
• Moisture content (MC)
Seed moisture content was measured with a hygrometer (Delver, model HD1021USB, Buenos Aires, Argentina) calibrated for soybean, using the low-temperature oven method (17 h at 103°C; ISTA, 2022). Results are expressed on a wet basis (%).
• Thousand seed weight (TSW)
Determined by weighing 1000 pure seeds according to ISTA (2022). Results are expressed in grams.
• Seed coat cracking
Seed coat cracking was assessed following BASF’s working protocol SQ-WI-02853 – QC – External Analysis – Soybean – AR. From the seed fraction retained on a 4.75 mm sieve, 100 g was weighed and damaged seeds were identified and separated. This damage was characterized by ruptures in the outer seed coat forming irregular cracks, usually perpendicular to the hilum. The fraction of damaged seeds was weighed, and results are expressed as percentages.
Experimental storage conditions
After the initial seed quality assessment, 200 g subsamples of each seed lot were placed in polyethene zipper bags (10 × 15 cm, 75 µ) sealed with cling film to prevent moisture loss and stored for six months at constant temperatures of 15°C ± 1°C or 25°C ± 1°C. During storage, bags were removed at regular intervals for AAT testing (ISTA, 2022). In the first year, tests were performed every two months; in the second year, every 20 days. Storage temperatures were monitored using a TPD8358 temperature datalogger (Lascar Electronic, USA). At the end of the storage period, seed weight was tested in selected samples, and no variation was detected compared with the initial weight, indicating that seed moisture was maintained throughout storage.
Modelling vigour loss
Seed vigour loss (quantified by AAT) during storage under different conditions of seed moisture, temperature and initial AAT was described using negative cumulative normal distribution curves, according to the following equation:
 \begin{equation}AA{T_p}\, = \,\Phi \left( {\left( {{P_{V50}} - P} \right)/\sigma } \right)*\,AA{T_{in}}\end{equation}
where:
• AATp = germination percentage after AAT at time p
• AATin = observed initial AAT for each seed lot
• Φ(x) = cumulative distribution function of the standard normal distribution
• PV50 = time required for AAT (i.e. germination) to decline to 50% of AATin (months)
• P = storage time (months)
• σ = standard deviation of the AAT decline distribution within the seed population (months)
Equation 1 was independently fitted to each seed lot and storage condition using the Generalized Reduced Gradient non-linear optimization algorithm implemented in the Solver tool of Microsoft Excel. Model parameters (PV50 and σ) were estimated by minimizing the Root Mean Square Error. Parameters derived from the fitted curves (PV50 and σ) were subsequently used to develop predictive equations describing the effects of storage conditions and seed quality attributes on vigour loss.
Statistical analysis
Standard errors (SE) of the estimated PV50 and σ values were obtained using a non-linear least-squares (nls) algorithm. These parameters were then analysed by Weighted Least Squares multiple linear regression, with the reciprocal of their SE as the weighting factor, to evaluate the effect of the studied variables on soybean seed vigour. All two-way and three-way interactions among the explanatory variables (seed moisture content, storage temperature and initial seed quality parameters) were evaluated during model development. Regression coefficients were tested for significance using a t-test, and global model performance was compared using an F-test (p < 0.05). Analyses were performed with InfoStat software (Di Rienzo et al., Reference Di Rienzo, Casanoves, Balzarini, González, Tablada and Robledo2020).
Results
All soybean seed lots had germination (G) above the Argentine commercial standard (>80%). Vigour (AATin) ranged from 68 to 94%, stink bug damage from 2 to 8%, mechanical damage from 6 to 15%, environmental damage from 15 to 28%, seed coat cracking from 4 to 31% and thousand-seed weight from 128.2 to 191.3 g, quality values typical of commercial seed lots in northwestern Argentina (Table 1).
Initial quality parameters of soybean seed lots (62R63 RSF, 2022) assessed through seed moisture content (% wet basis), germination percentage (G), vigour by accelerated ageing (AAT), percentage of mechanical, environmental and stink bug damage determined by the Tetrazolium test, seed coat cracking and thousand-seed weight (TSW). Fitted values of PV50, σ and R2 derived from Equation 1 under storage at 15 and 25°C

Table 1 Long description
Ten soybean seed lots, L1 through L10, are listed with seed moisture content percent, germination percent, accelerated ageing test percent, mechanical damage percent, environmental damage percent, stink bug damage percent, seed coat cracking percent, and thousand seed weight in grams. Each lot also has fitted values for PV50 in months, sigma, and R2 at storage temperatures of 15 and 25 degrees Celsius. Seed moisture content ranges from 10.1 percent in L1 to 13.9 percent in L8 and L9; germination ranges from 87 percent in L7 to 98 percent in L5; accelerated ageing test ranges from 68 percent in L10 to 94 percent in L1. Mechanical damage ranges from 6 percent in L3 to 15 percent in L2; environmental damage ranges from 15 percent in L8 to 28 percent in L6; stink bug damage ranges from 2 percent in L4 to 8 percent in L7. Seed coat cracking ranges from 4 percent in L3 to 31 percent in L5, and thousand seed weight ranges from 128.2 grams in L3 to 191.3 grams in L5. At 15 degrees Celsius, PV50 values by lot are 12.0 L1, 11.8 L2, 9.0 L3, 8.2 L4, 8.8 L5, 7.2 L6, 7.5 L7, 7.3 L8, 6.4 L9, and 5.9 L10; sigma ranges from 0.8 in L10 to 3.7 in L1, and R2 ranges from 0.36 in L2 to 1.00 in L4, L5, L8, L9, and L10. At 25 degrees Celsius, PV50 values by lot are 8.0 L1, 7.0 L2, 4.8 L3, 4.4 L4, 3.2 L5, 4.0 L6, 3.0 L7, 2.8 L8, 2.1 L9, and 1.7 L10; sigma ranges from 0.4 in L10 to 2.6 in L6, and R2 ranges from 0.81 in L1 to 1.00 in L5, L8, L9, and L10.
Vigour loss during storage increased with seed moisture content and storage temperature (Figure 1). Lots with <13% moisture stored at 15°C maintained high vigour (>70%) for six months, whereas those with >13% moisture fell below this threshold within four months. At 25°C, vigour declined more sharply, particularly at higher moisture contents; only seeds at 10% moisture retained high vigour throughout storage. Initial vigour had little effect on vigour loss within the range evaluated (AAT > 68%), except in seeds with >13% moisture stored at 25°C. Changes in seed vigour during storage, as measured by AAT, were well described by fitting equation 1 (Figure 1). Coefficients of determination (R2) ranged from 0.70 to 1.00 in 95% of cases (Table 1). The PV50 values obtained from curve fitting (equation 1) showed that the time required for vigour to decline to 50% of its initial level was inversely related to seed moisture content (ρ −0.57) and storage temperature (ρ −0.74).
(A) Dynamics of vigour (AAT, 72 h) during storage of different lots of soybean seeds (L1–L10; 62R63 RSF, 2022) at different seed moisture contents (10.1–13.9%), storage temperatures (15°C, blue; 25°C, red) and initial vigour (high to low, left to right). Symbols represent observed data. Dashed lines represent AAT values fitted using an optimization procedure based on Eq. 1 and solid lines, values predicted by Eq. 1 using PV50 and σ estimated from Eqs. 2 and 3, respectively. (B) Relationship between observed and predicted AAT values under both storage temperatures.

• Long description
10 line graphs arranged in a grid, labeled L1 through L10, each with the vertical axis label AAT 72 h percent and the horizontal axis label storage time months. Each graph shows two sets of points with error bars and multiple fitted and predicted curves. The horizontal axis shows 0, 2, 4, 6, 8. The vertical axis shows 0, 20, 40, 60, 80, 100. Each small graph includes a label MC followed by a percent value: L1 MC 10.1 percent, L2 MC 10.5 percent, L3 MC 11.4 percent, L4 MC 11.1 percent, L5 MC 11.7 percent, L6 MC 11.6 percent, L7 MC 11.6 percent, L8 MC 13.9 percent, L9 MC 13.9 percent, L10 MC 13.2 percent. In L1, points start near 90 to 95 at 0 months for both series; one series remains near 85 to 90 through 6 months, while the other declines to about 60 by 6 months. In L2, points start near 90 to 95 at 0 months; one series stays near 90 through 6 months, while the other declines to about 40 by 6 months. In L3, points start near 90 to 95 at 0 months; one series declines to about 70 by 6 months, while the other declines to about 20 by 6 months. In L4, points start near 90 to 95 at 0 months; one series declines to about 70 by 6 months, while the other declines to about 20 by 6 months. In L5, points start near 90 to 95 at 0 months; one series declines to about 65 by 6 months, while the other declines to about 0 by 6 months. In L6, points start near 90 to 95 at 0 months; one series declines to about 55 by 6 months, while the other declines to about 20 by 6 months. In L7, points start near 90 to 95 at 0 months; one series declines to about 55 by 6 months, while the other declines to about 20 by 6 months. In L8, points start near 90 to 95 at 0 months; one series declines to about 50 by 6 months, while the other declines to about 0 by about 4 months. In L9, points start near 90 to 95 at 0 months; one series declines to about 20 by 6 months, while the other declines to about 0 by about 3 months. In L10, points start near 90 to 95 at 0 months; one series declines to about 55 by 6 months, while the other declines to about 0 by about 4 months. The image B showing a scatter plot with the horizontal axis label observed AAT and the vertical axis label predicted AAT. Both axes show 0, 20, 40, 60, 80, 100. Points appear in two symbol types. A diagonal reference line runs from near 0, 0 to near 100, 100. Text inside the plot reads 15 degrees celsius r squared equals 0.85 and 25 degrees celsius r squared equals 0.85. A legend lists observed AAT 15 degrees celsius, fitted AAT 15 degrees celsius, predicted AAT 15 degrees celsius, observed AAT 25 degrees celsius, fitted AAT 25 degrees celsius, predicted AAT 25 degrees celsius.
Using the fitted parameters PV50 and σ, the seed population dynamics of vigour loss could be adequately described. Both were related to seed quality traits and storage conditions through multiple linear regression (Table 2). Analysis revealed significant negative associations between PV50 and storage conditions as well as seed damage (environmental, seed coat cracking, insect-related), with moisture content and storage temperature showing the strongest effects (p < 0.0001). In contrast, σ was significantly related only to seed moisture content, showing a linear relationship with a coefficient of determination (R2 = 0.51). Although all two-way and three-way interactions were initially evaluated, none significantly improved model performance (p > 0.05). Therefore, the final predictive equations included only main effects. Seed moisture content was expressed as log10(MC), following the seed viability equation of Ellis and Roberts (Reference Ellis and Roberts1980), in which the effect of moisture content on seed longevity is described on a logarithmic scale. Storage temperature was retained in the final model considering its biological relevance and potential predictive value, despite its limited effect on σ within the evaluated range.
Multiple linear regressions for estimating PV50 and σ as a function of storage conditions and seed quality

Table 2 Long description
Two multiple linear regression rows report coefficients plus or minus standard error for PV50 and for sigma, using predictors Intercept, Log moisture content, Temperature storage, Environmental damage, and Seed coat cracking, plus R2 and AIC. For PV50, the intercept is 54.14 plus or minus 4.19; log moisture content is minus 33.64 plus or minus 2.67 with four asterisks; temperature storage is minus 0.41 plus or minus 0.03 with four asterisks; environmental damage is minus 0.14 plus or minus 0.02 with three asterisks; seed coat cracking is minus 0.05 plus or minus 0.005 with one asterisk. PV50 reports R2 0.95 and AIC 85.81. For sigma, the intercept is 15.61 plus or minus 1.37; log moisture content is minus 12.58 plus or minus 1.09 with three asterisks; temperature storage is minus 0.02 plus or minus 0.003. Environmental damage and seed coat cracking are shown as not provided for sigma. Sigma reports R2 0.51 and AIC 77.54.
**** p < 0.0001; *** 0.0001 < p < 0.001; * p > 0.01.
Based on multiple regression coefficients, two linear equations were developed to model PV50 and σ in relation to seed moisture content (MC), storage temperature (T), environmental damage (ED) and seed coat cracking (SCC):
 \begin{align}
{P_{V50}}\, & = \,54.14\, - \,33.64\,*\,\log MC\, - \,0.41\,*\,T\, - \,0.14\,*\,ED\, \nonumber\\
& \quad {}- \,0.05\,*\,SCC
\end{align}
 \begin{equation}\sigma \, = \,15.61\, - \,12.58\,*\,\log \,MC\, - \,0.02\,*\,T\end{equation}
Parameters (PV50 and σ) estimated by multiple linear regression using Equations 2 and 3 were used in Equation 1 to predict vigour decline in soybean seed lots of cultivar 62R63 RSF produced in 2022. The results showed that vigour decline was accurately predicted for these seed lots, which were the same lots used for model development. (R2 = 0.85–0.89; Figure 1B).
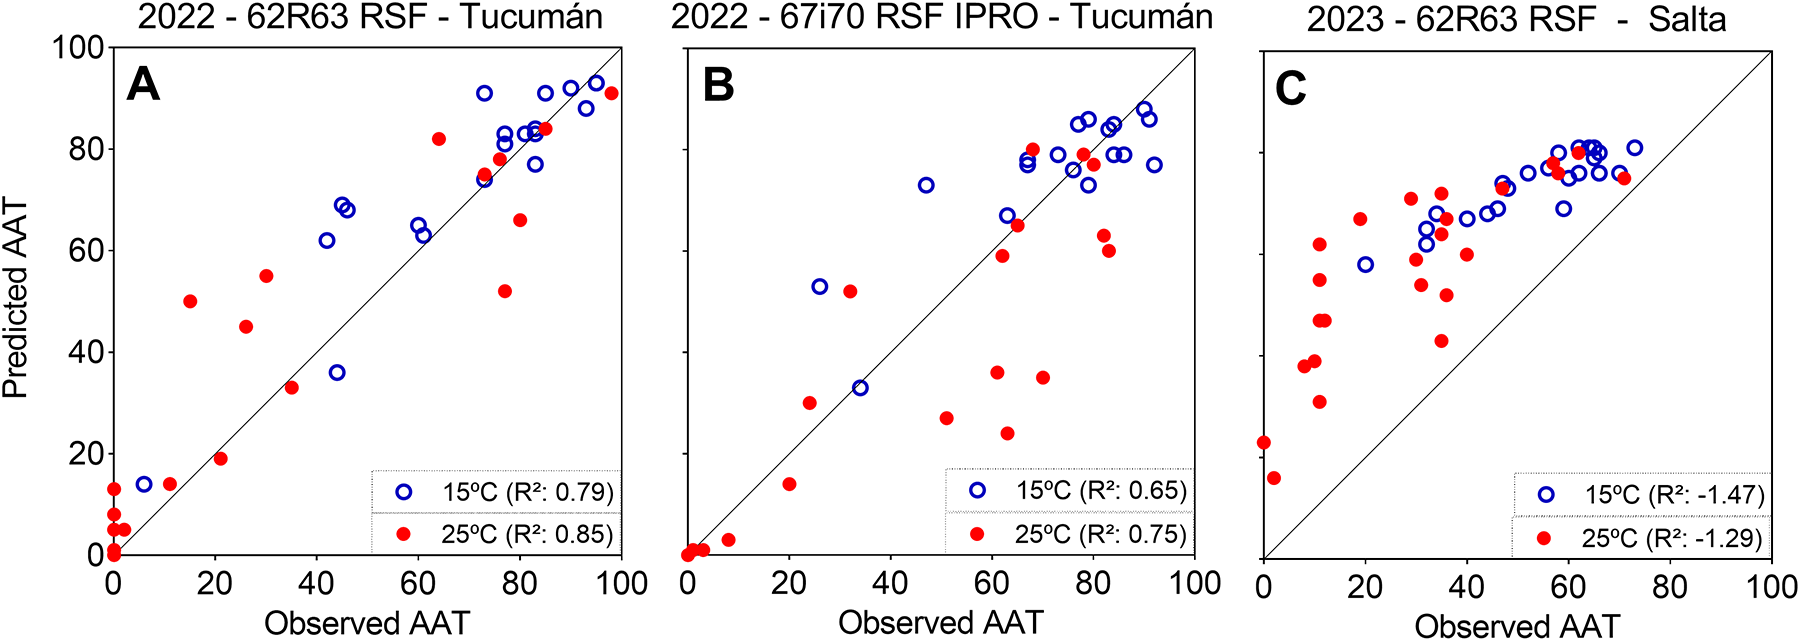
The model (equations 1–3) also adequately described vigour loss in seeds stored at different moisture levels at 15 and 25°C for two cultivars produced in the same year in Tucumán (Figures 2A, B and Figure 3A, B; Table 3). In contrast, for seed lots produced in 2023 in Salta, which exhibited high levels of stink bug and seed coat cracking, the model was less accurate, overestimating vigour values (Figures 2C and 3C; Table 3).
Dynamics of soybean seed vigour (AAT) during storage of independent soybean seed lots (L11–L24) at 15°C (blue) and 25°C (red). Symbols represent observed data and solid lines represent values predicted by Eq. 1 using PV50 and σ estimated from Eqs. 2 and 3, respectively. Panels show lots of cultivars: (A) 62R63 RSF, Tucumán 2022; (B) 67i70 RFS IPRO, Tucumán 2022; and (C) 62R63 RSF, Salta 2023.
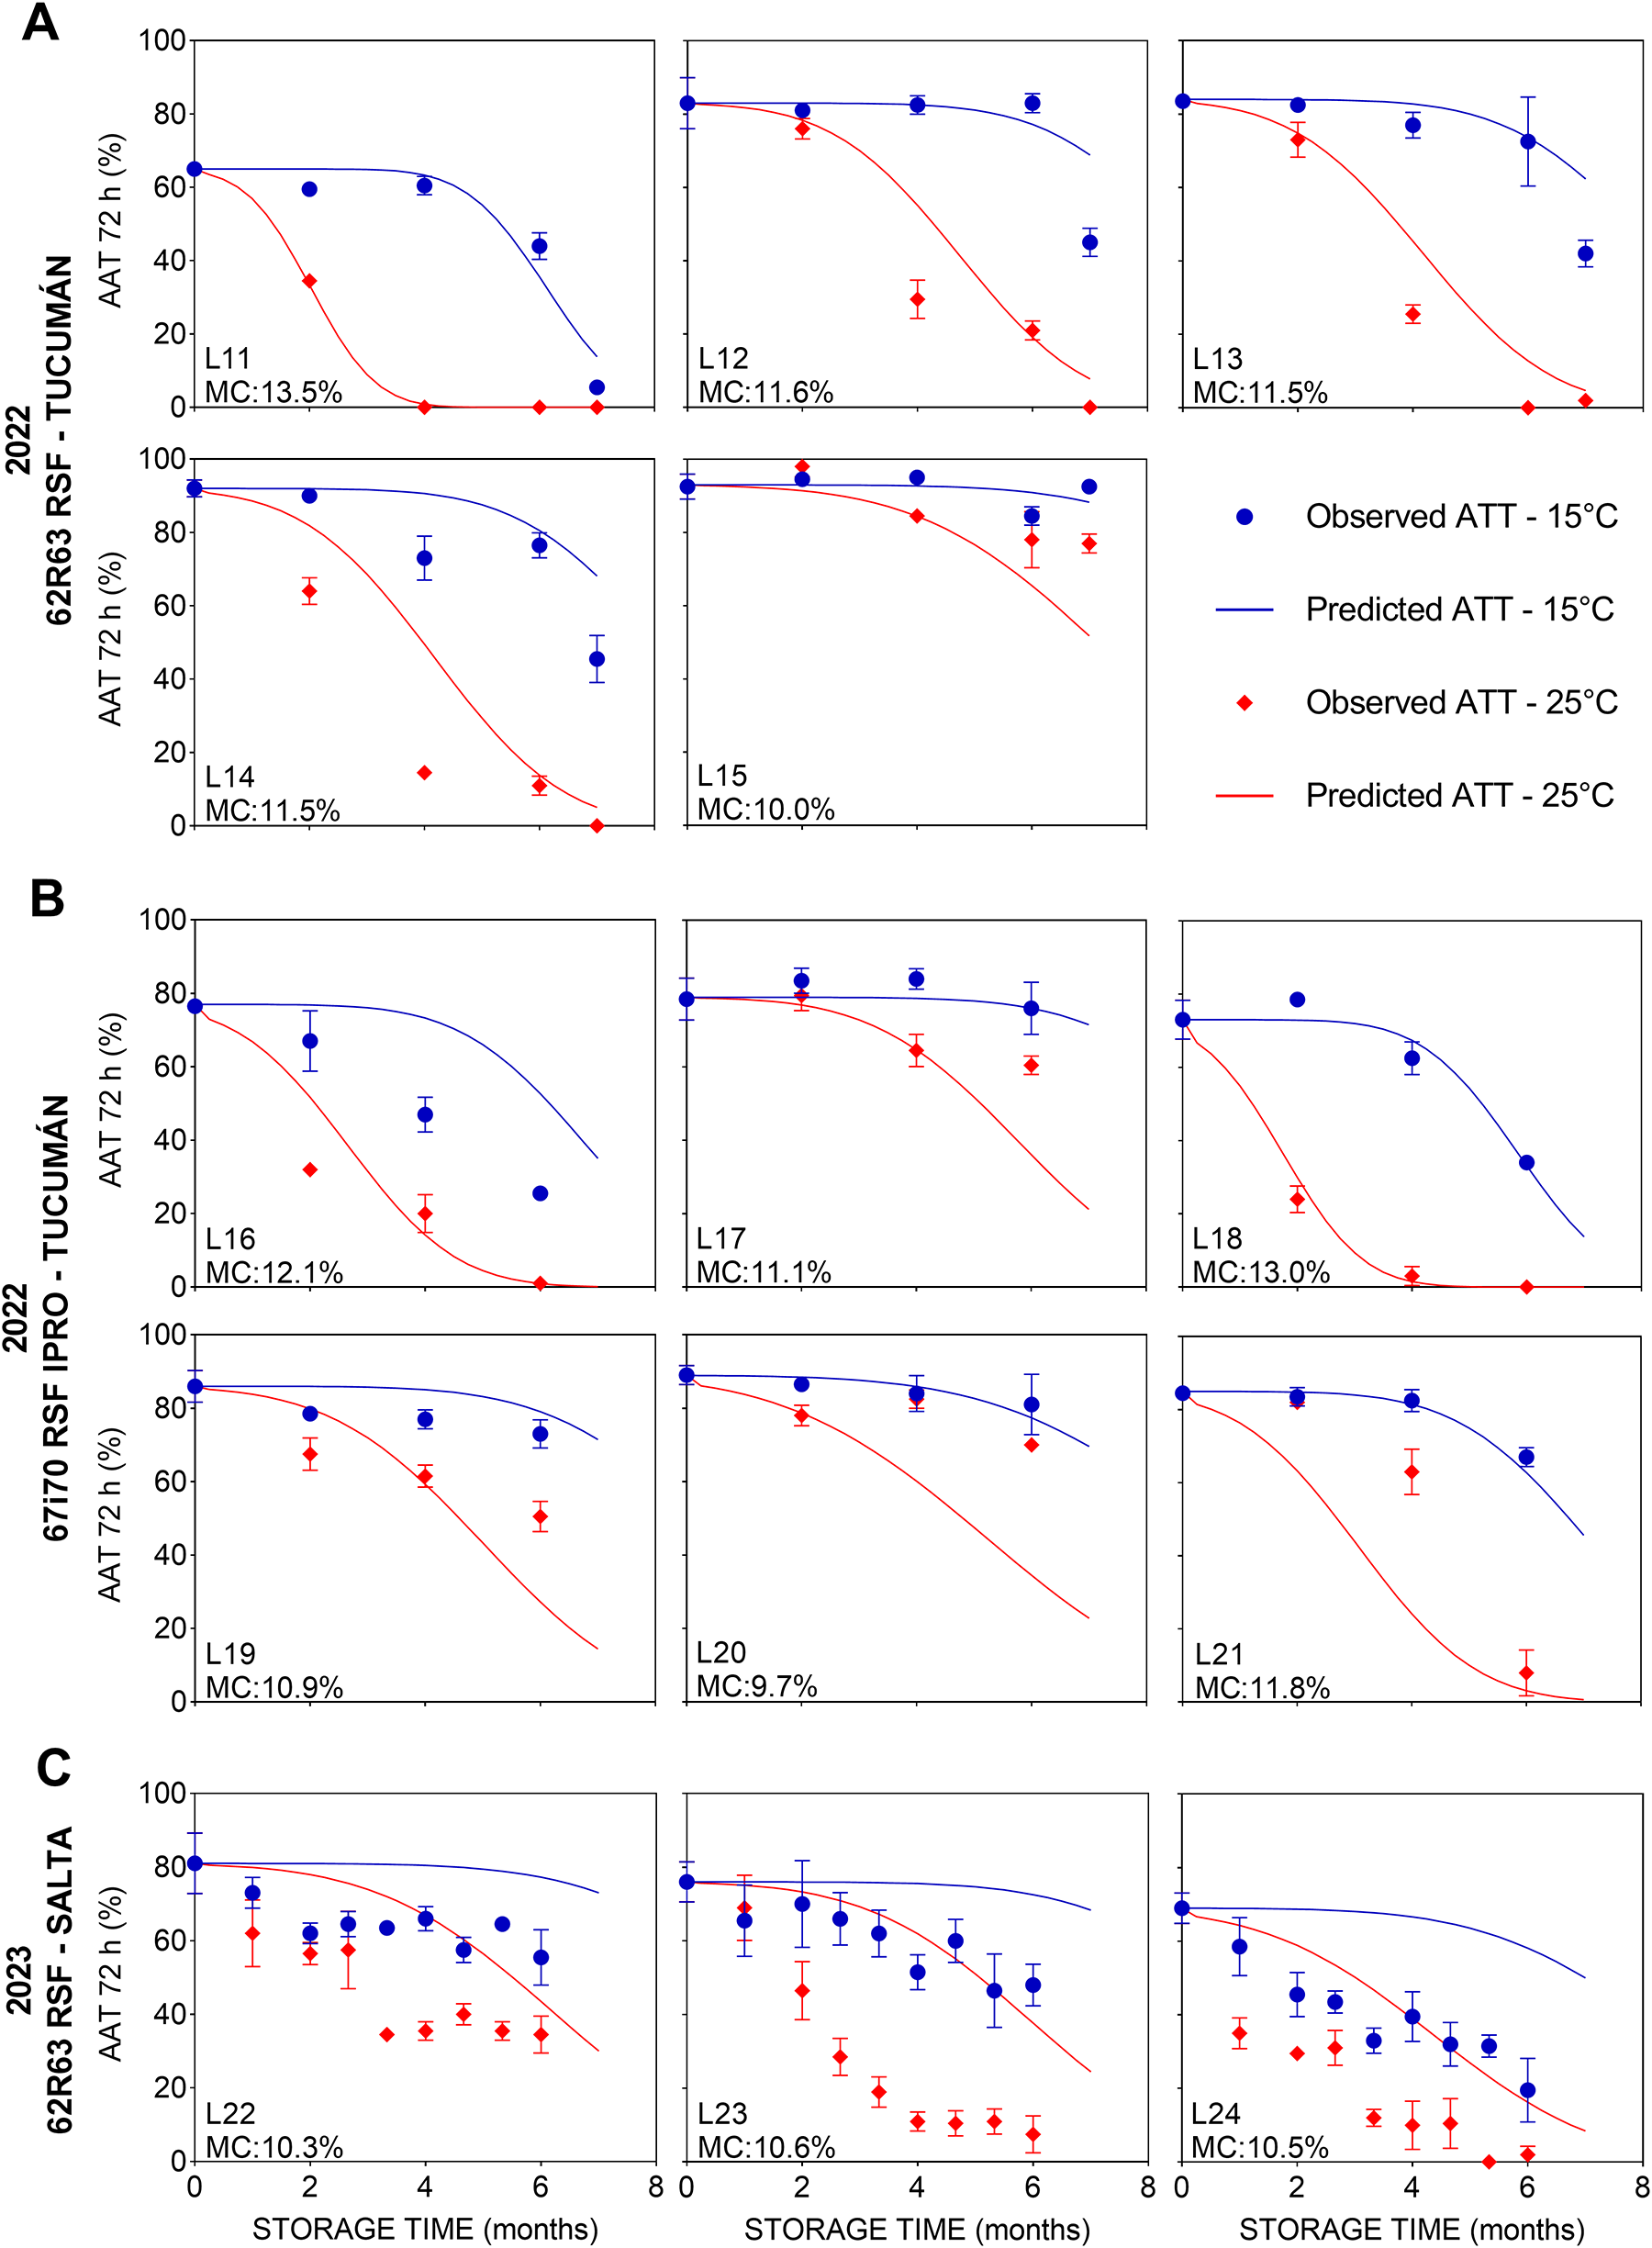
Figure 2 Long description
Multiple line graphs divided into three sections labeled A, B and C. Each section represents different soybean seed lots stored at 15 degrees C and 25 degrees C. The horizontal axis in each graph is labeled Storage Time (months) ranging from 0 to 6 months. The vertical axis is labeled ATT (%) ranging from 0 to 100 percent. Section A shows seed lots 62R63 RSF from Tucuman 2022 with moisture content (MC) values: L11 at 13.5 percent, L12 at 11.6 percent, L13 at 11.5 percent, L14 at 11.5 percent and L15 at 10.0 percent. Section B displays seed lots 67i70 RFS IPRO from Tucuman 2022 with MC values: L16 at 12.1 percent, L17 at 11.1 percent, L18 at 13.0 percent, L19 at 10.9 percent, L20 at 9.7 percent and L21 at 11.8 percent. Section C illustrates seed lots 62R63 RSF from Salta 2023 with MC values: L22 at 10.3 percent, L23 at 10.6 percent and L24 at 10.5 percent. Each graph includes observed and predicted ATT values at both temperatures, represented by different symbols and lines. Observed ATT at 15 degrees C is marked with blue circles, predicted ATT at 15 degrees C with blue lines, observed ATT at 25 degrees C with red circles and predicted ATT at 25 degrees C with red lines. The graphs show the decline in vigour over time for each seed lot at both temperatures.
Relationship between observed and predicted AAT values for independent validation seed lots (L11–L24) stored at 15 and 25°C. (A) 62R63 RSF, Tucumán 2022; (B) 67i70 RFS IPRO, Tucumán 2022; and (C) 62R63 RSF, Salta 2023.

Figure 3 Long description
A showing a scatter plot with the x-axis labeled, Observed AAT and the y-axis labeled, Predicted AAT. The x-axis ranges from 0 to 100 with labeled ticks at 0, 20, 40, 60, 80 and 100. The y-axis ranges from 0 to 100 with labeled ticks at 0, 20, 40, 60, 80 and 100. A diagonal reference line runs from the lower left to the upper right. Two point series are shown with a legend listing, 15 degrees C and, 25 degrees C. Points appear across the full range, including points near the lower left around observed 0 to 20 and predicted 0 to 20 and multiple points near the upper right around observed 80 to 100 and predicted 80 to 100. B showing a scatter plot with the x-axis labeled, Observed AAT and the y-axis labeled, Predicted AAT. The x-axis ranges from 0 to 100 with labeled ticks at 0, 20, 40, 60, 80 and 100. The y-axis ranges from 0 to 100 with labeled ticks at 0, 20, 40, 60, 80 and 100. A diagonal reference line runs from the lower left to the upper right. Two point series are shown with a legend listing, 15 degrees C and, 25 degrees C. Points are concentrated in the upper right region around observed 70 to 100 and predicted 70 to 100, with additional points in the mid range around observed 40 to 70 and predicted 40 to 80. C showing a scatter plot with the x-axis labeled, Observed AAT and the y-axis labeled, Predicted AAT. The x-axis ranges from 0 to 100 with labeled ticks at 0, 20, 40, 60, 80 and 100. The y-axis ranges from 0 to 100 with labeled ticks at 0, 20, 40, 60, 80 and 100. A diagonal reference line runs from the lower left to the upper right. Two point series are shown with a legend listing, 15 degrees C and, 25 degrees C. Many points lie above the diagonal line, including points with observed values around 20 to 60 paired with predicted values around 40 to 90 and points near the upper right around observed 70 to 100 and predicted 70 to 100.
Initial quality parameters of soybean seed lots (62R63 RSF and 67i70 RFS IPRO) produced in Tucumán (T) and Salta (S), 2022–2023. Assessed through seed moisture content (% wet basis), germination percentage (G), vigour by accelerated ageing (AAT), percentage of mechanical, environmental and stink bug damage determined by the Tetrazolium test, seed coat cracking and thousand-seed weight (TSW)
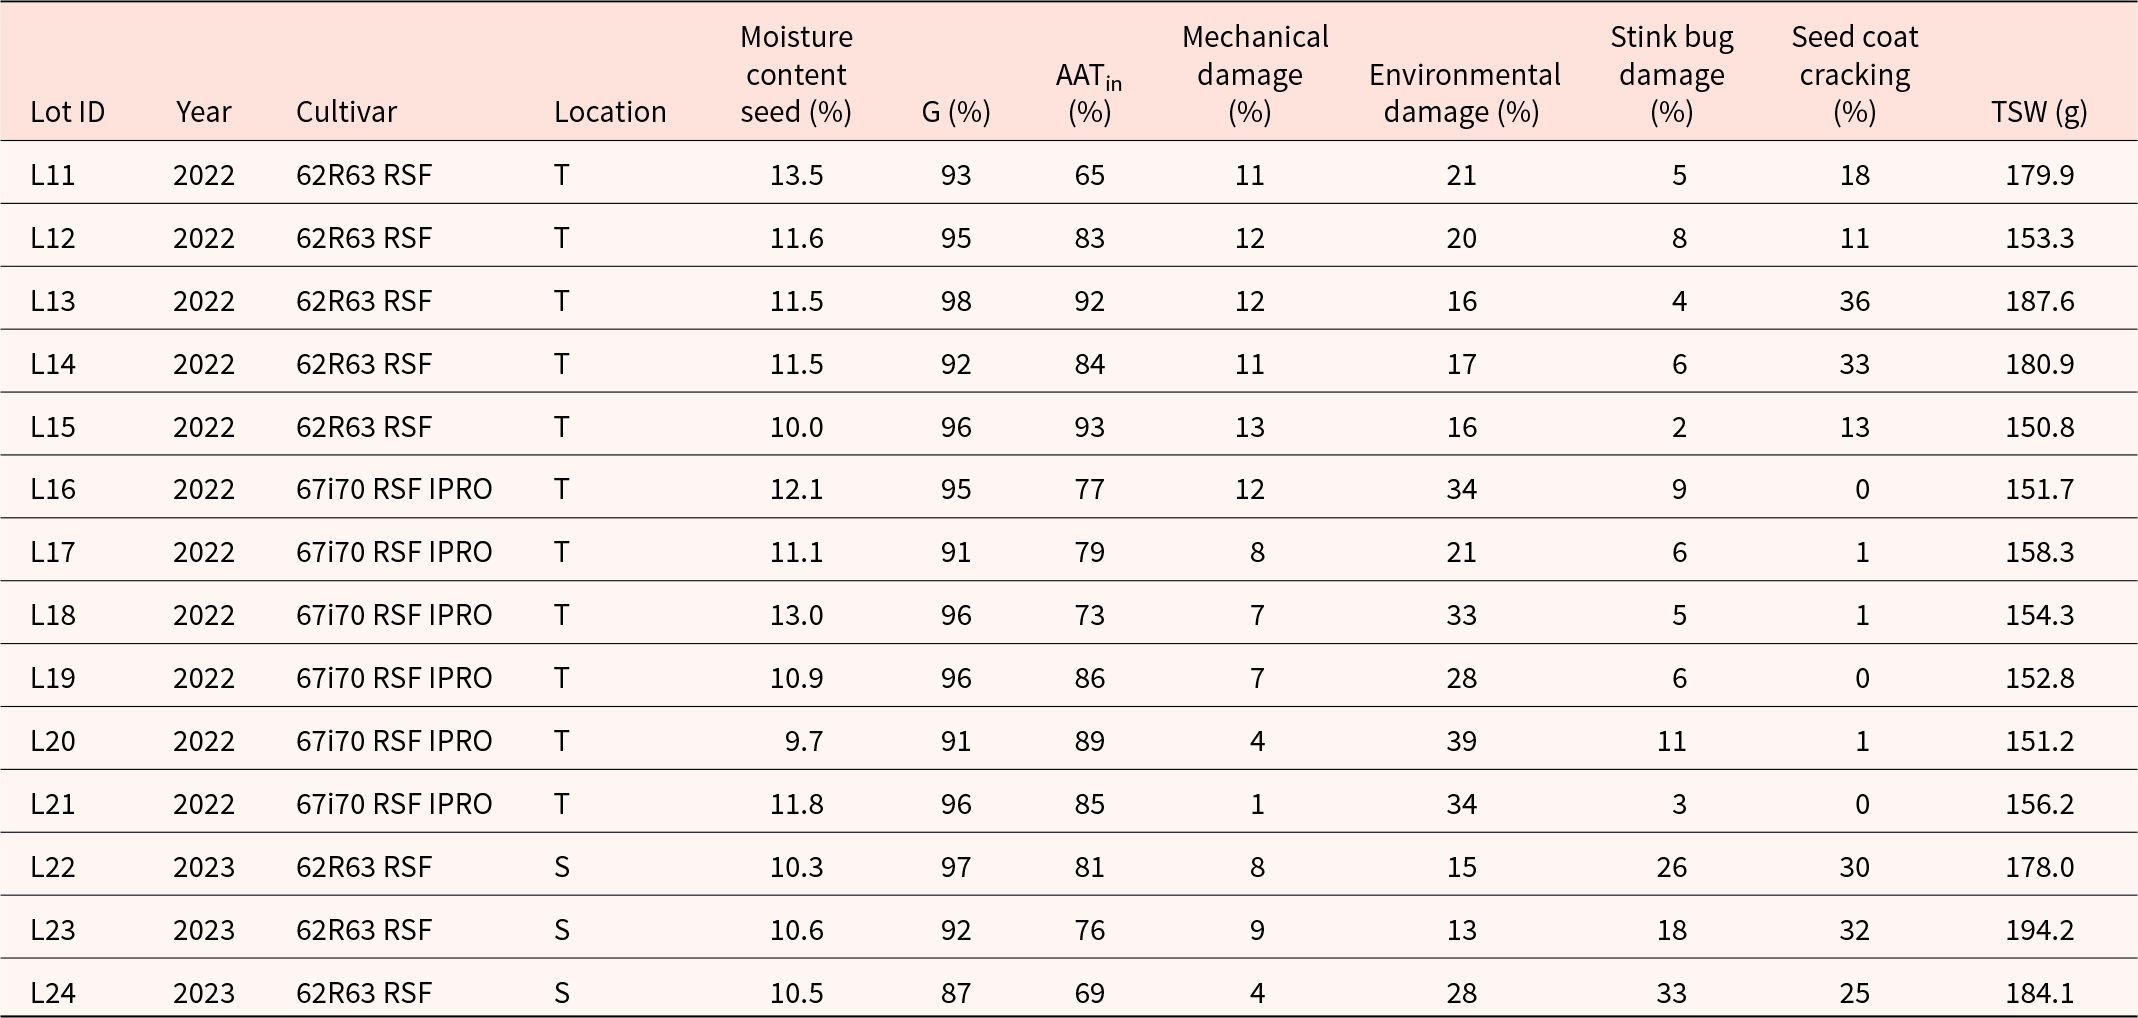
Table 3 Long description
Fourteen soybean seed lots are listed by lot ID, year, cultivar, and location, with measurements for seed moisture content percent, germination percent, AATin percent, mechanical damage percent, environmental damage percent, stink bug damage percent, seed coat cracking percent, and TSW in grams. Lots L11 to L21 are from 2022 in location T, with cultivar 62R63 RSF for L11 to L15 and 67i70 RSF IPRO for L16 to L21. For 2022 in T, moisture content ranges from 9.7 to 13.5 percent, germination from 91 to 98 percent, and AATin from 65 to 93 percent. In 2022 in T, mechanical damage ranges from 1 to 13 percent, environmental damage from 16 to 39 percent, stink bug damage from 2 to 11 percent, seed coat cracking from 0 to 36 percent, and TSW from 150.8 to 187.6 grams. Lots L22 to L24 are from 2023 in location S, all cultivar 62R63 RSF, with moisture content 10.3 to 10.6 percent, germination 69 to 81 percent, and AATin 87 to 97 percent. In 2023 in S, mechanical damage is 4 to 9 percent, environmental damage 13 to 28 percent, stink bug damage 18 to 33 percent, seed coat cracking 25 to 32 percent, and TSW 178.0 to 194.2 grams.
Equation 2 was further used to simulate the effects of seed moisture content and storage temperature on PV50 values, fixing damage levels at low and high, to assess how storage conditions could be optimized to preserve lot vigour. For seed lots with low-damage levels (Figure 4A), greater flexibility was observed in selecting moisture and temperature conditions while maintaining vigour for longer periods (PV50 = 5–10 months). In contrast, for lots with high levels of environmental damage and seed coat cracking (Figure 4B), storage conditions needed to be strictly controlled at very low moisture and temperature levels to effectively preserve vigour.
Simulation using Eq. 2 of seed moisture content (9–14%) and storage temperature (10–35°C) effects on PV50 under two damage scenarios: (A) low-damage levels (10% environmental damage, 0% seed coat cracking) and (B) high damage levels (30% environmental damage, 30% seed coat cracking). The white areas indicate PV50 values lower than 0.

Figure 4 Long description
A heatmap with seed moisture content on the horizontal axis ranging from 9 to 14 percent and storage temperature on the vertical axis ranging from 10 to 35 degrees Celsius. The heatmap illustrates Pv50 categories in months: 0 to 5, 5 to 10, 10 to 15 and 15 to 20. Higher temperatures and moisture content shift Pv50 to lower months. Panel B also displays a heatmap with the same axes and ranges, but under higher damage levels. The Pv50 categories are similarly mapped, showing stricter conditions needed to maintain vigour. The legend indicates color mapping for each Pv50 range: 0 to 5 months, 5 to 10 months, 10 to 15 months and 15 to 20 months. The panels compare how different damage scenarios affect storage conditions and Pv50 outcomes.
Discussion
In this study, the quantitative effects of storage temperature, seed moisture content, initial seed vigour and damage levels on soybean seed vigour loss measured by AAT during storage were evaluated. As widely documented, soybean seed vigour declines more rapidly with increasing seed moisture and/or storage temperature (Ellis et al., Reference Ellis, Osei-bonsu and Roberts1982; Dickie et al., Reference Dickie, Ellis, Kraak, Ryder and Tompsett1990; Marcos-Filho, Reference Marcos-filho2015a; Ferreira et al., Reference Ferreira, Villela, Meneghello and Soares2017), making these the most influential factors in this process (Figure 1). Another factor usually affecting the rate and extent of deterioration is the initial quality of the seed lot (Bewley et al., Reference Bewley, Bradford, Hilhorst and Nonogaki2013; Marcos-Filho, Reference Marcos-filho2015a; Ellis, Reference Ellis2022). However, in the present work, the effect of initial AAT vigour did not appear to significantly influence vigour loss dynamics. It is important to note that the AAT values used in this study were always higher than 68%, as values below this threshold lead to rejection at the industrial level. The use of seed lots with lower initial AAT values would likely have resulted in a significant effect of this factor.
Seed coat cracking and environmental damage were negatively correlated with vigour loss during storage (Table 2), consistent with previous studies showing that environmental damage and its progression affect soybean seed viability and vigour (Moreano et al., Reference Moreano, Braccini, Scapim, Krzyzanowski, França-neto and Marques2011; Forti et al., Reference Forti, Carvalho, Ossamu Tanaka and Cicero2013). The negative impact of seed coat cracking may be related to disruptions in seed coat integrity, which reduce the physiological potential of the seed (De Souza and Marcos-Filho, Reference De Souza and Marcos-filho2001; Torres Licursi Vieira et al., Reference Torres Licursi Vieira, Barbosa, Barbosa and Vieira2013; Teixeira et al., Reference Teixeira, Zorato and Meneghello2024; Barrionuevo et al., Reference Barrionuevo, Panho, Meira, Menegazzi, Marcante, Linhares, Nascimento, Finatto and Benin2025). Previous studies examined these effects in isolated cases but did not establish a quantitative relationship between these damages and vigour loss during storage. It is important to note that, although we measured several seed quality attributes to represent the main physiological differences among seed lots, other unmeasured seed lot characteristics may have also influenced the observed responses.
Based on the observed data, negative cumulative normal distribution equations (equation 1) and multiple linear regressions (equations 2 and 3) were fitted to quantify the relative effects of each factor on vigour decrease and to develop a predictive model of vigour dynamics under different storage conditions and damage levels (Table 2). The model (equations 1–3) provides a robust framework for describing vigour loss dynamics during storage in a real commercial seed production situation, capturing population variability within seed lots. The PV50 parameter, analogous to P50, derived from the fitted curves and previously used in seed longevity models (Hay et al., Reference Hay, Valdez, Lee and Santa Cruz2018), proved effective also for quantifying vigour changes, allowing differentiation of seed lots with similar quality (Table 1). Similar population-based models have been used to predict seed viability but have not previously been applied to vigour parameters (Hay et al., Reference Hay, Davies, Dickie, Merritt and Wolkis2022), although the model developed by Bradford et al. (Reference Bradford, Tarquis and Durán1993) can be used to predict changes in germination rate during storage, which could potentially be used as a seed vigour index (Bradford and Bello, Reference Bradford, Bello, Buitink and Leprince2022). In population-based models, such as the one developed in this paper, changes in seed population behaviour can be accounted for by independent variation in the mean (i.e. PV50), the standard (σ), or both (Bradford, Reference Bradford2002). The present model indicates that PV50 (i.e. the time required for initial vigour to decrease by 50%) and σ (i.e. the distribution of times for vigour to decline within the seed population) are independently affected by different factors (Table 2). While PV50 is affected by storage conditions (temperature and seed moisture content) and seed quality parameters (i.e. environmental damage and seed coat cracking), σ is only affected by storage conditions, particularly seed moisture content.
The model accurately described vigour behaviour for the original dataset (Figure 1) and predicted well for independent datasets from two cultivars and locations (Figure 2A, B). Egli et al. (Reference Egli, White and TeKrony1978) also reported no cultivar effect on changes in seed vigour during storage. This highlights the potential to apply the developed model to other genotypes and production regions. However, it was less precise for lots with high stink bug damage and seed coat cracking (Figure 2C), likely because it was calibrated using low-damage lots. This limitation highlights the need to account for seed damage levels when optimizing storage practices to preserve vigour (Figure 4). It is important to note that the model’s lack of accuracy in predicting this specific situation does not undermine its potential use in real production systems. In most cases, harvested seed lots exhibit quality parameters similar to those of the lots used to develop the model (seed lots L1–L10), and it is uncommon to observe such high levels of bug damage and seed coat cracking as those recorded in the lot harvested in Salta (seed lots L22–L24). On the other hand, since the model was developed with data from seeds stored at only two temperatures (15 and 25 °C), extrapolation beyond this range requires caution. Testing vigour loss under a more comprehensive combination of temperatures and seed moisture contents is required to predict seed vigour loss across a broader range of storage conditions.
Vigour as a seed quality parameter is increasingly recognized in the seed industry and represents a key differentiator for companies. Although no official minimum vigour standards exist for commercialization, companies maintain internal thresholds. Modelling vigour – a more sensitive parameter than germination – allows early prediction of deterioration by the seed industry, providing valuable information for strategic management across production stages. The model presented in this work can infer storage potential via vigour PV50, supporting internal quality control by adjusting monitoring intervals: shorter for lots with low PV50 or longer for those with high PV50. Additionally, PV50 enables comparison of lots with similar quality and tailoring of storage conditions based on available options. Simulations further clarify how individual factors affect storability and vigour loss under specific conditions, facilitating interpretation and practical use of routine seed quality tests. Overall, this approach supports more informed decisions regarding conditioning, storage and marketing of seed lots, with the goal of preserving their vigour.
Funding statement
This research was financially supported by the Agencia Nacional de Promoción de la Investigación, el desarrollo tecnológico y la innovación, grant no PICT 2021 00563; the Universidad de Buenos Aires through the UBACYT Project no 20020220100255BA and the company Estancia El Azul S.A.
Competing interests
None.




 Open access

