Introduction
Cross-sectional magnetic resonance imaging (MRI) studies in early-onset schizophrenia patients have consistently demonstrated decreases in whole-brain volume, in particular grey-matter volume, as well as increases in ventricular volume (for meta-analyses, see Steen et al. Reference Steen, Mull, McClure, Hamer and Lieberman2006; Vita et al. Reference Vita, de Peri, Silenzi and Dieci2006). The volume loss can at least partly be explained by cortical thinning in the frontotemporal cortices (Schultz et al. Reference Schultz, Koch, Wagner, Roebel, Schachtzabel, Gaser, Nenadic, Reichenbach, Sauer and Schlösser2010), anterior cingulate cortex (Fornito et al. Reference Fornito, Yucel, Wood, Adamson, Velakoulis, Saling, McGorry and Pantelis2008) and the right insular cortex (Roiz-Santianez et al. Reference Roiz-Santianez, Perez-Iglesias, Quintero, Tordesillas-Gutierrez, Mata, Ayesa, Sánchez, Gutiérrez, Sanchez, Vázquez-Barquero and Crespo-Facorro2010). Moreover, a recent study in first-episode schizophrenia patients reported regional cortical surface area reduction in patients, while there were no differences in cortical thickness between patients and healthy controls (Gutiérrez-Galve et al. Reference Gutiérrez-Galve, Wheeler-Kingshott, Altmann, Price, Chu, Leeson, Lobo, Barker, Barnes, Joyce and Ron2010).
These findings convincingly show that brain abnormalities are already present in the early stages of the illness; however, it is still unclear whether these changes are influenced by factors related to the illness such as the use of antipsychotic medication (Navari & Dazzan, Reference Navari and Dazzan2009; Moncrieff & Leo, Reference Moncrieff and Leo2010) or other confounders such as level of education or IQ (Narr et al. Reference Narr, Woods, Thompson, Szeszko, Robinson, Dimtcheva, Gurbani, Toga and Bilder2007). To rule out an effect of medication, studies in never-medicated patients are needed. So far, findings of these studies have been inconsistent. Chua et al. (Reference Chua, Cheung, Cheung, Tsang, Chen, Wong, Cheung, Yip, Tai and Suckling2007) reported grey- and white-matter reductions after correcting for whole-brain volume in 26 medication-naive patients compared to 38 healthy controls. Others failed to find any global brain volume difference between 38 patients and 43 controls (Ebdrup et al. Reference Ebdrup, Glenthoj, Rasmussen, Aggernaes, Langkilde, Paulson, Lublin, Skimminge and Baaré2010), while we only found enlargement of the third ventricle (Cahn et al. Reference Cahn, Hulshoff Pol, Bongers, Schnack, Mandl, van Haren, Durston, Koning, van der Linden and Kahn2002) in 20 medication-naive patients with schizophrenia compared to 20 controls. Despite little evidence for loss in global brain volumes, studies do report cortical thickness reductions in medication-naive patients, primarily in the prefrontal cortex (Narr et al. Reference Narr, Bilder, Toga, Woods, Rex, Szeszko, Robinson, Sevy, Gunduz-Bruce, Wang, DeLuca and Thompson2005a , Reference Narr, Toga, Szeszko, Thompson, Woods, Robinson, Sevy, Wang, Schrock and Bilder b ; Venkatasubramanian et al. Reference Venkatasubramanian, Jayakumar, Gangadhar and Keshavan2008) but also in the temporal, parietal and occipital cortices (Narr et al. Reference Narr, Bilder, Toga, Woods, Rex, Szeszko, Robinson, Sevy, Gunduz-Bruce, Wang, DeLuca and Thompson2005a , Reference Narr, Toga, Szeszko, Thompson, Woods, Robinson, Sevy, Wang, Schrock and Bilder b ). Based on these findings, subtle brain abnormalities appear to be present, at least in focal areas of the cortical mantle at the onset of the illness.
Apart from medication, level of general cognitive function may confound the differences in brain volume between schizophrenia patients and healthy individuals. Whole-brain and grey-matter volume have been found to be related to IQ in patients with schizophrenia (Baare et al. Reference Baare, Hulshoff Pol, Hijman, Mali, Viergever and Kahn1999; Toulopoulou et al. Reference Toulopoulou, Grech, Morris, Schulze, McDonald, Chapple, Rabe-Hesketh and Murray2004; Antonova et al. Reference Antonova, Kumari, Morris, Halari, Anilkumar, Mehrotra and Sharma2005; for a review, see Antonova et al. Reference Antonova, Sharma, Morris and Kumari2004) as well as in healthy subjects (Andreasen et al. Reference Andreasen, Flaum, Swayze, O'Leary, Alliger, Cohen, Ehrhardt and Yuh1993; Narr et al. Reference Narr, Woods, Thompson, Szeszko, Robinson, Dimtcheva, Gurbani, Toga and Bilder2007). The association between brain volume and intelligence is of genetic origin (Posthuma et al. Reference Posthuma, De Geus, Baare, Hulshoff Pol, Kahn and Boomsma2002).
In most studies, patients do not obtain the same level of education as the control group, while the groups are otherwise matched for age, sex and parental level of education or socio-economic status. Indeed, decline of cognitive function in subjects who later develop schizophrenia is present a decade before the onset of the first psychotic symptoms (van Oel et al. Reference van Oel, Sitskoorn, Cremer and Kahn2002) and precedes the onset of schizophrenia by many years (Reichenberg et al. Reference Reichenberg, Caspi, Harrington, Houts, Keefe, Murray, Poulton and Moffit2010; for a meta-analysis, see Woodberry et al. Reference Woodberry, Giuliano and Seidman2008).
We set out to recruit a sample of antipsychotic-naive first-episode schizophrenia patients and healthy subjects to assess whether the brain abnormalities (global volumes, cortical thickness and cortical surface) are already present before the intake of antipsychotic medication and to investigate how the brain abnormalities are related to IQ.
Method
Patients with first-episode non-affective psychosis (n=20), recruited from the Genetic Risk and Outcome of Psychosis (GROUP) study at the University Medical Center Utrecht, Utrecht, the Netherlands, and 26 healthy comparison subjects were included in the study. The study received approval of the local ethical committee. After complete description of the study to the subjects, written informed consent was obtained.
Subjects were physically healthy and did not have a history of head injury. All subjects were assessed with the Comprehensive Assessment of Symptoms and History (Andreasen et al. Reference Andreasen, Flaum and Arndt1992) by two trained raters who independently determined the diagnosis and achieved consensus afterwards. Drug use was assessed using the Composite International Diagnostic Interview (Robins et al. Reference Robins, Wing, Wittchen, Helzer, Babor, Burke, Farmer, Jablenski, Pickens, Regier, Sartorius and Towle1988). Information was obtained on the average number of alcohol consumptions per week during the month prior to the MRI scan and lifetime. Two patients and two healthy comparison subjects met the Diagnostic and Statistical Manual of Mental Disorders, fourth edition (DSM-IV) criteria for alcohol abuse during the month preceding the MRI scan, whereas five patients and four healthy comparison subjects met these criteria lifetime. The two groups did not differ significantly on average number of alcohol consumptions per week.
In the patient group, severity of illness was measured with the Positive and Negative Syndrome Scale (PANSS; Kay et al. Reference Kay, Fiszbein and Opler1987), and the duration of untreated psychosis was calculated. Moreover, the intelligence quotient (IQ) of each subject was estimated based on four subtests of the Dutch version of the Wechsler Adult Intelligence Scale (Information, Arithmetics, Block design and digit symbol coding). At baseline (T0), 19 patients fulfilled DSM-IV criteria for schizophrenia, and one for schizo-affective disorder. All patients were antipsychotic-naive at inclusion (three patients received medication, respectively for 2, 3 and 6 days before the MRI scan). The healthy comparison subjects fulfilled criteria for ‘never mentally ill’. The groups were matched for sex, age, handedness and socio-economic status of their parents (expressed as the highest level of education completed by one of the parents).
MRI procedures and measurements
Structural MRI scans of the whole brain were obtained on a 1.5 T Achieva scanner (Philips, the Netherlands). A three-dimensional T1-weighted coronal spoiled-gradient echo scan of the whole head [256×256 matrix, echo time (TE)=4.6 ms, repetition time (TR)=30 ms, flip angle=30°, 160–180 contiguous slices; 1×1×1.2 mm3 voxels, field of view (FOV)=256 mm/70%] was acquired. Furthermore, a single-shot echo planar imaging scan was made as part of a diffusion tensor imaging (DTI)-series [sensitivity encoding (SENSE) factor 2.5, flip angle 90°, 60 transverse slices of 2.5 mm, no gap, 128×96 acquisition matrix, FOV 240 mm, TE=78 ms] together with a magnetization transfer imaging (MTI) scan (60 transverse slices of 2.5 mm, no gap, 128×96 acquisition matrix, FOV 240 mm, flip angle 8°, TE=4.5 ms, TR=37.5 ms).
Processing was done on the computer network of the Department of Psychiatry at the University Medical Center Utrecht. All images were coded to ensure investigator blindness to subject identification and diagnosis.
Volumetric processing
Our imaging protocol made use of T2-weighted contrast of the DTI-B0 and MTI-series for segmentation of the intracranial volume. The DTI-B0 and MTI images were superimposed onto the T1-weighted image to remove non-brain tissue voxels, as described previously (Peper et al. Reference Peper, Brouwer, Schnack, van Baal, van Leeuwen, van den Berg, Delemarre-Van de Waal, Janke, Collins, Evans, Boomsma, Kahn and Hulshoff Pol2008). The T1-weighted images were automatically put into Talairach orientation without scaling, by registering them to a model brain. The translation and rotation parameters of this registration were then applied to the intracranial segment (Maes et al. Reference Maes, Collignon, Vandermeulen, Marchal and Suetens1997). The intracranial segment served as a mask for all further segmentation steps. The T1-weighted images were corrected for field inhomogeneities using the N3 algorithm (Sled et al. Reference Sled, Zijdenbos and Evans1998). Our automatic image-processing pipeline was used for segmentation of total brain, grey matter and white matter of the whole brain (Brouwer et al. Reference Brouwer, Hulshoff Pol and Schnack2010). In short, pure grey- and white-matter intensities were directly estimated from the image. The amounts of pure and partial volume voxels were modelled in a non-uniform partial volume density, which is fitted to the intensity histogram. Expected tissue fractions, based on the pure intensities and the partial volume density, were subsequently computed in each voxel within the cerebrum. Grey- and white-matter volumes were calculated by summating the fractions of grey and white matter over all voxels. Total-brain volume was calculated by adding the grey- and white-matter segments.
Lateral and third ventricle and cerebellum volumes were assessed. The software included histogram analysis, mathematical morphology operations and anatomical knowledge-based rules to connect all voxels of interest, as was validated before (Schnack et al. Reference Schnack, Hulshoff, Baare, Viergever and Kahn2001). The intracranial mask, ventricle and cerebellum segments were visually checked and edited if necessary.
Cortical thickness and surface
To compute cortical thickness and cortical surface, the binarized grey- and white-matter segments were used as input for the custom implementation of the Constrained Laplacian Anatomic Segmentation using Proximity (CLASP) algorithm designed at the McConnell Brain Imaging Centre of the Montreal Neurological Institute (MacDonald et al. Reference MacDonald, Kabani, Avis and Evans2000; Kabani et al. Reference Kabani, Le Goualher, MacDonald and Evans2001; Kim et al. Reference Kim, Singh, Lee, Lerch, Ad-Dab'bagh, MacDonald, Lee, Kim and Evans2005). A three-dimensional surface comprising 81 920 polygons per hemisphere was fitted to the white matter/grey matter intersection, which created the inner surface of the cortex which was then expanded to fit the grey matter/cerebrospinal fluid intersection, thereby creating the outer cortical surface. Cortical thickness was estimated by taking the distance between the two surfaces such that each of the 81 924 vertices of the polygons on the outer surface had a counterpart vertex on the inner surface. The surfaces of both measurements for each participant were registered to an average surface created from 152 individuals (Lyttelton et al. Reference Kabani, Le Goualher, MacDonald and Evans2007). Regions of interest (ROIs) were automatically segmented using the automated anatomical labelling atlas (Tzourio-Mazoyer et al. Reference Tzourio-Mazoyer, Landeau, Papathanassiou, Crivello, Etard, Delcroix, Mazoyer and Joliot2002), resulting in 78 ROIs (39 for both left and right hemispheres). Mean cortical thickness and mid-surface (in between the cerebrospinal fluid/grey and grey/white surface) were computed for each individual in each ROI.
Statistical analysis
Demographic and clinical data
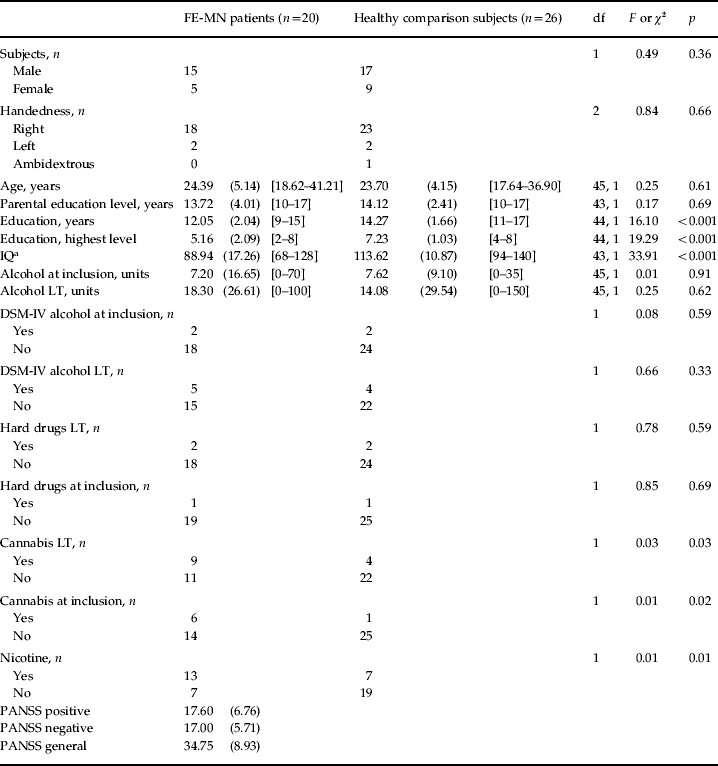
To assess whether the groups differed on demographic or clinical variables, multiple analyses of variance were conducted for non-categorical variables (including IQ) and χ2 analyses for categorical variables (Table 1).
Demographic and clinical data of the FE-MN patients with schizophrenia and healthy comparison subjects

Data are given as mean (standard deviation) [range], or as number of subjects.
FE-MN, First-episode medication-naive; df, degrees of freedom; IQ, intelligence quotient; DSM-IV, Diagnostic and Statistical Manual of Mental Disorders, fourth edition; LT, lifetime; PANSS, Positive and Negative Syndrome Scale.
a IQ not available for two patients.
Group differences in brain volumes and IQ
To assess whether brain volumes differed between medication-naive patients and healthy comparison subjects, multiple regression analyses were performed with brain volumes as the dependent variable and group (schizophrenia patient, healthy comparison), intracranial volume, age and sex as independent variables. Also, using Pearson product-moment correlations the association between global brain volume (corrected for age, sex and intracranial volume) and IQ was investigated, both in the total sample as well as by group.
Group differences in cortical thickness and surface
First, group differences in mean cortical thickness and surface were calculated by using regression analyses with diagnosis (patient–control), age and sex as covariates.
To evaluate the differences in cortical thickness and surface between the groups a ROI analysis was carried out. In each ROI, group differences in cortical thickness and cortical surface were calculated by using regression analyses with diagnosis (patient–control), age, handedness and sex as covariates. This produced t statistics at each ROI, one for the effect of diagnosis, one for the effect of age, one for the effect of handedness, and one for the effect of sex. We adjusted for multiple comparisons using a false discovery rate (FDR=0.05, two-tailed). Statistical maps were created showing significant differences in cortical thickness and surface between patients and healthy comparison subjects. Statistical maps were visualized using the cortical surface viewer Brain-view developed at the Montreal Neurological Institute.
Association with clinical variables
To exclude the effect of alcohol, cannabis or nicotine use all analyses were repeated with, respectively, alcohol abuse/use (yes/no or units per week in the period of most frequent use), cannabis use (yes/no), or nicotine use (yes/no) as covariate. In the case of significant differences in brain volume or cortical thickness/surface between patients and controls, the relationship with the PANSS was investigated, in patients only. Multiple regression analyses were done adding brain volume or cortical thickness (in the most significant peak vertices) as the dependent variable, and the clinical measure, age, sex and intracranial volume (only in case of global brain volumes) as independent variables.
Results
Demographic and clinical data
As shown in Table 1, the groups did not differ significantly with regard to sex, handedness, age and socio-economic status (estimated by the highest level of education reached by one of the parents). Moreover, no differences were found on alcohol or hard-drugs abuse/use lifetime and during the 12 months preceding the MRI scan.
A significantly higher number of schizophrenia patients had a DSM diagnosis of cannabis misuse/abuse compared to the healthy subjects.
The patient group had a significantly lowe IQ compared to the healthy comparison subjects [IQpatients=88.94 (s.d.=17.26); IQcontrols=113.62 (s.d.=10.87)].
Group differences in brain volumes
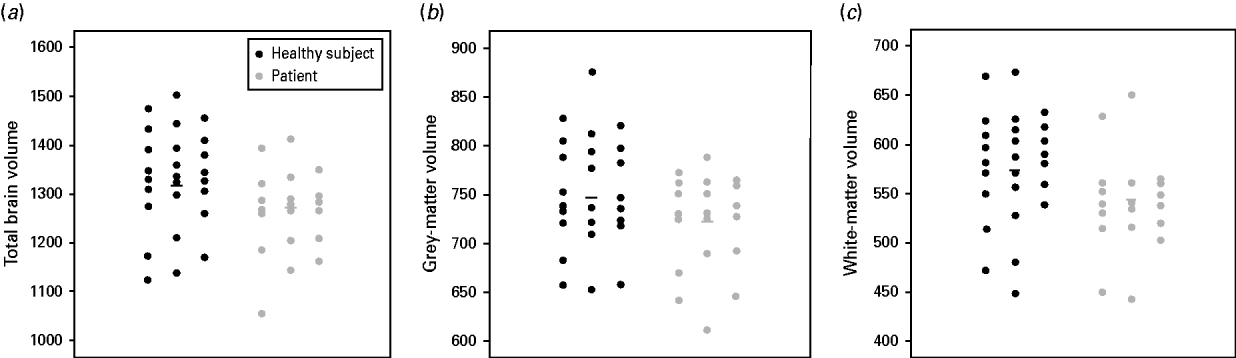
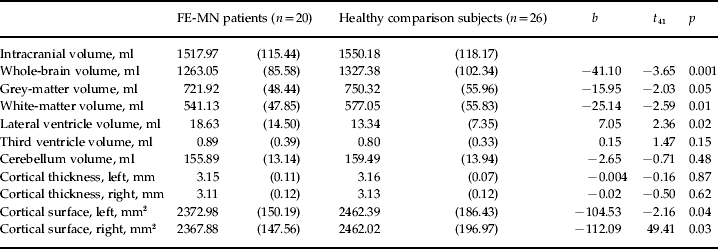
As shown in Table 2 and Figs 1 and 2, a significant decrease in whole-brain volume (b=−41.1 ml, t 41=−3.65, p=0.001) was found in medication-naive first-episode schizophrenia patients compared to healthy controls. In addition, both grey- and white-matter volume were decreased in patients compared to controls (grey matter: b=−16.0 ml, t 41=−2.03, p=0.05; white matter: b=−25.1 ml, t 41=−2.59, p=0.01). Furthermore, a significant lateral ventricle enlargement was found in patients compared to controls (b=7.1 ml, t 41=2.36, p=0.02).
(a) Total-brain volume, (b) grey-matter volume and (c) white-matter volume in first-episode medication-naive schizophrenia patients (
 ) and healthy comparison subjects (•). Thick bold line (–), represents mean value.

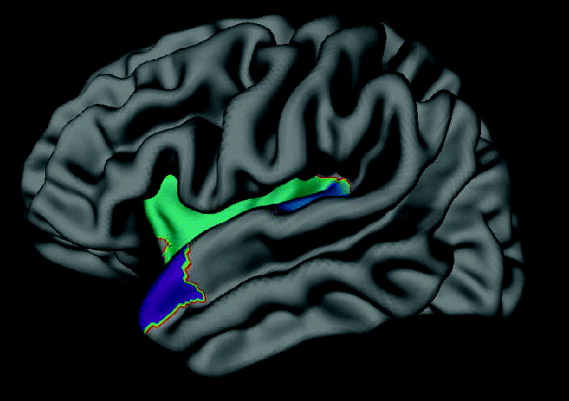
In medication-naive patients the left superior temporal pole, Heschl's gyrus and the insular cortex have a significantly smaller surface area compared to healthy controls (false discovery rate corrected: p<0.002).

Brain volumes in FE-MN patients with schizophrenia and healthy comparison subjects

Data are given as mean (standard deviation).
FE-MN, First-episode medication-naive.
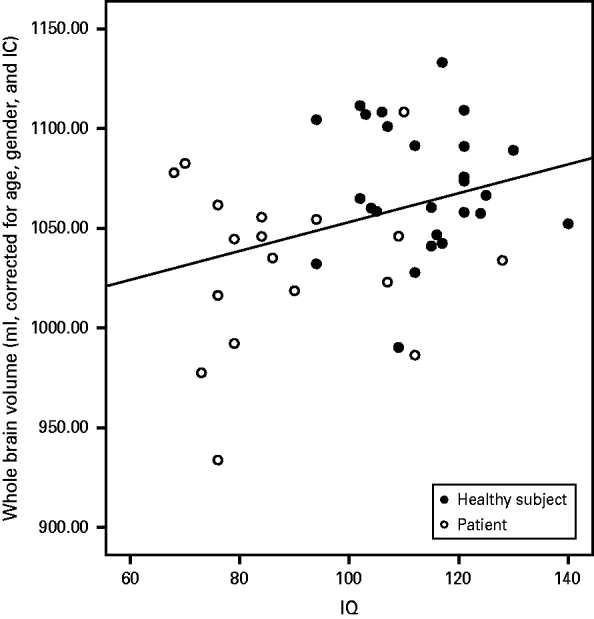
Both whole-brain volume and white-matter volume were positively associated with IQ in the whole group (whole brain: r=0.33, p=0.03; white matter: r=0.31, p=0.04). Lateral ventricle volume was negatively correlated with IQ (r=−0.35, p=0.02). No significant correlations were found between IQ and brain volume in the separate groups (see Fig. 2).
Excluding one patient with an IQ below 70 did not change these findings.
Group differences in cortical thickness and surface
Finally, as shown in Table 2, no significant differences in mean total or ROI cortical thickness were found between schizophrenia patients and healthy comparison subjects. Left and right mean cortical surfaces were significantly smaller in medication-naive patients compared to controls (p<0.05). Significantly decreased cortical surface was found in medication-naive patients in the left insular, Heschl's gyrus and superior temporal pole (FDR-corrected: p<0.002; see Fig. 3).
Association between whole-brain volume (corrected for age, sex and intracranial volume) and intelligence quotient (IQ) in first-episode medication-naive schizophrenia patients (○) and healthy comparison subjects (•). –––, Correlation in the whole sample (R 2 linear=0.106).

No significant correlations with IQ were found with left and right cortical thickness and cortical surface in the total sample, or in the individual groups.
All analyses were repeated leaving out three patients who had received medication at time of scanning. This did not change our findings. In addition to the earlier findings, the cortical surface of the superior parietal cortex was significantly smaller in medication-naive patients compared to controls (FDR-corrected: p=0.005).
Association with clinical variables
Adding alcohol, cannabis or nicotine use as covariate did not change the direction of the effects for total-brain, grey- and white-matter volume.
A negative correlation was found between whole-brain volume and total score on the general subscale of the PANSS (b=−2.2, t 15=−2.52, p=0.02) while the correlation with white-matter volume reached trend level (white matter: b=−1.2, t 15=−1.98, p=0.07). These correlations indicate that a smaller volume is associated with a higher level of symptoms.
Discussion
This cross-sectional structural MRI study compared global brain volumes and cortical thickness between 20 first-episode medication-naive schizophrenia patients and 26 healthy comparison subjects. Our main finding is a reduction of whole-brain volume in medication-naive patients compared to matched healthy controls, which can be explained by reductions in both grey as well as white matter. In addition, a significant increase in lateral ventricle volume was found.
Our data suggest that brain abnormalities are indeed present at the onset of the illness and that they are not related to the effect of antipsychotic medication. Evidence from animal and human studies suggests that antipsychotic medication affects brain morphology. The direction of the effect is not consistent. A study in non-human primates showed that chronic, therapeutic-like daily exposure to either haloperidol or olanzapine antipsychotic is associated with a reduction of whole-brain volume affecting both grey and white matter (Dorph-Petersen et al. Reference Dorph-Petersen, Pierri, Perel, Sun, Sampson and Lewis2005). Reviews of human studies point out that antipsychotic treatment might potentially contribute (possibly with different effects, including ‘protective effects’, being associated with different antipsychotics) to the morphological changes in the brain observed in psychosis (Navari & Dazzan, Reference Navari and Dazzan2009; Moncrieff & Leo, Reference Moncrieff and Leo2010).
That brain volume decrease is present at illness onset and is not a consequence of the intake of antipsychotic medication is consistent with structural MRI studies in high-risk subjects. Many of those converting to psychosis not only have more pronounced neuroanatomical abnormalities before the first psychotic episode but also show further changes in grey- (Pantelis et al. Reference Pantelis, Velakoulis, McGorry, Wood, Suckling, Phillips, Yung, Bullmore, Brewer, Soulsby, Desmond and McGuire2003; Borgwardt et al. Reference Borgwardt, Riecher-Rossler, Dazzan, Chitnis, Aston, Drewe, Gschwandtner, Haller, Pflüger, Rechsteiner, D'Souza, Stieglitz, Radü and McGuire2007; for a review, see Pantelis et al. Reference Pantelis, Yucel, Wood, Velakoulis, Sun, Berger, Stuart, Yung, Phillips and McGorry2005) and possibly white-matter volume (Walterfang et al. Reference Walterfang, McGuire, Yung, Phillips, Velakoulis, Wood, Suckling, Bullmore, Brewer, Soulsby, Desmond, McGorry and Pantelis2008) after psychosis onset (for a review and meta-analysis, see Smieskova et al. Reference Smieskova, Fusar-Poli, Allen, Bendfeldt, Stieglitz, Drewe, Radue, McGuire, Riecher-Rössler and Borgwardt2010). Interestingly, Ziermans et al. (Reference Ziermans, Schothorst, Schnack, Koolschijn, Kahn, van Engeland and Durston2010) showed progressive whole-brain and white-matter volume loss in unmedicated ultra-high-risk subjects converting to psychosis compared to non-converters and control groups.
Whether the decrease in whole-brain volume we find in medication-naive patients is indeed a global effect or is the result of the volume loss in specific ROIs is difficult to answer from this study. We could not detect a significant focal loss of cortical thickness; however, the size of our sample limits the statistical power to find effects in such measurements. However, cortical grey-matter volume is the product of cortical thickness and cortical surface area. Consequently, our findings suggest that the reduced grey-matter volume is the result of a smaller surface area of the left insular cortex, superior temporal pole and Heschl's gyrus. This is in line with a previous study in medicated first-episode psychosis patients, showing reductions in cortical surface, particularly in the temporal cortex. Interestingly, this study showed a significant association between IQ at disease onset with frontotemporal surface, which we could not replicate (Gutiérrez-Galve et al. Reference Gutiérrez-Galve, Wheeler-Kingshott, Altmann, Price, Chu, Leeson, Lobo, Barker, Barnes, Joyce and Ron2010).
It has been proposed that independent genetic processes determine the development of cortical thickness and cortical surface (Panizzon et al. Reference Panizzon, Fennema-Notestine, Eyler, Jernigan, Prom-Wormley, Neale, Jacobson, Lyons, Grant, Franz, Xian, Tsuang, Fischl, Seidman, Dale and Kremen2009; Winkler et al. 2009). Interestingly, it might be that surface area is determined earlier in neurodevelopment and is less affected by environmental factors than is cortical thickness (Rakic, Reference Rakic1988; Prasad et al. Reference Prasad, Goradia, Eack, Rajagopalan, Nutche, Magge, Rajarethinam and Keshavan2010; Eyler et al. Reference Eyler, Prom-Wormley, Panizzon, Kaup, Fennema-Notestine, Neale, Jernigan, Fischl, Franz, Lyons, Grant, Stevens, Pacheco, Perry, Schmitt, Seidman, Thermenos, Tsuang, Chen, Thompson, Jak, Dale and Kremen2011). Therefore, our data may indicate that reduced cortical surface in medication-naive patients reflects aberrant early neurodevelopment, while the excessive reductions of cortical thickness over time that are found in patients who are ill longer can be explained by the illness or illness-related factors, such as duration of psychosis (Cahn et al. Reference Cahn, Rais, Stigter, van Haren, Caspers, Hulshoff Pol, Xu, Schnack and Kahn2009), cannabis (Rais et al. Reference Rais, van Haren, Cahn, Schnack, Lepage, Collins, Evans, Hulshoff Pol and Kahn2010) or medication (van Haren et al. Reference van Haren, Schnack, Cahn, van den Heuvel, Lepage, Collins, Evans, Hulshoff Pol and Kahn2011).
Following this line of reasoning, it is particularly cortical surface that might be useful as an imaging phenotype for genetic studies in schizophrenia. Moreover, it might be a good candidate for studies on early diagnosis and prevention of psychosis.
Previous MRI studies in medication-naive schizophrenia patients have reported decreased volumes of cortical and subcortical ROIs, such as the pituitary (Upadhyaya et al. Reference Upadhyaya, El-Sheikh, MacMaster, Diwadkar and Keshavan2007), the caudate nucleus (Keshavan et al. Reference Keshavan, Rosenberg, Sweeney and Pettegrew1998; Corson et al. Reference Corson, Nopoulos, Andreasen, Heckel and Arndt1999; Ebdrup et al. Reference Ebdrup, Glenthoj, Rasmussen, Aggernaes, Langkilde, Paulson, Lublin, Skimminge and Baaré2010), the entorhinal cortex and the parahippocampal gyrus (Joyal et al. Reference Joyal, Laakso, Tiihonen, Syvalahti, Vilkman, Laakso, Alakare, Räkköläinen, Salokangas and Hietala2002; Prasad et al. Reference Prasad, Patel, Muddasani, Sweeney and Keshavan2004a , Reference Prasad, Rohm and Keshavanb), the thalamus (Gur et al. Reference Gur, Maany, Mozley, Swanson, Bilker and Gur1998), the amygdala (Joyal et al. Reference Joyal, Laakso, Tiihonen, Syvalahti, Vilkman, Laakso, Alakare, Räkköläinen, Salokangas and Hietala2003), the corpus callosum (Keshavan et al. Reference Keshavan, Diwadkar, Harenski, Rosenberg, Sweeney and Pettegrew2002) and the hippocampus (Ebdrup et al. Reference Ebdrup, Glenthoj, Rasmussen, Aggernaes, Langkilde, Paulson, Lublin, Skimminge and Baaré2010). In addition, Venkatasubramanian et al. (Reference Venkatasubramanian, Jayakumar, Gangadhar and Keshavan2008) and Narr et al. (Reference Narr, Bilder, Toga, Woods, Rex, Szeszko, Robinson, Sevy, Gunduz-Bruce, Wang, DeLuca and Thompson2005a , Reference Narr, Toga, Szeszko, Thompson, Woods, Robinson, Sevy, Wang, Schrock and Bilderb) showed cortical thickness decreases in frontal and temporal areas in a relatively large sample of first-episode patients. However, in the patient sample of Narr et al. (Reference Narr, Bilder, Toga, Woods, Rex, Szeszko, Robinson, Sevy, Gunduz-Bruce, Wang, DeLuca and Thompson2005a , Reference Narr, Toga, Szeszko, Thompson, Woods, Robinson, Sevy, Wang, Schrock and Bilderb) only 39 out of 72 patients were medication-naive, while the remainder was minimally treated.
In our earlier MRI study in medication-naive patients with schizophrenia (Cahn et al. Reference Cahn, Hulshoff Pol, Bongers, Schnack, Mandl, van Haren, Durston, Koning, van der Linden and Kahn2002) we reported no differences between patients and controls in global (and subcortical) brain structures, except for an enlargement of the third ventricle. Surprisingly, the patients had an IQ comparable with that of the healthy comparison subjects (IQs were 109 and 114, respectively).
In the current study, patients had a significantly lower IQ than healthy comparison subjects (IQ=89 and IQ=114, respectively), despite a similar level of parental education in both groups. Not only did we find evidence for lower intellectual performance just after onset of the psychosis, but patients also had a lower level and fewer years of education, which indicate a poorer cognitive development before onset (see Table 1). In agreement with prior studies in healthy subjects (Andreasen et al. Reference Andreasen, Flaum, Swayze, O'Leary, Alliger, Cohen, Ehrhardt and Yuh1993; Narr et al. Reference Narr, Woods, Thompson, Szeszko, Robinson, Dimtcheva, Gurbani, Toga and Bilder2007) and schizophrenia patients (Toulopoulou et al. Reference Toulopoulou, Grech, Morris, Schulze, McDonald, Chapple, Rabe-Hesketh and Murray2004; Antonova et al. Reference Antonova, Kumari, Morris, Halari, Anilkumar, Mehrotra and Sharma2005; for a review, see Antonova et al. Reference Antonova, Sharma, Morris and Kumari2004) we also found a relationship between IQ and brain volume, irrespective of diagnosis. However, Fig. 2 clearly shows that there is only a correlation because patients differ from controls on both variables, i.e. they had a lower brain volume and they had a lower IQ. Although we cannot test the directionality of the association, it may be argued that the smaller brain volume in schizophrenia at the onset of psychosis is related to their abnormal cognitive development prior to the onset of psychosis.
It cannot be claimed that the association between IQ and whole-brain volume is specific for schizophrenia. Lower IQ seems to be a general risk factor for common mental disorders (Rajput et al. Reference Rajput, Hassiotis, Richards, Hatch and Stewart2011). Indeed, the present data show associations between volumes of the whole brain and cerebral white matter and the general psychopathology subscale of the PANSS, which seems to suggest that the relationship between IQ and whole-brain volume is not specific to psychosis.
Higher PANSS scores in the general psychopathology scale were correlated with a smaller whole-brain volume in the patients.
Several limitations of this study should be taken into consideration. First the number of subjects included was limited. This might account for not finding a statistical difference in cortical thickness between first-episode patients and healthy comparison subjects. In addition, our patients and controls were not matched on nicotine and lifetime and present cannabis abuse/use. However, correcting our analysis for nicotine or cannabis use did not change the direction of our findings. Moreover, three of the patients received small amounts of antipsychotic medication at the time of scanning, but findings were similar, or even more extensive, when we excluded these patients from the analyses.
In conclusion, we showed that whole-brain volume is decreased in medication-naive first-episode patients, due to smaller grey- and white-matter volumes. This smaller brain volume could be partially explained by the (lowered) IQ and general psychopathology symptom severity in the patients. This finding suggests that brain abnormalities are present at illness onset, are independent of medication and are related to the cognitive and general symptoms of the illness.
Declaration of Interest
N.E.M.v.H. has received honoraria for education programmes from AstraZeneca, Eli Lilly and Janssen-Cilag. W.C. has received grants and honoraria for education programmes from, or served as consultant for Eli Lilly, AstraZeneca, Bristol-Myers Squibb, Janssen-Cilag, Sanofi-Aventis, Lundbeck and Schering-Plough. H.E.H.P. has received honoraria for education programmes from Ferris and Lundbeck. R.H.K. has received grants and honoraria for education programmes from, or served as consultant for Astellas, AstraZeneca, BMS, Dainippur, Eli Lilly, GSK, Johnson & Johnson, Janssen-Cilag, Pfizer, Roche and Sanofi-Aventis.